
 Open Access Article
 This Open Access Article is licensed under a Creative Commons Attribution-Non Commercial 3.0 Unported Licence
An easily modified method using FeCl3 to synthesize nanoporous gold with a high surface area†
Kenan Shaoa,
Chun Fanga,
Yinfang Yaoa,
Canyun Zhaoa,
Zhi Yanga,
Jianguo Liu *ab and
Zhigang Zou*ab
*ab and
Zhigang Zou*ab
aJiangsu Key Laboratory for Nano Technology, National Laboratory of Solid State Microstructures, College of Engineering and Applied Sciences, Collaborative Innovation Center of Advanced Microstructures, Nanjing University, 22 Hankou Road, Nanjing 210093, China. E-mail: jianguoliu@nju.edu.cn; zgzou@nju.edu.cn
bKunshan Innovation Institute of Nanjing University, Kunshan Sunlaite New Energy Co., Ltd., 1699 South Zuchongzhi Road, Kunshan, Suzhou 215347, China
First published on 27th March 2017
Abstract
Here, we report a two-step dealloying method using ferric chloride to synthesize nanoporous gold (NPG), instead of the traditional corrosive nitric acid method. In the new method, the pore size can be easily controlled by using various solutions and additives. For example, when using ethylene glycol (EG) as a solvent, the NPG (NPG-EG) pore size can be made as small as 8 nm, thus increasing the electrochemical specific surface area of the NPG to seven times higher than that of traditional NPG with a pore size of 25 nm. NPG-EG showed an enhanced capacitance of 1340 F g−1 at a current density of 2.0 A g−1 when electrodeposited with Ni3S2.
1. Introduction
In recent years, strategies for synthesizing nanoporous materials and applications of these materials have been intensively pursued because of the strong porosity-induced enhancement of their properties.1–6 After Jonah Erlebacher and co-workers developed the concentrated nitric acid (HNO3) dealloying method to fabricate a nanoporous gold (NPG) leaf,7 many results related to the usage of this material have been reported. Ling Zhang and his co-workers took advantage of wrinkled NPG films that contained abundant Raman-active nanogaps to yield surface-enhanced Raman scattering intensity.8 Roswitha Zeis et al. applied platinum-plated nanoporous gold into hydrogen/oxygen fuel cells and gained a maximum power generation of ∼250 mW cm−2 at Pt loads of ∼0.03 mg cm−2.9 F. Meng and Y. Ding showed that a nanocomposite of polypyrrole (PPy)-decorated NPG could form an all-solid-state supercapacitor with great volumetric capacitance and high power and energy densities.10 However, rearrangement during dealloying is usually very rapid when involving the strong acid that is used or during alkali corrosion,11 leaving little ability to adjust the porosity features in such nanoporous products.In this work, we designed an easily modified two-step method using FeCl3 to fabricate NPG and further improved the specific surface area (SSA) of the NPG by tuning the reaction conditions. To activate the reaction, we introduced halogen ions (Cl−, Br−, I−) to lower the oxidation potential ( , E0AgCl/Ag = +0.222 V, E0AgBr/Ag = +0.071 V, E0AgI/Ag = −0.152 V vs. standard hydrogen electrode, SHE). In the presence of halogen ions, ferric ions (Fe3+) and even copper ions (Cu2+) were able to oxidize Ag
  .
.
2. Experimental section
2.1 Material preparation
Films made of an alloy of Ag and 12 carat Au (Sepp Leaf Products, New York) were used to prepare nanoporous gold (NPG) films. Nitric acid (69.0%), ferric chloride (FeCl3·6H2O, 99.0%), ferric bromide (FeBr3, 95.0%), copper chloride (CuCl2, 99.0%), stannic chloride (SnCl4, 99.0%), Na2S2O3·5H2O (99.0%) and nickel chloride (NiCl2, 99.5%) were all purchased from Sigma-Aldrich. Other reagents employed in this work were analytically pure and used without further purification. An Au/Ag alloy film with dimensions of 2 cm by 2 cm and with an Au-to-Ag atomic ratio of 35![[thin space (1/6-em)]](https://www.rsc.org/images/entities/char_2009.gif) :65 was floated on the surface of an FeCl3 solution for a specified period of time. The alloy film was rinsed three times in ultra-pure water (18.2 MΩ cm), and then transferred onto a 1.0 M Na2S2O3 solution to remove AgCl. At last, it was rinsed twice again. We also employed FeBr3, CuCl2, and SnCl4, respectively, to prepare other NPGs in exactly the same way as we employed FeCl3 in order to find the best oxidant.
:65 was floated on the surface of an FeCl3 solution for a specified period of time. The alloy film was rinsed three times in ultra-pure water (18.2 MΩ cm), and then transferred onto a 1.0 M Na2S2O3 solution to remove AgCl. At last, it was rinsed twice again. We also employed FeBr3, CuCl2, and SnCl4, respectively, to prepare other NPGs in exactly the same way as we employed FeCl3 in order to find the best oxidant.
2.2 Microstructure characterizations
The microstructure and chemical composition of the as-synthesized NPG were examined by scanning electron microscopy (SEM, NOVA NANOSEM 230, FEI, USA) equipped with energy dispersive spectroscopy (EDS) at 15 keV and transmission electron microscopy (TEM, TC20, FEI, USA) with EDS at 200 keV. X-ray diffraction (XRD) patterns were obtained on a Rigaku D/MAX-Ultima III X-ray diffractometer using Cu Kα radiation (λ = 0.15406 nm) with a 2θ angular range of 10° to 80° at a scan rate of 10° min−1.2.3 Electrodeposition of Ni3S2 and electrochemical measurements
Electrochemical measurements were taken at an electrochemical station (PARSTAT 2273, Princeton Applied Research). A platinum electrode and a silver chloride (Ag/AgCl) electrode served as a counter electrode and reference electrode, respectively. A glassy carbon disk with a diameter of 3 mm was employed as a working electrode. The electrochemical deposition of Ni3S2 using cyclic voltammetry (CV) was performed for the potential range −1.2 V to 0.2 V vs. Ag/AgCl at a scan rate of 5 mV s−1 for ten cycles. The deposition bath was composed of 50 mM NiCl2·6H2O and 1 M thiourea. An as-prepared NPG@Ni3S2 electrode was rinsed with deionized water and subsequently dried in vacuum conditions at 60 °C for 12 h. The mass of the electrodeposited Ni3S2 was measured by using an inductively coupled plasma (ICP) emission spectrometer. Cyclic voltammetry and galvanostatic charge–discharge tests were carried out using a 2.0 M aqueous KOH solution saturated with highly purified nitrogen at potentials between 0 V and 0.60 V and between −0.05 V and 0.45 V vs. Ag/AgCl, respectively.3. Results and discussion
The morphologies of NPG films corroded using various oxidants are shown in Fig. S1.† NPG corroded using an FeCl3 solution was observed to have a typical bicontinuous structure with pores similar to NPG made using HNO3. However, FeBr3 and CuCl2 did not corrode the alloy completely and the pores were not distributed uniformly. Hence, the subsequent experiments were optimized using ferric chloride (denoted as NPG-H), as discussed below.The whole dealloying process is illustrated in Scheme 1. During the reaction in the FeCl3 solution, the Au–Ag alloy served as a template to guide the AgCl to nucleate.11 The cross-section (Fig. 1) and plane-section (Fig. S2†) SEM images of the Au–Ag alloy samples at different etching times showed that the reaction took place very rapidly (in less than 30 seconds). Here, the AgCl nanocrystals grew on the surface of the alloy film by following a Volmer–Weber growth model12 during the corrosion process and tending to the defect sites with their higher surface energy levels, while at the same time the deagglomeration of the Au atoms shaped the bicontinuous structure (denoted as NPG@AgCl). The moderate affinity between Cl− ions and Au can help form sponge-like gold while preventing further gold diffusion.13,14 Also, J. Snyder et al. pointed that further dissolution of Au atoms is rate-limited by dissolution of Ag from nine-coordinated terrace sites in face-centered cubic alloys.15 So we can conclude that a higher Ag content and excess Cl− ions can prevent further Au diffusion. Moreover, the loose morphology of AgCl cannot destroy the continuity of the reaction, so Ag atoms in the inner layer can also be fully corroded.16 AgCl was easily removed by using a 1.0 M sodium hyposulfite (NaS2O3) solution (Fig. S3†), and SEM mapping of a cross-section selected from NPG@AgCl with an etching time of 30 s (Fig. S4†) showed the relative aggregation of Au and Ag, and we concluded that Ag atoms dissolved from the alloy film and formed AgCl, and residual Au atoms formed a porous structure similar to that in NPG prepared using HNO3.
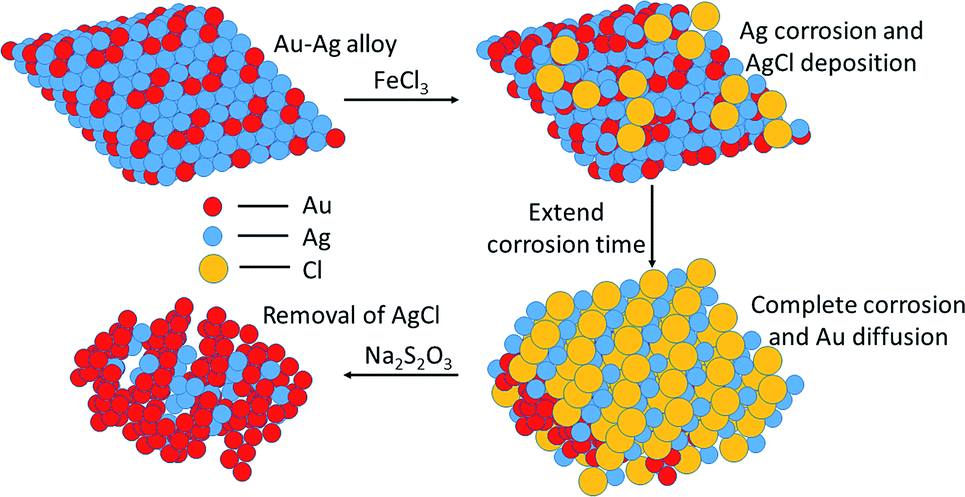 | ||
| Scheme 1 Illustration of the dealloying of nanoporous gold using FeCl3. | ||
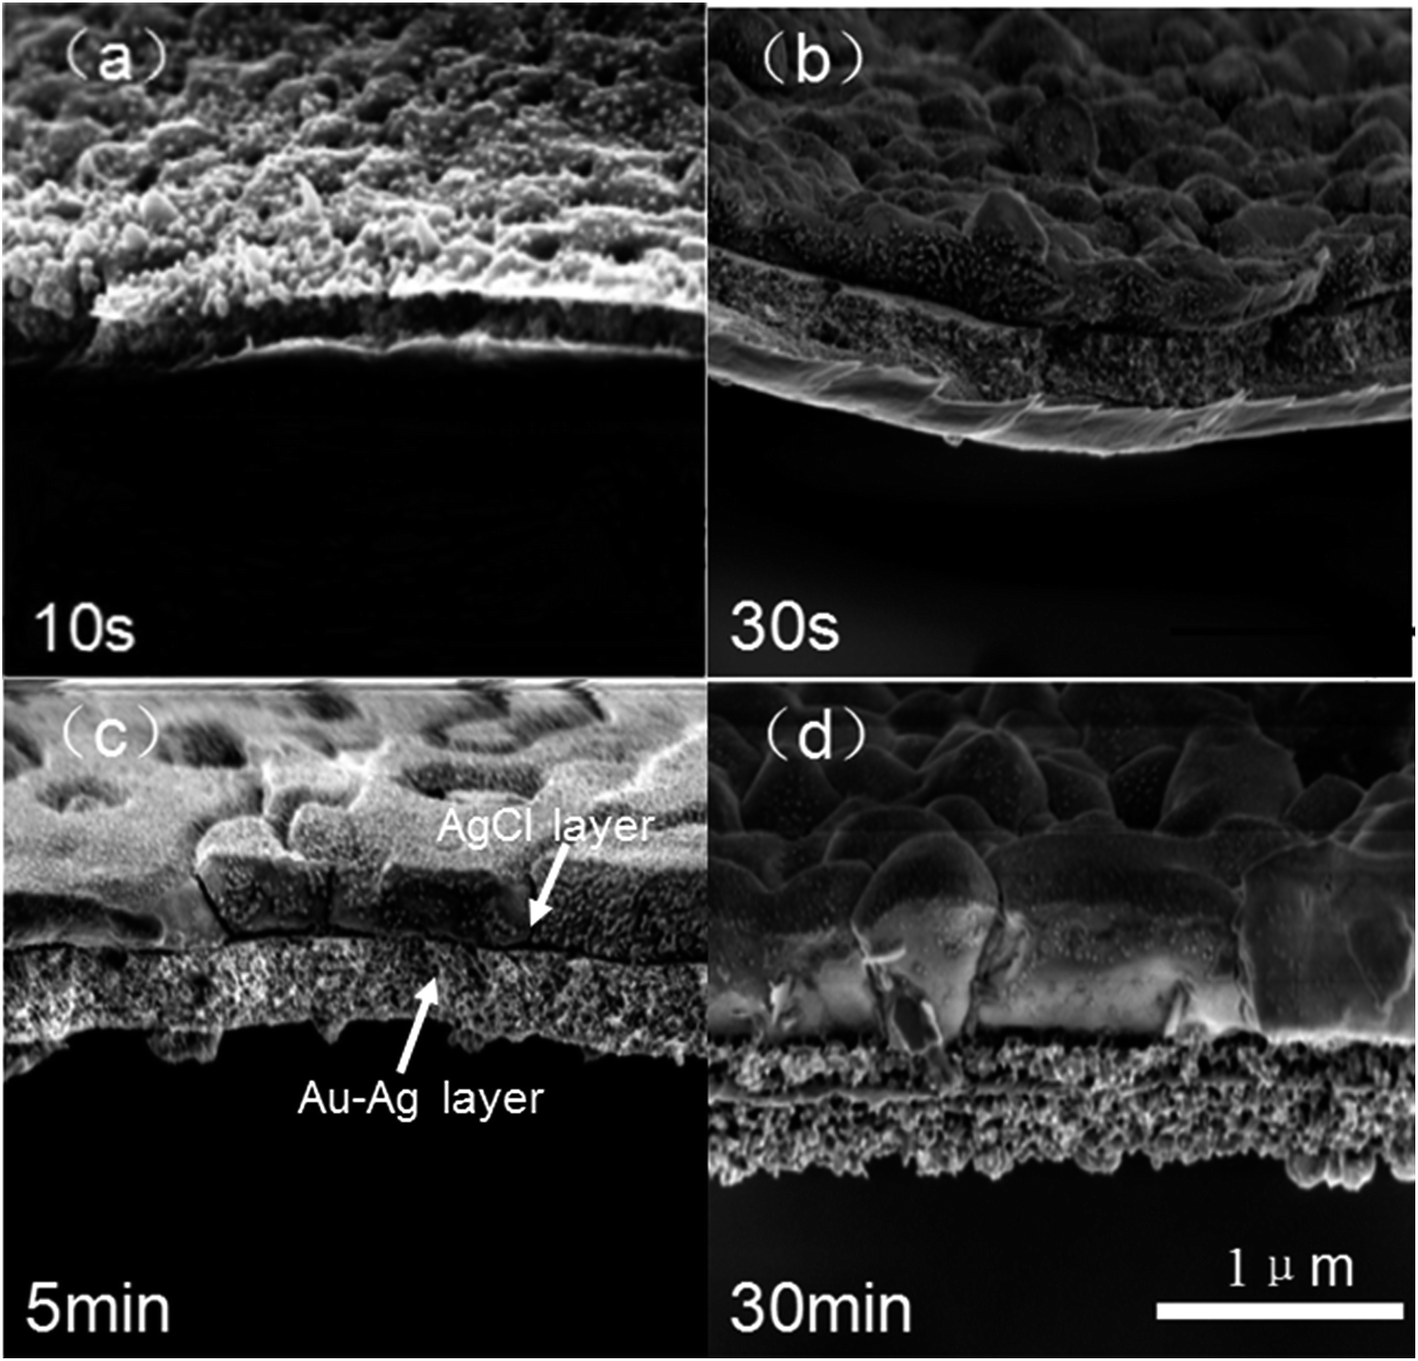 | ||
| Fig. 1 (a)–(d) SEM images of a cross-section of a 400 nm-thick Au–Ag alloy at different etching times in 2 M FeCl3. The AgCl layer and Au–Ag layer are labeled in (c). | ||
Typical SEM and TEM images of NPG prepared using HNO3 (denoted as NPG-N) and NPG-H are shown in Fig. 2(a)–(d). To modify the porosity of the NPG, we added polyvinyl pyrrolidone (PVP) as a surfactant in the FeCl3 solution (denoted as NPG-HP) or employed EG as a solvent instead of water (denoted as NPG-EG). As shown in Fig. S5 and Table S1,† we found that the pore size of NPG decreased from about 25 nm for NPG-N and NPG-H to 10 nm for NPG-HP and 8 nm for NPG-EG. We further determined the electrochemical activity surface areas (ECSAs) of the NPG-N, NPG-H and NPG-EG electrodes, by obtaining cyclic voltammogram (CV) curves of these electrodes in 0.1 M HClO4 solutions. The CV curves of all NPG samples (Fig. S6†) showed two typical Au oxidation peaks between 1.25 V and 1.55 V and a reduction peak between 1.10 V and 1.15 V. The slight negative shift of the reduction peaks relative to the oxidation peaks might have resulted from the presence of more Ag when using FeCl3.17 We calculated the ECSAs of the NPG electrodes by integrating the Au reduction peaks in the range 0.95 V to 1.40 V vs. RHE and then dividing the integral by a charge density of 390 μC cm−2, as reported for Au.18 The roughness factor (Rf) values (surface area/electrode area, using an electrode area of 0.196 cm2) of NPG-N, NPG-H, NPG-HY and NPG-EG were then determined to be 8.6, 17.6, 28.3 and 62.4, respectively. Hence, NPG-EG, with a pore size one-third that of NPG-N, showed a 7.25-fold greater ECSA than did NPG-N.
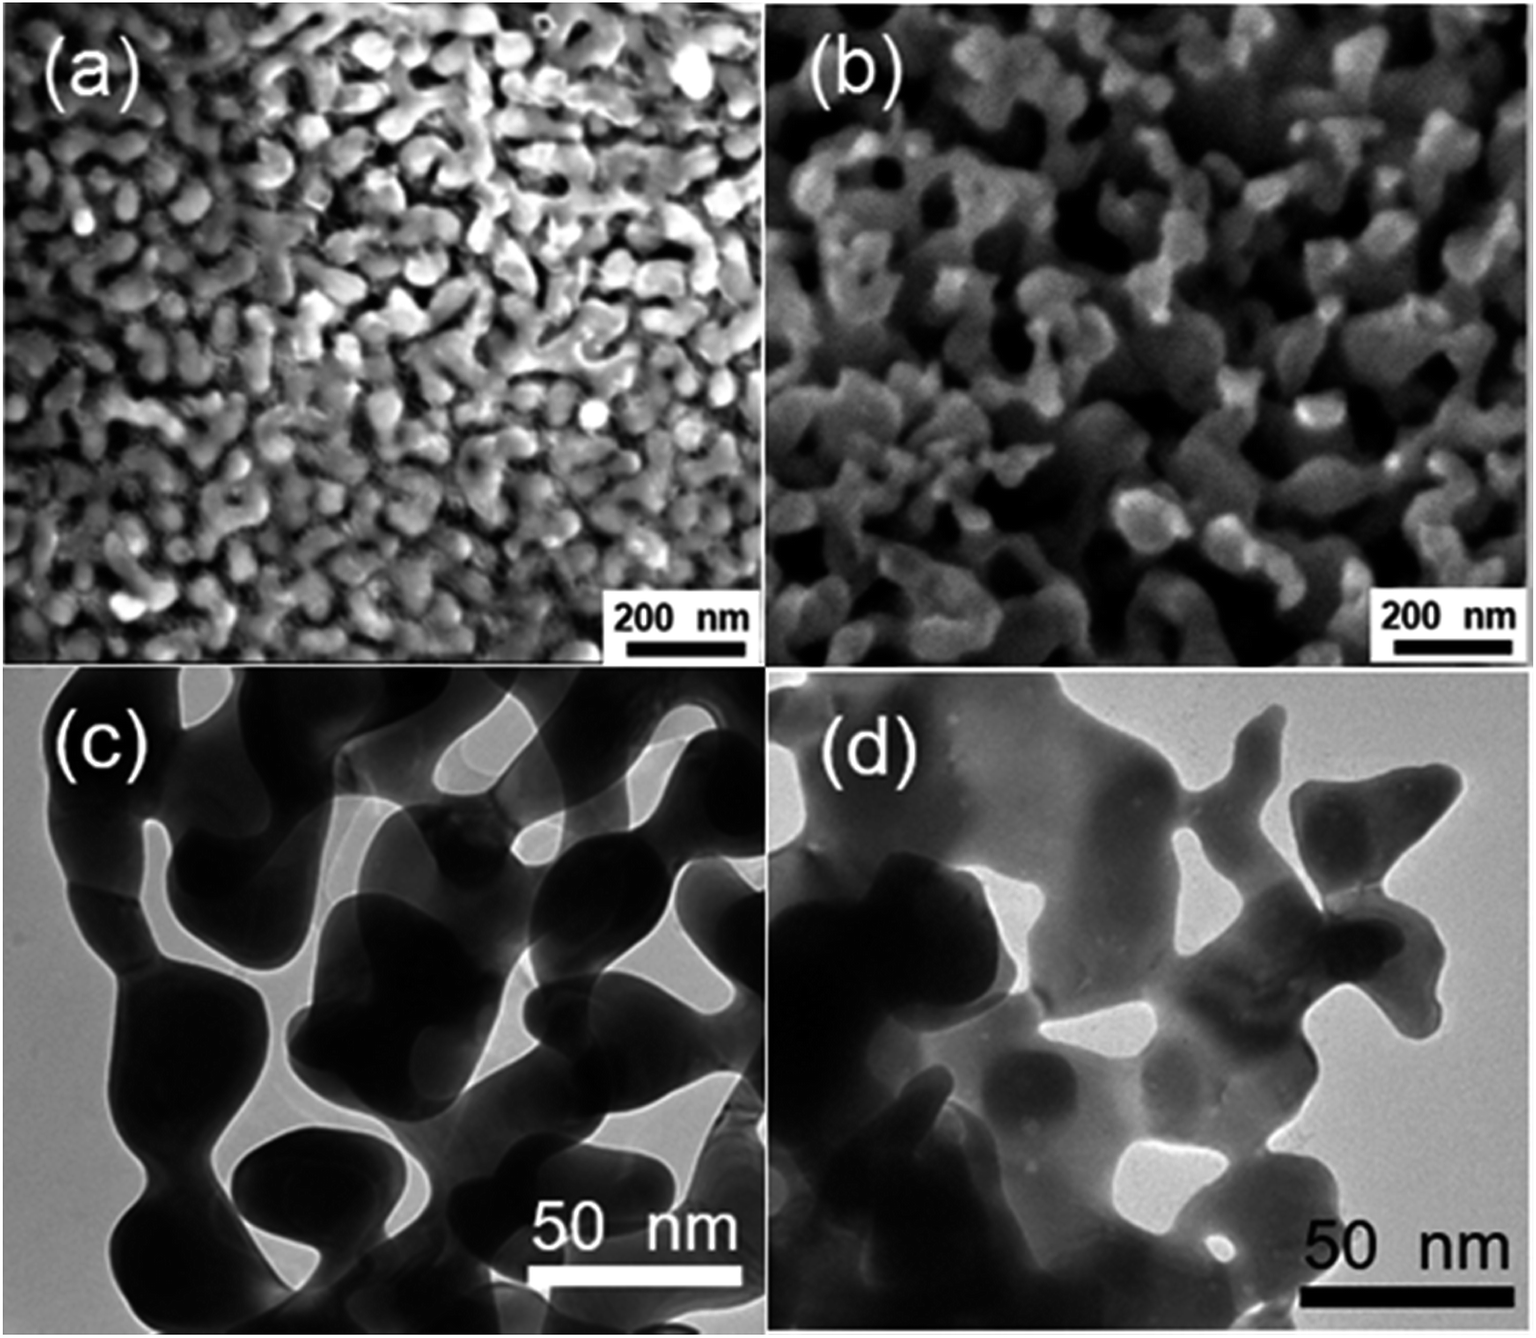 | ||
| Fig. 2 (a and b) SEM and (c and d) TEM images of (a and c) NPG-N and (b and d) NPG-H. | ||
In order to explore the potential of Ni3S2 in the electrochemical field, we electrodeposited it on NPG-EG using methods similar to those described in the paper by X. Sun and colleagues.19 Fig. 3(a) and (b) show the TEM images of NPG-EG and NPG-EG coated with Ni3S2 (denoted as NPG-EG@Ni3S2); the porous bi-continuous structure was observed to be preserved after the electrodeposition with Ni3S2. The XRD spectrum of the as-grown NPG-EG@Ni3S2 sample (Fig. S3†) showed peaks at 2θ = 21.7°, 31.1°, 37.8°, 44.3° and 49.7°, which were attributed to a single crystal of Ni3S2 (JCPDS no. 44-1418). We chose a particular area at the edges of the NPG-EG@Ni3S2 sample that was not covered completely with Ni3S2, and observed it using a high-angle annular dark field (HAADF) TEM (Fig. 3(c)). In the HAADF image, the selected area was observed to be divided by a linear boundary, indicating an NPG/Ni3S2 interface. Fig. 4(a)–(c) show the Au, Ni and S elemental mappings for the area of the NPG-EG@Ni3S2 sample shown in Fig. 3(c). Ni and S were observed in these mappings to be distributed similarly and to be predominantly located on the right side of boundary, with Au predominantly on the left side. The mapping results and a relatively low-resolution TEM image of NPG-EG@Ni3S2 (Fig. S7†) showed that Ni3S2 was uniformly electrodeposited on the surface of the NPG and formed a double-layer structure.
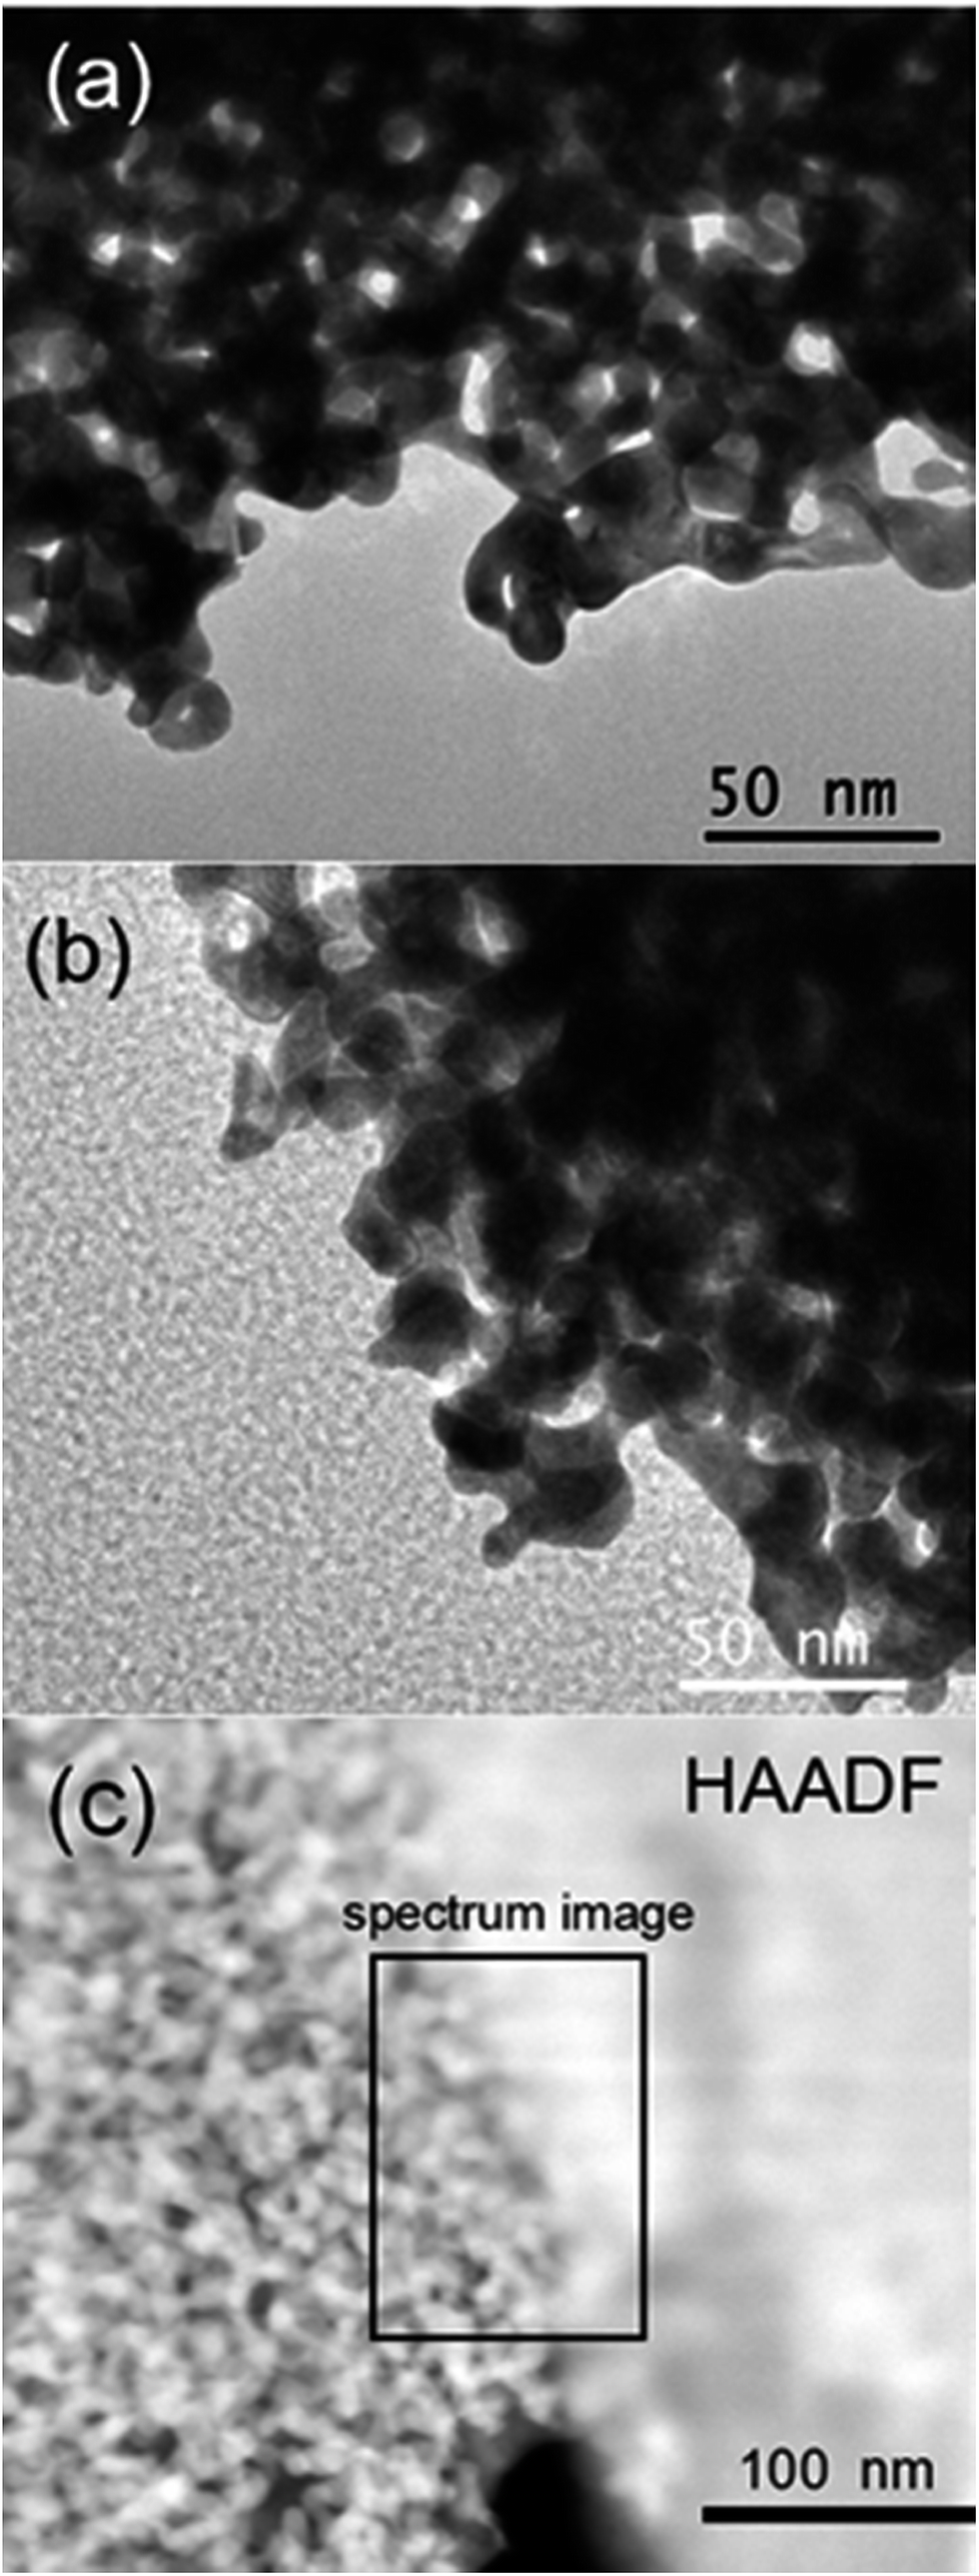 | ||
| Fig. 3 (a and b) TEM images of (a) NPG-EG and (b) NPG-EG@Ni3S2. (c) HAADF TEM image from a selected area at the edges of the NPG-EG@Ni3S2 sample. | ||
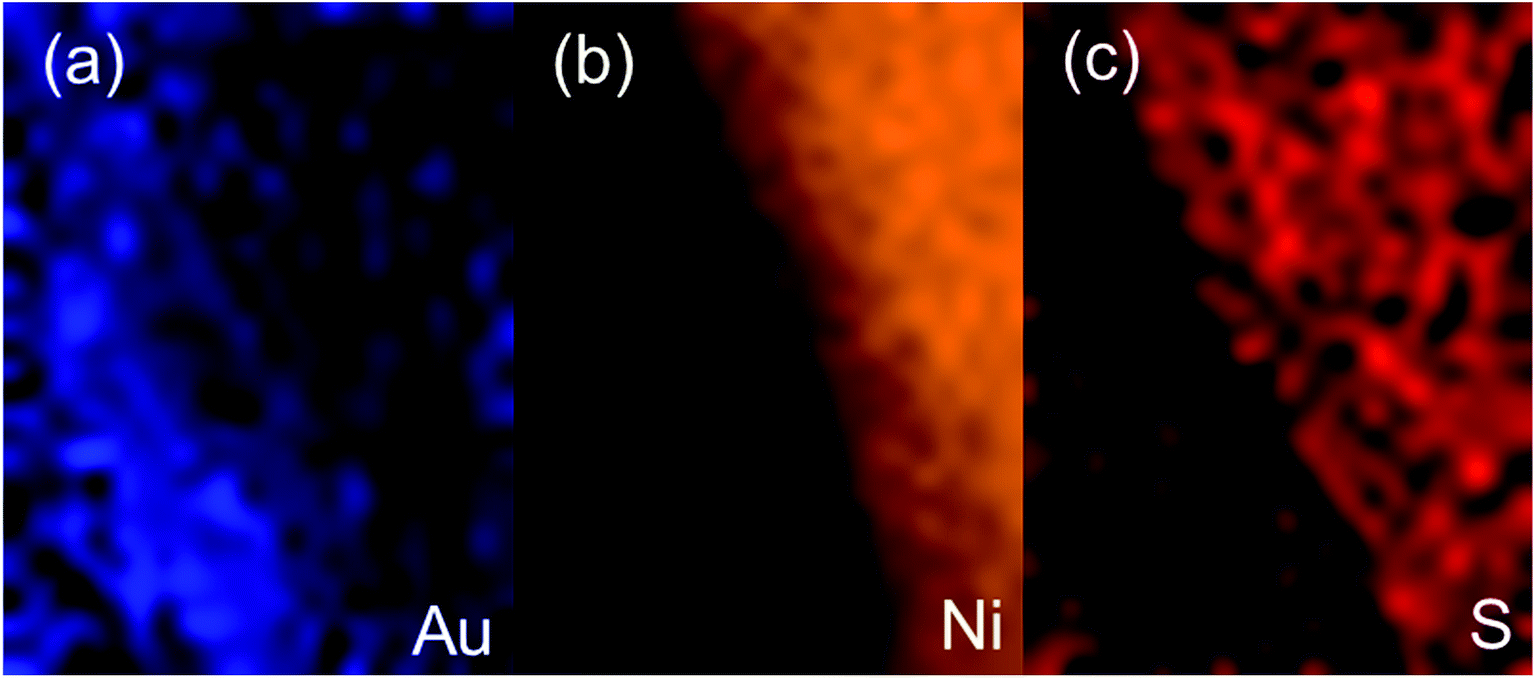 | ||
| Fig. 4 HAADF TEM mapping results (from the rectangled area of Fig. 3(c)) for (a) Au, (b) Ni and (c) S. | ||
Fig. 5(a) shows cyclic voltammogram (CV) curves of NPG-N@Ni3S2, NPG-H@Ni3S2 and NPG-EG@Ni3S2 with a scan rate of 20 mV s−1. All of these curves showed explicit Ni(II) and Ni(III) redox peaks, indicating the presence of a reversible faradaic reaction and pseudocapacitive behaviour:20
| Ni3S2 + 3OH− ↔ Ni3S2(OH)3 + 3e− | (1) |
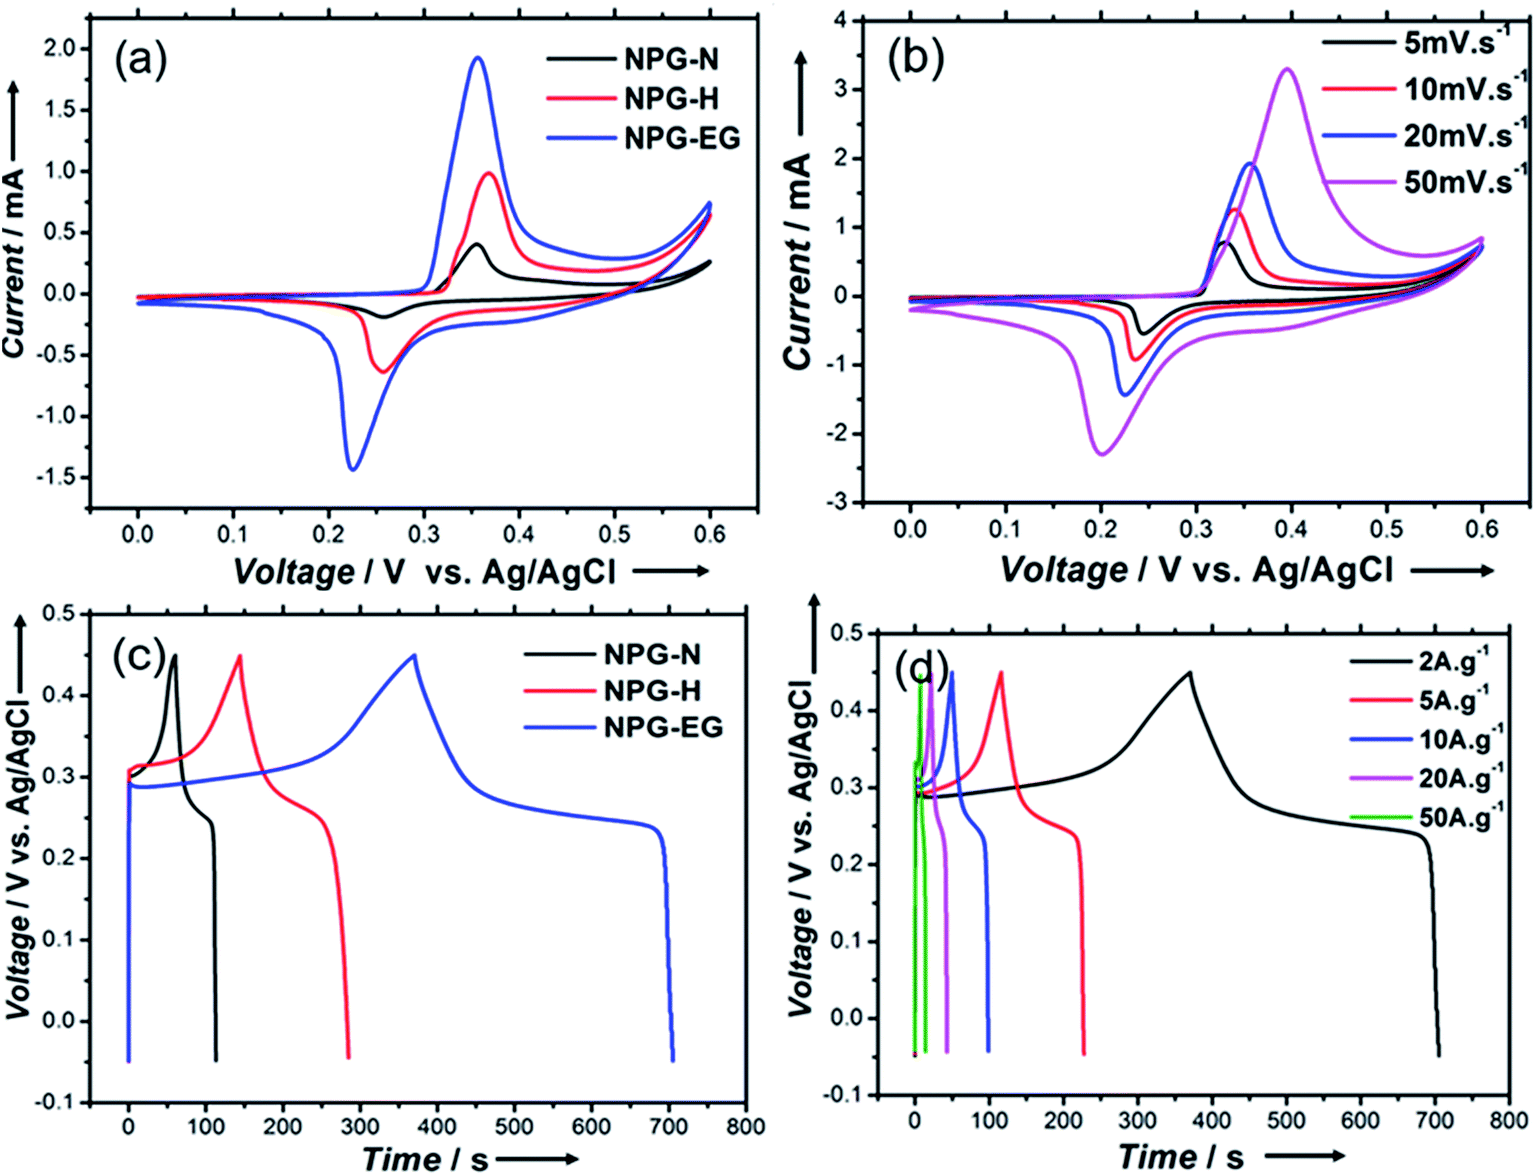 | ||
| Fig. 5 (a and b) Cyclic voltammograms, in the potential range 0 V to 0.6 V, of (a) the NPG-N@Ni3S2, NPG-H@Ni3S2 and NPG-EG@Ni3S2 electrodes at a scan rate of 20 mV s−1 and (b) the NPG-EG@Ni3S2 electrode at various scan rates, with each of the electrodes in 2.0 M KOH. (c and d) Galvanostatic charge–discharge curves, in the potential range −0.05 V to 0.45 V, of (c) the NPG-N@Ni3S2, NPG-H@Ni3S2 and NPG-EG@Ni3S2 electrodes at a current density of 2.0 A g−1 and (d) the NPG-EG@Ni3S2 electrode at various current densities, with each of the electrodes in 2.0 M KOH. | ||
Moreover, the NPG-EG@Ni3S2 electrode showed a larger capacitance than did the NPG-N@Ni3S2 and NPG-H@Ni3S2 electrodes. Fig. 5(b) shows the CV curves of NPG-EG@Ni3S2 at different scan rates from 5.0 mV s−1 to 50 mV s−1. The shapes of the curves remained almost unchanged, suggestive of ideal capacitive behaviours and excellent rate capabilities.21 Fig. 5(c) shows the galvanostatic charge–discharge curves of the NPG-N@Ni3S2, NPG-H@Ni3S2 and NPG-EG@Ni3S2 electrodes at a current density of 2.0 A g−1, and the specific capacitance values of these electrodes were found to be 224 F g−1, 532 F g−1 and 1340 F g−1, respectively. Fig. 5(d) shows the galvanostatic charge–discharge curves of the NPG-EG@Ni3S2 electrode at current densities from 2.0 A g−1 to 50 A g−1, and the specific capacitance at 50 A g−1 was 803 F g−1, i.e., nearly 60% of the capacitance was maintained.
4. Conclusions
In summary, we have successfully synthesized nanoporous gold by using an FeCl3 solution. Due to the AgCl growing as “islands”, the NPG@AgCl template fabricated using FeCl3 apparently prevented further diffusion of Au atoms and made the porosity of the products controllable when just using a surfactant like PVP or replacing the corrosion reaction solvent with EG. Including the EG solvent reduced the pore size of the NPG from 25 nm to about 8 nm. Introducing EG, by apparently causing the ions to move more slowly, reduced the rate of dealloying, hence creating a more delicate structure and more catalytic sites, and leading to a better catalytic performance. Consequently, compared to NPG made using previous methods, the NPG made using our new methods performed better as a substrate of a supercapacitor coated with Ni3S2. In conclusion, our methods offer increased possibilities for using porous metals in a variety of fields such as photocatalysis or Li–S batteries.Acknowledgements
The authors gratefully acknowledge financial support from National Key R&D Plan of China (2016YFB0101308), National Natural Science Foundation of China (20906045, 21476104, 21676135), Joint Funds of the National Natural Science Foundation and Liaoning of China (U1508202), and Natural Science Foundation for Distinguished Young Scholars of Jiangsu Province (BK20150009). Jianguo Liu also thanks the support of PAPD of Jiangsu Higher Education Institutions, QingLan Project of Jiangsu Province, “Six Talent Peaks Program” of Jiangsu Province, and Fundamental Research Funds for the Central Universities, China.Notes and references
- R. Ryoo, S. H. Joo, M. Kruk and M. Jaroniec, Adv. Mater., 2001, 13, 677–681 CrossRef CAS.
- H. Furukawa, N. Ko, Y. B. Go, N. Aratani, S. B. Choi, E. Choi, A. O. Yazaydin, R. Q. Snurr, M. O'Keeffe, J. Kim and O. M. Yaghi, Science, 2010, 329, 424–428 CrossRef CAS PubMed.
- R. K. Dash, G. Yushin and Y. Gogotsi, Microporous Mesoporous Mater., 2005, 86, 50–57 CrossRef CAS.
- A. H. Lu and F. Schuth, Adv. Mater., 2006, 18, 1793–1805 CrossRef CAS.
- T. Nakamura, Y. Yamada and K. Yano, J. Mater. Chem., 2007, 17, 3726–3732 RSC.
- Y. Lei, J. Lu, X. Y. Luo, T. P. Wu, P. Du, X. Y. Zhang, Y. Ren, J. G. Wen, D. J. Miller, J. T. Miller, Y. K. Sun, J. W. Elam and K. Amine, Nano Lett., 2013, 13, 4182–4189 CrossRef CAS PubMed.
- J. Erlebacher, M. J. Aziz, A. Karma, N. Dimitrov and K. Sieradzki, Nature, 2001, 410, 450–453 CrossRef CAS PubMed.
- L. Zhang, X. Y. Lang, A. Hirata and M. W. Chen, ACS Nano, 2011, 5, 4407–4413 CrossRef CAS PubMed.
- R. Zeis, A. Mathur, G. Fritz, J. Lee and J. Erlebacher, J. Power Sources, 2007, 165, 65–72 CrossRef CAS.
- F. Meng and Y. Ding, Adv. Mater., 2011, 23, 4098–4102 CrossRef CAS PubMed.
- Y. G. Sun, J. Phys. Chem. C, 2010, 114, 2127–2133 CAS.
- V. L. K. Oura and A. Saranin, et al., Surface Science: An Introduction, Springer, 2010 Search PubMed.
- A. Dursun, D. V. Pugh and S. G. Corcoran, J. Electrochem. Soc., 2003, 150, B355–B360 CrossRef CAS.
- Z. Zhang, H. Li, F. Zhang, Y. Wu, Z. Guo, L. Zhou and J. Li, Langmuir, 2014, 30, 2648–2659 CrossRef CAS PubMed.
- J. Snyder and J. Erlebacher, J. Electrochem. Soc., 2010, 157, C125–C130 CrossRef CAS.
- Y. Bi and J. Ye, Chem. Commun., 2009, 6551–6553 RSC.
- M. Tominaga, T. Shimazoe, M. Nagashima, H. Kusuda, A. Kubo, Y. Kuwahara and I. Taniguchi, J. Electroanal. Chem., 2006, 590, 37–46 CrossRef CAS.
- D. A. J. Rand and R. Woods, J. Electroanal. Chem., 1972, 35, 209–218 CrossRef CAS.
- Z. Xing, Q. Chu, X. Ren, C. Ge, A. H. Qusti, A. M. Asiri, A. O. Al-Youbi and X. Sun, J. Power Sources, 2014, 245, 463–467 CrossRef CAS.
- S. W. Chou and J. Y. Lin, J. Electrochem. Soc., 2013, 160, D178–D182 CrossRef CAS.
- W. Zhou, X. Cao, Z. Zeng, W. Shi, Y. Zhu, Q. Yan, H. Liu, J. Wang and H. Zhang, Energy Environ. Sci., 2013, 6, 2216–2221 CAS.
Footnote |
| † Electronic supplementary information (ESI) available. See DOI: 10.1039/c7ra01862b |
| This journal is © The Royal Society of Chemistry 2017 |