
 Open Access Article
 This Open Access Article is licensed under a
 Creative Commons Attribution 3.0 Unported Licence
Synthesis and characterization of an IrO2–Fe2O3 electrocatalyst for the hydrogen evolution reaction in acidic water electrolysis†
Xian Yang,
Yande Li,
Li Deng,
Wenyang Li,
Zhandong Ren,
Ming Yang,
Xiaohong Yang and
Yuchan Zhu *
*
School of Chemical and Environmental Engineering, Wuhan Polytechnic University, Wuhan, 430023, P. R. China. E-mail: zhuyuchan@163.com
First published on 7th April 2017
Abstract
Water electrolysis is one of the most promising processes for a hydrogen-based economy, so the development of highly active, durable, and inexpensive catalysts for the hydrogen evolution reaction (HER) is very important. IrO2 is known to be one of the most active catalysts for the oxygen evolution reaction (OER) in a PEM electrolyzer, but the HER activity of IrO2 is rarely studied because of its low cathodic current compared to platinum. Herein, an IrO2–Fe2O3 composite oxide was prepared by a thermal decomposition method. The physical and electrochemical characterization of the material was achieved by scanning electron microscopy (SEM), X-ray fluorescence (XRF), X-ray diffraction (XRD), cyclic voltammetry (CV) and electrochemical impedance spectroscopy (EIS). Compared to that of IrO2, the CV curves of the IrO2–Fe2O3 electrode reveal that hydrogen is more easily adsorbed on the surface, which would lead to the H underpotential deposition (H-UPD) redox current increasing significantly. Therefore, the IrO2–Fe2O3 electrode exhibits higher HER activity than that of the IrO2 electrode in 0.5 M H2SO4 solution as shown by linear sweep voltammetry (LSV). It is attributed to the electronic structure modification of IrO2 and synergetic effect between Ir and Fe in the IrO2–Fe2O3 electrode. In addition, the Tafel slope of 36.2 mV dec−1 suggests that the mechanism for the IrO2–Fe2O3-catalyzed HER is Volmer–Heyrovsky.
Introduction
With increasing demands for clean and renewable energy and the development of a low carbon emission economy, hydrogen has attracted much attention as an ideal energy carrier.1–4 To date, extensive effort has been devoted to exploring advanced techniques for hydrogen production.5–10 Water electrolysis is the simplest electrochemical procedure for producing pure hydrogen and has been one of the most promising processes for a hydrogen-based economy. The development of highly active, durable, and inexpensive catalysts for the hydrogen evolution reaction (HER) is an attractive scientific and technological goal.11–17 A good catalyst for HER is required to be able to reduce the overpotential and consequently increase the reaction activity in terms of the exchange current density. To date, Pt and Pt-alloys have the highest activity for hydrogen evolution. But the high cost and rarity of Pt are big hurdles for practical application.18 Therefore, intensive effort has been applied to the investigation of non-platinum-metal alternatives such as Rh, Ru, Ir, Fe, Co or Ni as well as their alloys.19–39 Apart from pure metals or metal alloys, conductive metallic oxides, such as IrO2, RuO2, Co3O4 and NiO40–48 are also recognized to be good electrocatalysts for evolving hydrogen in acidic and alkaline solution without reducing to the metals.It is generally known that IrO2 is one of the most active catalysts for the oxygen evolution reaction (OER) in a PEM electrolyzer, exhibiting high electronic conductivity and stability in the electrochemical procedure. At the same time, IrO2 is also highlighted as the most promising cathodic electrocatalyst because of its strong corrosion-resistance. The apparent current density of IrO2 is in the order of 1.0 mA cm−2 and the Tafel slope is 40–50 mV per decade at low current densities.40,41,49 The HER current density is about one order of magnitude lower than that of platinum and iridium41 and needs to be further improved. The volcano plot, which associates the intrinsic kinetic rate of HER with the chemisorption energy of hydrogen on metallic surfaces, has shown that an optimal hydrogen binding energy should be not too strong and not too weak to achieve high HER activity.50 For example, the strong chemical bond of Ir–H would hinder hydrogen desorption and decrease the reaction rate of HER. To further improve the HER activity of IrO2, it is necessary to change its electronic structure to reduce the hydrogen binding energy, and thereby facilitate hydrogen desorption. Compared to iridium, iron exhibits a lower enthalpy of intermediate M–H adsorption for HER. Iron composites have been widely applied in catalysis, especially in electrochemical water splitting. Iron has semi-empty d-orbitals, which would be available to facilitate H desorption in the electrochemical desorption step.51 So, the addition of iron to IrO2 may improve its hydrogen evolution activity. In addition, the well-known “spillover” effect in heterogeneous catalysis would exist in the synergism between iridium and iron.
In this paper, an IrO2–Fe2O3 composite oxide was prepared by a thermal decomposition method. The structure of the IrO2–Fe2O3 composite oxide was characterized by scanning electron microscopy (SEM), X-ray fluorescence (XRF), X-ray diffraction (XRD) and electrochemical methods. Then, the electrochemical catalytic activity and mechanism towards the HER of the IrO2–Fe2O3 electrode was demonstrated in detail.
Results and discussion
The crystal structure of the IrO2–Fe2O3 composite oxide was characterized by X-ray diffraction studies (Fig. 1a). The IrO2–Fe2O3 composite oxide has a typical rutile phase crystal structure, in which the diffraction peaks at 28.1°and 34.9° correspond to the IrO2(110) and IrO2(101) crystal faces respectively, by comparison to the JCPDS 43-1019 standard card. The main peaks obtained at 40.1°, 54.0°, 69.4° and 73.2° belong to the rutile phase crystal structure of the (200), (211), (301) and (202) planes, respectively. As can be seen from Fig. 1a, the presence of an iron oxide crystalline phase was not observed in the whole range of 20–80° except in the diffraction peak of Fe2O3(113) located at 41.0°. This indicates that the Fe2O3 components have been fully incorporated into the IrO2 lattice, forming a solid-solution composite oxide. In addition, compared to the IrO2 standard card (the red line) in Fig. 1b, the diffraction peak position of the (101) crystal plane can be found to have a slight positive shift (0.24°), implying that the crystal lattice of IrO2 has been contracted. The lattice parameter of IrO2–Fe2O3 is found to be ∼0.4486 nm, which is smaller than that of pure IrO2 (0.4498 nm). The lattice shrinkage proves the formation of the IrO2–Fe2O3 solid solution, in which iron atoms enter the rutile structure of IrO2 or there is atomic substitution of some iridium atoms by smaller iron atoms. According to the Scherrer formula, the particle size of the IrO2–Fe2O3 composite oxide was calculated to be 7.86 nm by fitting the (110) reflection.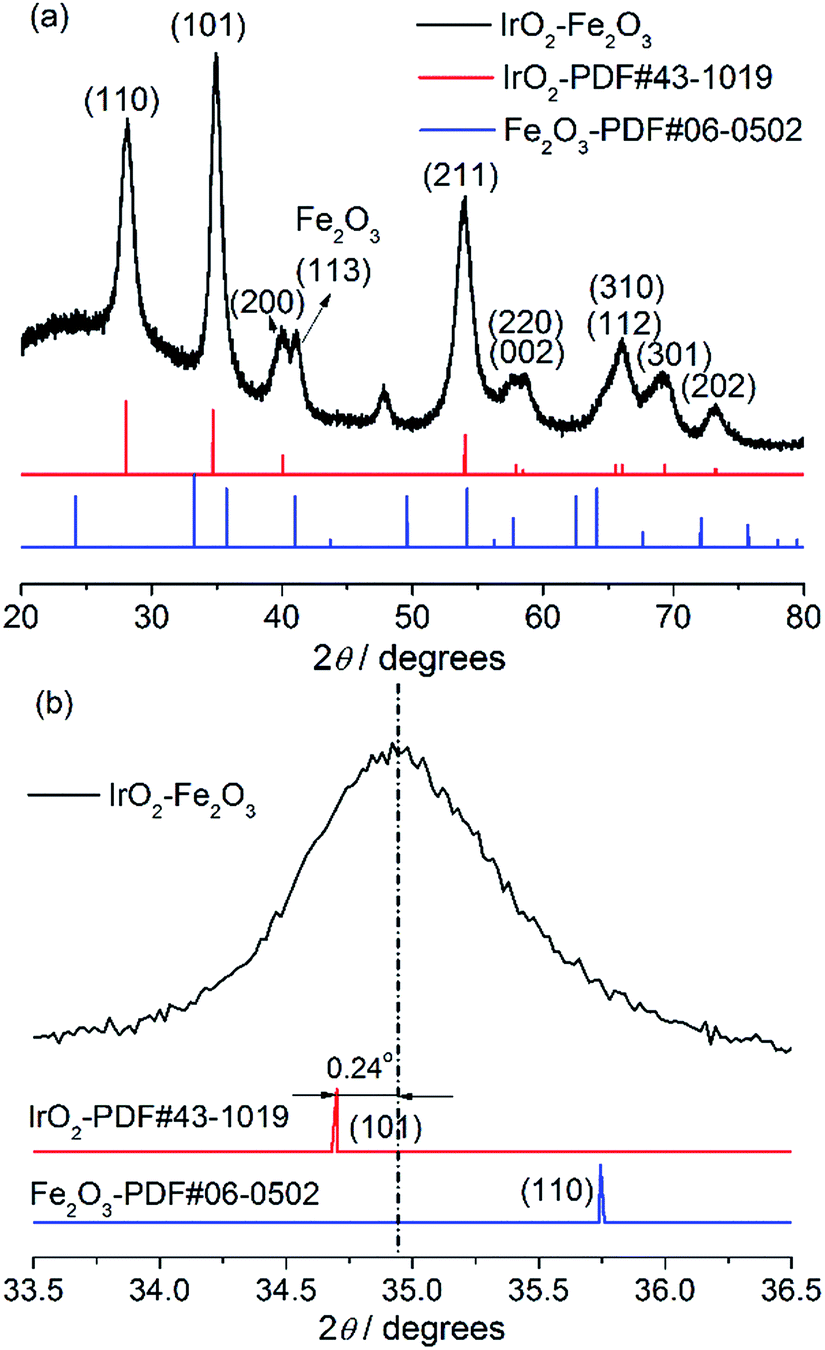 | ||
| Fig. 1 X-ray diffraction patterns of the IrO2–Fe2O3 composite oxide. | ||
Different degrees of agglomeration of the catalysts can been seen from the two SEM images in Fig. 2, which were caused by high temperature sintering during the process of preparation. In Fig. 2a, the IrO2 particles are irregular in shape and uneven in size. In many places there are obvious agglomerated particles with an average size of about 1 μm. In the green regions of the image, some small crystalline grains with sizes of about 300–500 nm can also be seen at the same time. However, this phenomenon of agglomeration has been improved in the IrO2–Fe2O3 composite oxide’s SEM image (Fig. 2b). The IrO2–Fe2O3 composite oxide particles present rough morphology and the size of the tiny particles in the red regions is about 100 nm. The improvement in dispersion uniformity and decrease in particle size will greatly increase the specific surface area of the electrocatalyst. The BET specific surface area of the IrO2–Fe2O3 composite oxide has reached 261.4 m2 g−1 (Fig. S1a†), which is larger than that of IrO2 (241.0 m2 g−1, see Fig. S1b†). This increase will be helpful to increase the probability of contact between the reactant and the catalyst.
 | ||
| Fig. 2 SEM images of IrO2 (a) and the IrO2–Fe2O3 composite oxide (b). | ||
X-ray fluorescence (XRF) was also carried out to confirm the Ir![[thin space (1/6-em)]](https://www.rsc.org/images/entities/char_2009.gif) :Fe molar ratio in the IrO2–Fe2O3 composite oxide, and the result turned out to be 88.39%:11.61% (Fig. S2 and Table S1†).
:Fe molar ratio in the IrO2–Fe2O3 composite oxide, and the result turned out to be 88.39%:11.61% (Fig. S2 and Table S1†).
Specific surface area is a physical property of a catalyst itself. However, in electrochemical experiments, estimation of electrochemically active surface area (ESA) is critical in assessing intrinsic catalytic activity. A popular method for obtaining the ESA is based on the integration of the voltammetric charge (q*) associated with the surface electrochemistry between hydrogen and oxygen evolutions obtained by cyclic voltammetry. So, cyclic voltammetry (CV) was used to characterize the ESA of the catalysts and is shown in Fig. 3. By integrating the CV curves, the q* of the IrO2–Fe2O3 composite oxide is 26.65 mC cm−2, which is 1.40 times that of pure IrO2 oxide (19.00 mC cm−2). The increase in surface electrochemical active sites would be conducive to the improvement of electrocatalytic activity.
 | ||
| Fig. 3 Cyclic voltammograms of IrO2–Fe2O3 (red line) and IrO2 (black line) electrodes with geometric surface areas (GSAs) in 0.5 mol L−1 H2SO4 solution at a sweeping rate of 100 mV s−1. | ||
As shown in Fig. 3, the CV of the IrO2 electrode accurately exhibits a rectangular mirror image and rapid reversals of the direction of the response current, which are typical electrochemical responses with pseudocapacitive behaviors. The voltammetric capacitance contains contributions from double layer capacitance and pseudo-capacitance, which depends on surface area. After Fe2O3 was doped with IrO2, the electrochemical behavior changed obviously. The redox current, compared to that of IrO2, increased significantly, especially in the region of hydrogen underpotential deposition (H-UPD, 0–0.3 V). The H-UPD reduction current of the IrO2–Fe2O3 electrode is 4.06 mA cm−2 @ 0 V, while the current of the IrO2 electrode is only 1.12 mA cm−2. The difference between the two catalysts is 3.56 times, which indicates that the IrO2–Fe2O3 electrode would have good hydrogen evolution activity. In addition, the two quasi-reversible peaks seen in the CV can be attributed to changes in the Ir valence states (Ir(II)/Ir(III) at about 0.59 V vs. RHE and Ir(III)/Ir(IV) at about 1.0 V vs. RHE) taking place on the surface of iridium dioxide during potential scanning.
LSV measurements were performed from −0.2 to 0.2 V vs. RHE to investigate the activity of the hydrogen evolution reaction (HER) after the 150-segment CV measurements due to the hysteresis phenomenon of IrO2. As displayed in Fig. S3,† the IrO2 electrode shows the most negative onset potential for an appreciable cathodic current density (η = 39 mV). The polarization recorded for the IrO2–Fe2O3 electrode revealed that the cathodic current rises rapidly beyond the zero overpotential. With an increase in polarization potential, the HER current is obviously enhanced and the i–V response of the IrO2–Fe2O3 electrode exhibits higher catalytic activity than that of the IrO2 electrode in Fig. 4. For instance, the overpotential at 10 mA cm−2 (using the geometric surface area, GSA) is 155 mV for the IrO2 electrode, while the overpotential for the IrO2–Fe2O3 electrode is only 78 mV. For comparison, the same measurement was carried out for Pt disk and Pt/C (Fig. 4 and S4†). The electrochemical area of Pt/C is much larger than that of IrO2–Fe2O3 (Fig. S5†) and has an excellent HER activity. But, comparison of IrO2–Fe2O3 and Pt disk under the similar electrochemical area shows that the HER activities are close, which indicates that the IrO2–Fe2O3 electrode is a good electrocatalytic material.
 | ||
| Fig. 4 Linear sweep voltammetry curves of IrO2–Fe2O3 (red line), IrO2 (black line) and Pt disk (green line) electrodes with geometric surface areas (GSAs) in 0.5 mol L−1 H2SO4 solution at a sweeping rate of 5 mV s−1. The inset shows the current in terms of the unit surface charge. | ||
The superior HER activity of the IrO2–Fe2O3 electrode could be attributed to two aspects including geometric and electronic effects. On the one hand, HER is essentially a surface reaction, so an increase in ESA would bring the enhancement in electrocatalytic activity. In addition, the high calcination temperature in the preparation of oxide electrodes has generated larger particle and agglomerate sizes, which intensify the bubble effect (hydrogen bubbles grow and stick on the surface) and result in higher overpotentials. Hence, the performance of electrodes has usually been improved by increasing the ratio between the real and geometric surface area of an electrode. On the other hand, it may be the change in the electronic structure of IrO2. In the HER mechanism, the strength of the H2O–M and H–M interactions appears to be very important. The H2O–M interaction should be strong enough to favor the splitting of the water molecule, conversely, the M–H interaction should not be too strong so as to hinder hydrogen desorption. According to the volcano plot, the hydrogen binding energy of iridium is strong enough, while that of iron is weak. So, the addition of iron would decrease the binding energy and improve the activity of hydrogen evolution.
To understand which is the more important one of the two reasons mentioned above, it is necessary to exclude the effect of ESA on the HER activity. Therefore, the apparent activity of the IrO2–Fe2O3 and IrO2 electrodes should be normalized with respect to the unit of surface charge. As shown in the inset of Fig. 4, the IrO2–Fe2O3 electrode also exhibited a high current density of 1.87 A C−1 at −0.2 V, which is 2.05 times higher than that for the IrO2 electrode (0.91 A C−1). Thus, we identified that the IrO2–Fe2O3 electrode is truly more active than the IrO2 electrode and rationalized that the enhancement is principally due to the boost in the intrinsic activity of IrO2–Fe2O3. As the IrO2–Fe2O3 solid-solution formed, the shrinking crystal lattice (demonstrated by the XRD studies) may lower the hydrogen binding energy to a relatively moderate binding strength, which favors the desorption of Hads atoms on the surface. On the other hand, the well-known “spillover” process would appear due to the synergism between iridium and iron. In the cooperative interaction, Ir sites facilitate electron transfer to the water molecule and subsequent cleavage of the O–H bond, and adjacent Fe sites facilitate the H desorption in the next step.
To study the kinetics of the HER process, the Tafel analysis was carried out on the polarization curve of the IrO2–Fe2O3 electrode (Fig. 5). The Tafel slope was calculated from the linear portion of the plot in the low overpotential region. The Tafel slope is an intensive quantity, and it does not depend on the surface area of electrode. The Tafel slope of the IrO2–Fe2O3 electrode is only 36.2 mV dec−1, which is lower than that of the IrO2 electrode (42.9 mV dec−1). In acidic solutions, the mechanism of HER mainly involves three reactions. The common first step is the Volmer reaction, where water dissociates and an adsorbed hydrogen (Had) is formed, which is followed by either the Tafel reaction (combination reaction) or the Heyrovsky reaction (electrochemical desorption) to give H2. Assuming a small surface coverage of hydrogen, a fast discharge reaction followed by a rate-determining combination reaction results in a theoretical Tafel slope of 29 mV dec−1 at 25 °C. If the electrochemical desorption step is the rate-determining step, the Tafel slope is 38 mV dec−1 at 25 °C. If the Volmer step is rate determining or the surface coverage is close to one, the Tafel slope should be 116 mV dec−1. Thus, the diagnostic criteria for the HER on IrO2–Fe2O3 clearly demonstrate a Volmer–Heyrovsky mechanism, i.e., the rate-controlling step is the electrochemical desorption of Hads and H3O+ to form H2. So the contraction of the crystal lattice of IrO2–Fe2O3 has enhanced the desorption of Hads atoms and accelerated the rate of the HER. In addition, the exchange current density (j0) is further calculated by extrapolating the Tafel plot, which is the most inherent measure of HER activity. As expected, the j0 value (0.27 mA cm−2) for the IrO2–Fe2O3 electrode is higher than that of the IrO2 electrode (0.05 mA cm−2).
 | ||
| Fig. 5 Tafel plot curves of IrO2–Fe2O3 (red line) and IrO2 (black line) electrodes in 0.5 mol L−1 H2SO4 solution. | ||
Electrochemical Impedance Spectroscopy (EIS) is a powerful, nondestructive and informative technique used extensively to study electrolyte–electrode interfacial properties. Fig. 6 shows the Nyquist diagrams of the catalysts recorded at the overpotential of 50 mV vs. RHE. The equivalent circuit corresponding to the EIS data of the IrO2–Fe2O3 electrode was fitted to a one time-constant model (the equivalent circuit Rs(RctCdl) shown in Fig. S6†). The values of the electrolyte solution resistance (Rs), the charge transfer resistance (Rct) and constant phase element (Cdl) are listed in Table S2.† The low frequency semicircle is ascribed to the charge transfer process, while the high frequency semicircle could be associated to the mass transfer processes of the adsorbed species at the cathode. The charge transfer resistance (Rct) data is obtained in the low frequency zone, which is related to the electrocatalytic kinetics. The Rct of IrO2–Fe2O3 is 232.7 Ω, which is much lower than IrO2 (693.2 Ω), suggesting a fast charge transport during the HER process. The higher Cdl values observed in the case of the IrO2–Fe2O3 electrode indicate that the active surface area has been increased compared to the IrO2 electrode.
 | ||
| Fig. 6 Complex plane plots of impedance of the IrO2–Fe2O3 (red line) and IrO2 (black line) electrodes in 0.5 mol L−1 H2SO4 solutions at the overpotential of 50 mV vs. RHE. | ||
In addition, accelerated CV tests were conducted to investigate the stability of the catalysts in the potential range −0.2 to 0.2 V at a sweeping rate of 50 mV s−1. As shown in Fig. 7, it is obvious that the HER activities of the IrO2–Fe2O3 and IrO2 electrodes were both not significantly decreased after 600 cycles of cyclic voltammetry measurements. The composition of the IrO2–Fe2O3 electrode did not significantly change, as the molar ratio of Ir:Fe remained 89.62%:10.38% (Table S1†). This suggests that the IrO2–Fe2O3 electrode is durable for hydrogen evolution and the active sites were not destroyed for a long time in electrocatalysis reactions.
 | ||
| Fig. 7 Long-term HER stability tests for IrO2–Fe2O3 (red line) and IrO2 (black line) electrodes in 0.5 mol L−1 H2SO4. | ||
As everyone knows, IrO2 is one of the most active catalysts for the oxygen evolution reaction (OER). As can be seen from Fig. S7,† the OER activity of IrO2–Fe2O3 is slightly higher than that of IrO2. So, it can be used as a bifunctional catalyst for water electrolysis.
Conclusions
In the present work, an IrO2–Fe2O3 composite oxide was prepared by a thermal decomposition method, and the electrochemical behavior and the catalytic activity of the IrO2–Fe2O3 electrode towards HER were demonstrated in detail. When the IrO2–Fe2O3 solid-solution formed, the shrinking crystal lattice modified the hydrogen binding energy to a relatively moderate binding strength, which favors the desorption of Hads atoms on the surface. On the other hand, the well-known “spillover” process would appear due to the synergism between iridium and iron. Ir sites facilitate electron transfer to water molecules and subsequent cleavage of O–H bonds, and adjacent Fe sites facilitate H desorption in the next step. In comparison to the IrO2 electrode, the IrO2–Fe2O3 electrode exhibits a higher catalytic activity toward the HER, close to that of the Pt electrode. The Tafel slope suggests that the mechanism for the IrO2–Fe2O3-catalyzed HER is Volmer–Heyrovsky, where the electrochemical desorption of hydrogen is the rate-limiting step. In addition, IrO2–Fe2O3 also showed good activity for OER. Therefore, it can be used as a bifunctional catalyst for water electrolysis.Experimental
Materials
Chloroiridic acid (H2IrCl6·6H2O, Ir% > 35 wt%), ferric trichloride (FeCl3, AR), ethanol (CH3CH2OH, AR) and sulphuric acid (H2SO4, AR) were purchased from Sinopharm Chemical Reagent Co., Ltd, Shanghai, China. All reagents were analytical grade and used without further purification. All gases (argon and hydrogen) (99.999%) were purchased from Ming-Hui company. Vulcan XC-72 (Carbot), Nafion solution (5 wt%, DuPont D520) and Pt/C (60 wt%, Johnson Matthey) were used as received.Electrode preparation
H2IrCl6·6H2O (0.824 g) and FeCl3 (0.065 g) were added to 10 mL ethanol. The mixture was stirred with a magnetic stirrer at 50 °C for 6 h to form a homogeneous mixture. Then the ethanol was evaporated and the mixed precipitate was filtered, washed thoroughly with deionized water and dried at 80 °C. After drying for 4 h, the resulting powder was then introduced into a tube furnace and calcinated at 550 °C for 1 h in air to get the IrO2–Fe2O3 composite oxide. The IrO2–Fe2O3 composite oxide and XC-72 powder were mixed with a mass ratio of 1:1. After adding a small amount of ethanol, the mixture was fully ground and dispersed in an agate mortar under infrared light. Catalyst inks were prepared by mixing 5 mg IrO2–Fe2O3 composite oxide/XC-72 with 1 mL of 0.05 wt% Nafion solution. The solution was ultrasonicated until a dark, uniform ink was achieved. The working electrodes were prepared by placing 10 μL suspension onto a flat glassy carbon electrode (5 mm diameter, GaossUnion) and dried at room temperature. The loading amount of IrO2–Fe2O3 was 0.125 mg cm−2.
Material characterization
X-ray diffraction (XRD) was used to analyze the structure of the electrode materials. The inspection was carried out at room temperature on a XRD-7000 X-ray diffractometer (Shimadzu, Japan), using Cu Kα radiation (λ = 0.15405 nm) operating at 40 kV and 30 mA. The analysis of the composition was carried out by X-ray fluorescence (XRF: EDX-7000, Shimadzu, Japan). The surface morphology was characterized by scanning electron microscopy (SEM: S-3000N, Hitachi Co., Japan).Electrochemical measurements
The electrochemical experiments were carried out by a CHI 660 D electrochemical analyzer at 30 °C. All the electrochemical measurements were carried out in a typical three-electrode electrochemical glass cell. Carbon paper (TGP-H-090, Toray) was used as the counter electrode, the reversible hydrogen electrode (RHE) as the reference, and an IrO2–Fe2O3 electrode (IrO2 or Pt-disk) as the working electrode. Cyclic voltammetry (CV) measurements were performed from 0 to 1.4 V in 0.5 mol L−1 H2SO4 solutions at a scan rate of 100 mV s−1. Linear sweep voltammetry (LSV) was used as a systematic and effective method to investigate the electrochemical activity of the electrocatalysts. After obtaining a stable cycle between 0 and 1.4 V with 150 segments, the HER polarization curves were obtained by sweeping the potential from −0.2 to 0.2 V (vs. RHE) at a scan rate of 5 mV s−1 in Ar-saturated 0.5 mol L−1 H2SO4. The durability tests were carried out by repeating the potential scan from −0.2 to 0.2 V (vs. RHE) with 600 cycles in Ar-saturated 0.5 mol L−1 H2SO4 solution. Electrochemical impedance spectroscopy was performed with the working electrode biased at a constant of −0.05 V vs. RHE with the frequency ranging from 100 kHz to 0.1 Hz with an amplitude of 10 mV.Acknowledgements
The authors would like to acknowledge financial support from The National Natural Science Foundation of China (31101370) and Research and Innovation Initiatives of WHPU(2015d8).Notes and references
- R. G. Ma, Y. Zhou, Y. F. Chen, P. X. Li, Q. Liu and J. C. Wang, Angew. Chem., Int. Ed., 2015, 54, 14723–14727 CrossRef CAS PubMed.
- X. Zhao, X. Ma, J. Sun, D. H. Li and X. R. Yang, ACS Nano, 2016, 10, 2159–2166 CrossRef CAS PubMed.
- Z. F. Huang, J. J. Song, K. Li, M. Tahir, Y. T. Wang, L. Pan, L. Wang, X. W. Zhang and J. J. Zou, J. Am. Chem. Soc., 2016, 138, 1359–1365 CrossRef CAS PubMed.
- C. G. Morales-Guio, L.-A. Stern and X. L. Hu, Chem. Soc. Rev., 2014, 43, 6555–6569 RSC.
- J. R. McKone, S. C. Marinescu, B. S. Brunschwig, J. R. Winkler and H. B. Gray, Chem. Sci., 2014, 5, 865–878 RSC.
- T. F. Jaramillo, K. P. Jorgensen, J. Bonde, J. H. Nielsen, S. Horch and I. Chorkendorff, Science, 2007, 317, 100–102 CrossRef CAS PubMed.
- Z. J. Huang, W. J. Luo, L. Ma, M. Z. Yu, X. D. Ren, M. F. He, S. Polen, K. Click, B. Garrett, J. Lu, K. Amine, C. Hadad, W. L. Chen, A. Asthagiri and Y. Y. Wu, Angew. Chem., Int. Ed., 2015, 54, 15181–15185 CrossRef CAS PubMed.
- J. Staszak-Jirkovský, C. D. Malliakas, P. P. Lopes, N. Danilovic, S. S. Kota, K.-C. Chang, B. Genorio, D. Strmcnik, V. R. Stamenkovic, M. G. Kanatzidis and N. M. Markovic, Nat. Mater., 2016, 15, 197–204 CrossRef PubMed.
- M. Crespo-Quesada, L. M. Pazos-Outón, J. Warnan, M. F. Kuehnel, R. H. Friend and E. Reisner, Nat. Commun., 2016, 7, 12555 CrossRef CAS PubMed.
- Z. J. Sun, H. F. Zheng, J. S. Li and P. W. Du, Energy Environ. Sci., 2015, 8, 2668–2676 CAS.
- D. Voiry, H. Yamaguchi, J. Li, R. Silva, D. C. B. Alves, T. Fujita, M. Chen, T. Asefa, V. B. Shenoy, G. Eda and M. Chhowalla, Nat. Mater., 2013, 12, 850–855 CrossRef CAS PubMed.
- Z. Y. Zeng, C. L. Tan, X. Huang, S. Y. Bao and H. Zhang, Energy Environ. Sci., 2014, 7, 797–803 CAS.
- Y. C. Zhu, M. Yuan, L. Deng, R. X. Ming, A. L. Zhang, M. Yang, B. Chai and Z. D. Ren, RSC Adv., 2017, 7, 1553–1560 RSC.
- X. M. Geng, W. W. Sun, W. Wu, B. Chen, A. Al-Hilo, M. Benamara, H. L. Zhu, F. Watanabe, J. B. Cui and T. Chen, Nat. Commun., 2016, 7, 10672 CrossRef CAS PubMed.
- R. Subbaraman, D. Tripkovic, D. Strmcnik, K. Chang, M. Uchimura, A. P. Paulikas, V. Stamenkovic and N. M. Markovic, Science, 2011, 334, 1256–1260 CrossRef CAS PubMed.
- R. Subbaraman, D. Tripkovic, K.-C. Chang, D. Strmcnik, A. P. Paulikas, P. Hirunsit, M. Chan, J. Greeley, V. Stamenkovic and N. M. Markovic, Nat. Chem., 2012, 11, 550–557 CAS.
- Z. X. Fan, Z. M. Luo, X. Huang, B. Li, Y. Chen, J. Wang, Y. L. Hu and H. Zhang, J. Am. Chem. Soc., 2016, 138, 1414–1419 CrossRef CAS PubMed.
- Y. Zheng, Y. Jiao, M. Jaroniec and S. Z. Qiao, Angew. Chem., Int. Ed., 2015, 54, 52–65 CrossRef CAS PubMed.
- L. L. Zhu, H. P. Lin, Y. Y. Li, F. Liao, Y. Lifshitz, M. Q. Sheng, S.-T. Lee and M. W. Shao, Nat. Commun., 2016, 7, 12272 CrossRef CAS PubMed.
- B. B. Jiang, Y. Y. Sun, F. Liao, W. Shen, H. P. Lin, H. Wang and M. W. Shao, J. Mater. Chem. A, 2017, 5, 1623–1628 CAS.
- L. L. Zhu, Q. Cai, F. Liao, M. Q. Sheng, B. Wu and M. W. Shao, Electrochem. Commun., 2015, 52, 29–33 CrossRef CAS.
- R. Palaniappan and G. G. Botte, J. Phys. Chem. C, 2013, 117, 17429–17441 CAS.
- E. A. Franceschini, G. I. Lacconi and H. R. Corti, Int. J. Hydrogen Energy, 2016, 41, 3326–3338 CrossRef CAS.
- J. Zheng, Z. B. Zhuang, B. J. Xu and Y. S. Yan, ACS Catal., 2015, 5, 4449–4455 CrossRef CAS.
- K. A. Kuttiyiel, K. Sasaki, W. F. Chen, D. Su and R. R. Adzic, J. Mater. Chem. A, 2014, 2, 591–594 CAS.
- M. Tavakkoli, T. Kallio, O. Reynaud, A. G. Nasibulin, C. Johans, J. Sainio, H. Jiang, E. I. Kauppinen and K. Laasonen, Angew. Chem., Int. Ed., 2015, 54, 4535–4538 CrossRef CAS PubMed.
- J. Deng, P. J. Ren, D. H. Deng, L. Yu, F. Yang and X. H. Bao, Energy Environ. Sci., 2014, 7, 1919–1923 CAS.
- C. I. Müller, K. Sellschopp, M. Tegel, T. Rauscher, B. Kieback and L. Röntzsch, J. Power Sources, 2016, 304, 196–206 CrossRef.
- F. I. Danilov, A. V. Tsurkan, E. A. Vasil’eva and V. S. Protsenko, Int. J. Hydrogen Energy, 2016, 41, 7363–7372 CrossRef CAS.
- Z. L. Wang, X. F. Hao, Z. Jiang, X. P. Sun, D. Xu, J. Wang, H. X. Zhong, F. L. Meng and X. B. Zhang, J. Am. Chem. Soc., 2015, 137, 15070–15073 CrossRef CAS PubMed.
- Y. Wang, Y. Nie, W. Ding, S. G. Chen, K. Xiong, X. Q. Qi, Y. Zhang, J. Wang and Z. D. Wei, Chem. Commun., 2015, 51, 8942–8945 RSC.
- M. Cabán-Acevedo, M. L. Stone, J. R. Schmidt, J. G. Thomas, Q. Ding, H.-C. Chang, M.-L. Tsai, J.-H. He and S. Jin, Nat. Mater., 2015, 14, 1245–1251 CrossRef PubMed.
- Z. L. Wang, X. F. Hao, Z. Jiang, X. P. Sun, D. Xu, J. Wang, H. X. Zhong, F. L. Meng and X. B. Zhang, J. Am. Chem. Soc., 2015, 137, 15070–15073 CrossRef CAS PubMed.
- J. Yin, Q. H. Fan, Y. X. Li, F. Y. Cheng, P. P. Zhou, P. X. Xi and S. H. Sun, J. Am. Chem. Soc., 2016, 138, 14546–14549 CrossRef CAS PubMed.
- X. Li, P. F. Liu, L. Zhang, M. Y. Zu, Y. X. Yang and H. G. Yang, Chem. Commun., 2016, 52, 10566–10569 RSC.
- L. L. Fan, P. F. Liu, X. C. Yan, L. Gu, Z. Z. Yang, H. G. Yang, S. L. Qiu and X. D. Yao, Nat. Commun., 2016, 7, 10667 CrossRef CAS PubMed.
- Y. Kuang, G. Feng, P. S. Li, Y. M. Bi, Y. P. Li and X. M. Sun, Angew. Chem., Int. Ed., 2016, 55, 693–697 CrossRef CAS PubMed.
- H. J. Qiu, Y. Ito, W. T. Cong, Y. W. Tan, P. Liu, A. Hirata, T. Fujita, Z. Tang and M. W. Chen, Angew. Chem., Int. Ed., 2015, 54, 14031–14035 CrossRef CAS PubMed.
- X. Long, G. X. Li, Z. L. Wang, H. Y. Zhu, T. Zhang, S. Xiao, W. Y. Guo and S. H. Yang, J. Am. Chem. Soc., 2015, 137, 11900–11903 CrossRef CAS PubMed.
- J. Ahmed and Y. B. Mao, Electrochim. Acta, 2016, 212, 686–693 CrossRef CAS.
- S. Cherevko, S. Geiger, O. Kasian, N. Kulyk, J.-P. Grote, A. Savan, B. R. Shrestha, S. Merzlikin, B. Breitbach, A. Ludwig and K. J. J. Mayrhofer, Catal. Today, 2016, 262, 170–180 CrossRef CAS.
- E. Oakton, D. Lebedev, A. Fedorov, F. Krumeich, J. Tillier, O. Sereda, T. J. Schmidtac and C. Copéret, New J. Chem., 2016, 40, 1834–1838 RSC.
- L.-Å. Näslund, A. S. Ingason, S. Holmin and J. Rosen, J. Phys. Chem. C, 2014, 118, 15315–15323 Search PubMed.
- T. Bhowmik, M. K. Kundu and S. Barman, ACS Appl. Mater. Interfaces, 2016, 8, 28678–28688 CAS.
- U. Č. Lačnjevac, V. V. Radmilović, V. R. Radmilović and N. V. Krstajić, Electrochim. Acta, 2015, 168, 178–190 CrossRef.
- X. D. Yan, L. H. Tian, M. He and X. B. Chen, Nano Lett., 2015, 15, 6015–6021 CrossRef CAS PubMed.
- M. K. Bates, Q. Y. Jia, N. Ramaswamy, R. J. Allen and S. Mukerje, J. Phys. Chem. C, 2015, 119, 5467–5477 CAS.
- X. D. Yan, L. H. Tian and X. B. Chen, J. Power Sources, 2015, 300, 336–343 CrossRef CAS.
- J. B. Cheng, H. M. Zhang, H. P. Ma, H. X. Zhong and Y. Zou, Electrochim. Acta, 2010, 55, 1855–1861 CrossRef CAS.
- W. C. Sheng, M. Myint, J. G. Chen and Y. S. Yan, Energy Environ. Sci., 2013, 6, 1509–1512 CAS.
- F. Rosalbino, G. Scavino and M. A. Grande, J. Electroanal. Chem., 2013, 694, 114–121 CrossRef CAS.
Footnote |
| † Electronic supplementary information (ESI) available. See DOI: 10.1039/c7ra01533j |
| This journal is © The Royal Society of Chemistry 2017 |