 Open Access Article
Strontium ranelate-loaded PLGA porous microspheres enhancing the osteogenesis of MC3T3-E1 cells
Zhenyang Mao†
a,
Zhiwei Fang†b,
Yunqi Yangb,
Xuan Chenb,
Yugang Wanga,
Jian Kangb,
Xinhua Qu *a,
Weien Yuan*b and
Kerong Dai*a
aShanghai Key Laboratory of Orthopedic Implants, Department of Orthopedic Surgery, Shanghai Ninth People's Hospital, Shanghai Jiao Tong University School of Medicine, 639 Zhizaoju Road, Shanghai 200011, China. E-mail: krdai@163.com; xinhua_qu@126.com
bSchool of Pharmacy, Shanghai Jiao Tong University, 800 Dongchuan Road, Shanghai, China. E-mail: yuanweien@126.com
First published on 5th May 2017
Abstract
Biodegradable poly lactic-co-glycolic acid (PLGA) has been used as a tissue engineering scaffold as well as a carrier for the delivery of proteins, drugs, and other macromolecules. Hydroxyapatite (HA) nanoparticle self-assembly on the surface of a PLGA microsphere can create a hydrophilic environment, and its hydroxide can neutralize the acidity of PLGA degradation products. These microspheres can be used to deliver strontium ranelate (SR), which is used to treat osteoporosis. In the present study, we fabricated porous PLGA microspheres (PM), SR-loaded (SR-)PM, and SR-PM with HA nanosuspension and polyvinyl alcohol (PVA) as a surfactant (SR-PM-HA) in a S/O/Ns method. The microspheres exhibited an interconnected porous structure. The percent cumulative release of SR from SR-PM was 90% in 22 days as compared to 85% from SR-PM-HA. In both cases, drug release was gradual (with no burst release). SR-PM and SR-PM-HA similarly stimulated the proliferation of MC3T3-E1 cells to a greater degree than PM and induced osteogenic differentiation, as determined by alkaline phosphatase staining and real-time PCR analysis of osteogenic marker gene expression. These results indicate that SR-PM-HA is biocompatible and suitable for drug delivery and osteoinduction.
1 Introduction
Biodegradable polymers have potential applications in medicine for drug delivery and as biomaterials for implants. One example is poly lactic-co-glycolic acid (PLGA), which has been used as a tissue engineering scaffold1,2 as well as a carrier for the delivery of proteins, drugs, and other macromolecules.3–6 PLGA is strong and biocompatible, making it potentially suitable for bone repair. However, it also has limitations such as poor hydrophilicity that could impact cell attachment, proliferation, and differentiation as well as drug release. Moreover, most PLGA degradation products are acidic and may elicit an inflammatory response and inhibit osteoblast activity in bone repair.7–9Nanostructured materials and porous spheres have potential applications for drug delivery, healthcare, and biomedical and pharmaceutical industries.10–20 Many physical and chemical methods have been developed to synthesize nanoparticles or porous spheres.10,16 Compounds of various sizes have been used as nanostructured materials and porous spheres for drug delivery and bioregulation in diverse systems for a specific purpose or disease.10,16 Liposomes, polymer micelles/microspheres, dendrimers, nanocapsules, and metal nanoparticles have been used as vehicles for drug delivery and bioregulation.21–23
Nano- or micro-scale hydroxyapatite (HA) particles measure in the order of hundreds of nanometers in length and have been widely used in bone reconstruction. In contrast to plate-shaped bone apatite, HA particles are rod-shaped and appear as enamel. Nano-sized apatite particles of 20–40 nm can serve as building blocks of bone by self-assembly in a collagen matrix to produce a biomaterial that is flexible, insensitive to dissolution/growth, and possesses mechanical strength.24 In addition, HA nanoparticle self-assembly on the surface of PLGA can create a hydrophilic environment that allows cell attachment to microspheres, which can in theory promote drug release. Furthermore, HA is a hydroxide that can neutralize the acidity of PLGA degradation products, thereby improving osteoclast function.
Microspheres have been prepared by various methods, including water-in-oil-in-water (W/O/W),25–29 water-in-oil-in-oil (W/O/O),30 oil-in-water (O/W),31 water-in-oil (W/O),32 solid-in-oil-in-water,33,34 solid-in-oil-in-oil,35 solid-in-oil-in-oil-in-water,36,37 and water-in-oil-in-oil-in-water38 emulsion. In addition, many techniques for generating porous microspheres have been developed.38–44 However, none of these approaches adequately counter the surface hydrophobicity that causes poor biocompatibility of PLGA or the acidity of its degradation products, which diminishes drug release and efficacy.
To address this issue, we developed a novel method for preparing microspheres, solid-in-oil-in-nanosuspension (S/O/Ns), using polyvinyl alcohol (PVA) and a HA nanosuspension as surfactants. The resultant nanoparticles were used as a carrier for strontium ranelate (SR), a drug used to treat osteoporosis that acts by reducing bone resorption and increasing new bone deposition by osteoblasts. We found that drug-loaded HA-PLGA microspheres provided sustained release of SR and enhanced osteogenesis in MC3T3-E1 cells.
2 Experimental
2.1 Preparation of microspheres
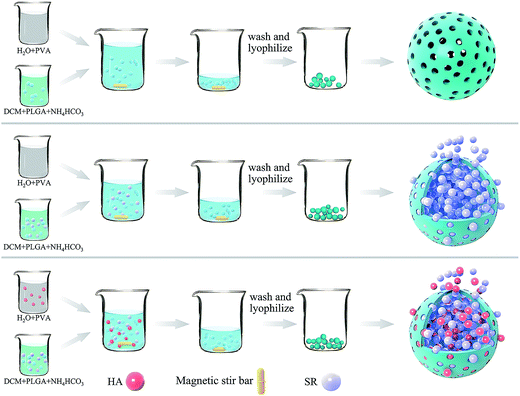
The synthesis of microspheres is illustrated in Fig. 1.![[thin space (1/6-em)]](https://www.rsc.org/images/entities/char_2009.gif) :
:![[thin space (1/6-em)]](https://www.rsc.org/images/entities/char_2009.gif) 35, molecular weight 20 kDa) was obtained from Lakeshore Biomaterials (Darmstadt, Germany). PVA (87–89% hydrolyzed, MW 31
35, molecular weight 20 kDa) was obtained from Lakeshore Biomaterials (Darmstadt, Germany). PVA (87–89% hydrolyzed, MW 31![[thin space (1/6-em)]](https://www.rsc.org/images/entities/char_2009.gif) 000–50
000–50![[thin space (1/6-em)]](https://www.rsc.org/images/entities/char_2009.gif) 000), HA nanoparticles, and SR were purchased from Sigma-Aldrich (St. Louis, MO, USA). Dichloromethane and other reagents were of analytical grade.
000), HA nanoparticles, and SR were purchased from Sigma-Aldrich (St. Louis, MO, USA). Dichloromethane and other reagents were of analytical grade.2.2 Characterization
![[thin space (1/6-em)]](https://www.rsc.org/images/entities/char_2009.gif) 000 rpm in order to remove the PLGA. After re-dissolving in 3 ml phosphate-buffered saline (PBS, pH 7.4) followed by centrifugation for 5 min at 12
000 rpm in order to remove the PLGA. After re-dissolving in 3 ml phosphate-buffered saline (PBS, pH 7.4) followed by centrifugation for 5 min at 12![[thin space (1/6-em)]](https://www.rsc.org/images/entities/char_2009.gif) 000 rpm, the SR content in the supernatant was analyzed by high-performance liquid chromatography (HPLC). The efficiency of SR encapsulation in the microspheres was calculated using the following equation:
000 rpm, the SR content in the supernatant was analyzed by high-performance liquid chromatography (HPLC). The efficiency of SR encapsulation in the microspheres was calculated using the following equation:| Encapsulation efficiency (%) = P/Pt × 100 |
SR release was measured by reversed-phase (RP-)HPLC at room temperature. A Diamonsil C18 column (250 × 4.6 mm, 5 μm) was used as the stationary phase, whereas the mobile phase consisted of 0.2% acetic acid buffer (pH = 5.5, adjusted with triethylamine):methanol(95![[thin space (1/6-em)]](https://www.rsc.org/images/entities/char_2009.gif) :
:![[thin space (1/6-em)]](https://www.rsc.org/images/entities/char_2009.gif) 5). The eluent was monitored with an ultraviolet detector (234 nm) at a flow rate of 1. The linear response was above the concentration range of 10–200 μg ml−1. The limits of detection and quantification were 20.0 and 50.0 ng, respectively.
5). The eluent was monitored with an ultraviolet detector (234 nm) at a flow rate of 1. The linear response was above the concentration range of 10–200 μg ml−1. The limits of detection and quantification were 20.0 and 50.0 ng, respectively.
2.3 Evaluation of MC3T3-E1 cell proliferation
MC3T3-E1 cells were purchased from the Cell Bank of the Chinese Academy of Sciences (Shanghai, China). MC3T3-E1 cells were cultured in α-Minimal Essential Medium (α-MEM; Gibco, Grand Island, NY, USA) supplemented with 100 mg ml−1 streptomycin, 100 U ml−1 penicillin, and 10% fetal bovine serum (all from Hyclone, Logan, UT, USA)at 37 °C in a humidified atmosphere of 5% CO2, with the medium changed every 3 days.The effects of PM, SR-PM, and SR-PM-HA on cell proliferation were evaluated with Cell Counting Kit (CCK)-8 (Dojindo Laboratories, Kumamoto, Japan) according to the manufacturer's instructions. Cells were seeded at a density of 3 × 10³ per well in 96-well plates with each sample prepared in triplicate, and treated with the microspheres at a concentration of 5 mg ml−1 24 h later. CCK-8 reagent (10 μl) was added to each well and the plates were incubated for 2 h at 37 °C. The optical density was measured with an ELX800 microplate reader (Bio-Tek, Winooski, VT, USA) at a wavelength of 450 nm (650 nm for the reference).
2.4 Osteogenic differentiation of MC3T3-E1 cells
MC3T3-E1 cells (5 × 10⁵ per ml) were cultured with PM, SR-PM, or SR-PM-HA (5 mg ml−1) in a 12-well plate. The medium was changed every 3 days. After culturing in α-MEM for 3 days, the medium was replaced with osteogenic medium composed of α-MEM supplemented with 50 mM L-ascorbic acid, 10−8 M dexamethasone, and 10 mM β-glycerophosphate (all from Sigma-Aldrich). At predetermined time points, cells were collected by digestion with trypsin and transferred to a 24-well plate.Alkaline phosphatase (ALP) staining was carried out using a kit (Rainbow, Shanghai, China) according to the manufacturer's instructions. The expression of osteogenic differentiation marker genes such as ALP, runt-related transcription factor 2 (Runx-2), osteocalcin (OCN), and collagen type I (Col I) was assessed by real-time (RT-) PCR. RNA was extracted using TRIzol reagent (Invitrogen, Carlsbad, CA, USA) and cDNA was synthesized with the OmniScript Reverse Transcription kit (Qiagen, Valencia, CA, USA). SYBR Green (Bio-Rad, Hercules, CA, USA) was used along with the Gene Amp 2400 system (Perkin-Elmer, Waltham, MA, USA) for PCR amplification.45
2.5 Statistical analysis
Data were analyzed using SPSS v.19.0 software (SPSS Inc., Chicago, IL, USA). Continuous variables are expressed as mean ± SD. Between-group differences in demographic and clinical variables were evaluated by one-way analysis of variance, with the least significant difference and Dunnett's post-hoc tests used for variables with homogeneous and heterogeneous variances, respectively. A P value < 0.05 was considered statistically significant.3 Results and discussion
3.1 Morphology and composition of microspheres
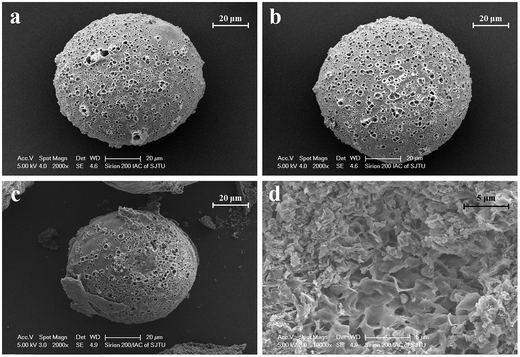
PLGA is biocompatible and biodegradable, applying in medicine for drug delivery and as biomaterials. However, poor hydrophilicity and acidic degradation products of PLGA limit its application.7–9 Poor hydrophilicity results in slow degradation rate in water. Although the hydrophilicity of PLGA could be modified by adjusting the ratio of lactic acid and glycolic acid,4,46,47 it is still undesirable. The novel S/O/Ns method we used is to solve the issues. The advantages of S/O/Ns were that we could not only fabricate PM loading specific drug, but bring HA nanoparticles self-assembled on the PM. After the fabrication, the morphology of PM, SR-PM, and SR-PM-HA was characterized by SEM. The porous structure could be clearly observed in three kinds of microspheres (Fig. 2a–c). The surfaces of PM and SR-PM were smooth whereas that of SR-PM-HA was rough. This was because that nanoparticles were uniformly self-assembled on the microsphere surface (Fig. 2c). The microspheres had an interconnected porous structure that was favorable for cell adhesion and proliferation (Fig. 2d). Particle size distribution results showed that the sizes of three kinds of microspheres were similar. They ranged in sizes from 400–1000 nm, 4–20 μm, and 20–200 μm (Fig. 3). The mean size was in the range of 20–200 μm. Generally, the size and the shape were appropriate for the further fabrication of porous microspheres. | ||
| Fig. 3 Size distributions of particles. (a) PM, (b) SR-PM, and (c) SR-PM-HA size ranged from 400–1000 nm, 4–20 μm, and 20–200 μm. The mean PM droplet size was 20–200 μm. | ||
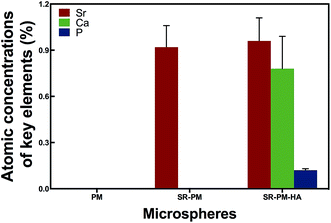
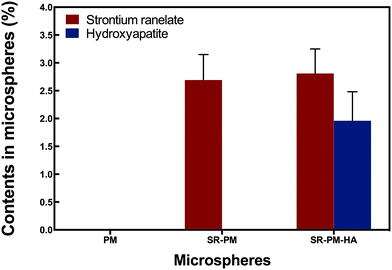
In order to confirm that SR was loaded and HA nanoparticles were self-assembled on the microspheres, we analyzed microsphere composition AAS (Fig. 4). PM did not contain Sr, P, or Ca; SR-PM contained Sr (0.92% ± 0.14%) but not P or Ca; and SR-PM-HA contained Sr (0.96% ± 0.15%), P (0.78% ± 0.15%), and Ca (0.21% ± 0.01%). The SR content of SR-PM and SR-PM-HA was 2.69% ± 0.46% and 2.81% ± 0.44%, respectively; and the HA content of SR-PM-HA was 19.6% ± 0.52% (Fig. 5). These results indicate that SR was effectively encapsulated by PM and HA on the PM surface.
3.2 Degradation and drug loading-release property of SR-PM and SR-PM-HA
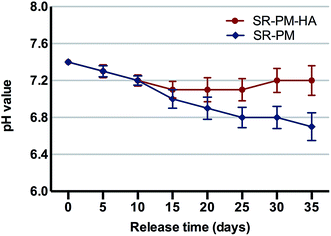
In an aqueous environment, PLGA is degraded by hydrolysis of its ester linkages into lactic and glycolic acids, which can activate an inflammatory response. Microspheres with HA nanoparticles can neutralize the acidity of PLGA degradation products. After 2 weeks in solution, pH decreased markedly, with no difference observed between PM and PM-HA (Fig. 6). However, in the subsequent 3 weeks, PM-HA stabilized the pH above 7.1. It is possible that alkaline HA nanoparticles released from PM quenched hydrogen ions that dissociated from lactic and glycolic acids.ASS results showed that the SR content of SR-PM and SR-PM-HA was 2.69% ± 0.46% and 2.81% ± 0.44% (Fig. 5). Real total weight of SR encapsulated in PM was regarded as A mg PM; the total weight of SR added to the PM formulation was 13.4 mg and the total amount of obtained PM was B mg. SR loading in microspheres was calculated with the following equations.
| Encapsulation efficiency = (A) × (B ÷ 15) × 100% ÷ 13.4 |
| Encapsulation efficiency of SR-PM = 54.02% ± 9.26% |
| Encapsulation efficiency of SR-PM-HA = 56.45% ± 8.35% |
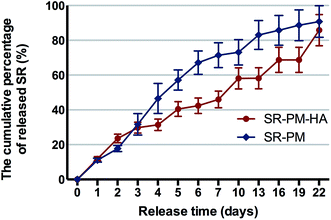
The percent cumulative release of SR from SR-PM was 90% in 22 days as compared to 85% from SR-PM-HA (Fig. 7). In both cases the release was gradual, with no burst release observed. PLGA is a biocompatible and biodegradable material that can be used for drug delivery.2,4,6,48,49 Drugs are released by diffusion, erosion of the polymer, or both. In our study, drug-loaded microspheres showed sustained rather than burst release, which is a desirable attribute for a drug carrier. The time-course of release from SR-PM can be described by first-order kinetics (i.e., gradual decrease in release rate as the amount of remaining drug decreases) (Fig. 7). However, SR-PM-HA exhibited zero-order kinetics (i.e., release rate is constant even when the amount of remaining drug decreases). This is reasonable because nanoparticles self-assembled on the surface of microspheres are surfactants; moreover, microspheres with self-assembled HA nanoparticles have a large specific surface area and HA nanoparticles occupy a large portion of the microsphere surface, which could reduce the amount of drug that can bind. Finally, we concluded that HA nanoparticles could regulate the pH of the microenvironment with PLGA degradation, which causes local acidity; moreover, SR contains carboxyl, which dissolves in alkaline environments. This can explain the constant release rate of SR-PM-HA. We propose that the S/O/Ns method reduced the amount of drug on the microsphere surface and thereby prevented burst release. Self-assembled HA enabled sustained drug release from PLGA microspheres.
3.3 Biocompatibility and osteoinductivity of SR-PM-HA
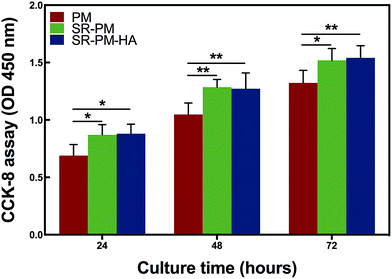
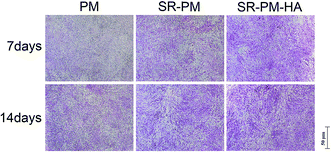
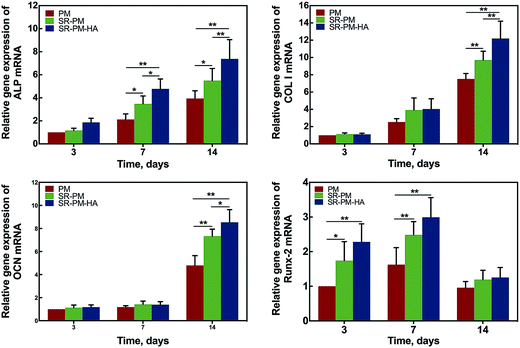
MC3T3-E1 cells were cultured with PM, SR-PM, and SR-PM-HA for various times and proliferation was evaluated with the CCK-8 assay (Fig. 8). Compared to PM, SR and SR-PM-HA showed no cytotoxicity. Moreover, after 3 days, SR-PM and SR-PM-HA stimulated cell proliferation to similar degrees. These results indicate that the microspheres are biocompatible and are thus suitable as biomaterials. SR has been shown to induce preosteoblast growth50 and has a positive effect on MC3T3-E1 cell proliferation and differentiation, consistent with our observations.51 SR was also found to influence cellular processes via interactions with calcium-sensing receptors, which leads to upregulation of ETS-related gene 1 and c-fos, two regulators of osteoblast proliferation.52The osteoinductive activity of PM, SR-PM, and SR-PM-HA was investigated by examining MC3T3-E1 cell differentiation after 7 and 14 days based on ALP staining and the expression of osteogenic differentiation markers (Fig. 9). At both time points, ALP staining intensity was highest for SR-PM-HA, followed by SR-PM and PM. We also examined the expression of the osteoblast markers ALP, Col I, OCN, and Runx-2 (ref. 53–55) by RT-PCR. After 3 days, there was no change in ALP expression in cells cultured with PM, SR-PM, or SR-PM-HA (P > 0.05). However, at 7 and 14 days, ALP level was higher in cells cultured with SR-PM-HA than in those cultured with SR-PM or PM(P < 0.05). Similarly, levels of Col I and OCN were highest in the SR-PM-HA group (P < 0.05), followed by SR-PM and PM at 14 days. Runx-2 expression was upregulated in cells cultured with SR-PM and SR-PM-HA at 3 and 7 days as compared to those cultured with PM (P < 0.05). The level was decreased at 14 days, although there were no differences observed between SR-PM and SR-PM-HA at any time point (P > 0.05) (Fig. 10).
Osteoporosis is a systemic disease that is characterized by osteopenia and bone tissue damage, which increases bone fragility and risk of fracture.56 Several pharmacologic options are available for osteoporosis treatment, including selective estrogen receptor modulators, bisphosphonates, calcitonin, strontium, and parathyroid hormone. Whereas most of these only inhibit bone resorption by osteoclasts, the latter two are dual-action bone agents that also induce osteogenesis by osteoblasts.57–59 In the present study, SR stimulated osteogenesis, as evidenced by ALP staining and expression of osteogenic differentiation markers. Osteoblast differentiation is characterized by cell proliferation and matrix mineralization and maturation. ALP is mainly expressed in matrix vesicles or at the cell surface and degrades organic phosphoesters in cartilage and bone.60 As differentiation proceeds, ALP expression gradually increases, peaking as cells enter the matrix maturation stage before decreasing during matrix mineralization. Col I is the most abundant component of mature osteoblasts. OCN is a late bone marker that plays an important role in bone mineralization, which is the final step of osteogenesis. Thus, these three marker genes are sequentially expressed during osteogenesis. On the other hand, Runx-2 is expressed at an early stage.53 ALP staining intensity and the expression of these markers were higher in cells cultured with SR-PM or SR-PM-HA than with PM, indicating that SR enhanced osteogenesis; this is likely achieved via activation of Wnt and other signaling pathways.61 Our observation that SR stimulates the expression of osteoblastic differentiation markers is similar to previous findings in primary murine osteoblasts62 and is in accordance with reports that SR induces osteogenesis by increasing osteoblast differentiation and bone matrix synthesis and mineralization.63–68
PM containing HA have excellent biocompatibility and can be used to engineer bone tissue, since they can enhance osteoblast migration, attachment, and differentiation.69 We suggest that preparing PM by the S/O/Ns method can improve surface hydrophilicity and consequently, biocompatibility; moreover, HA may neutralize the acidity of PLGA degradation products and thus prevent burst release as well as an inflammatory response. We also speculate that microspheres promote osteoblast attachment, migration, and differentiation by HA self-assembly on the PM surface and drug release.
HA has similar properties to bone minerals70,71 and has been used in biomaterials and as adsorbents or catalysts.72–76 It is considered suitable for bone regeneration, particularly in orthopedic implants to accelerate the growth of surrounding bone without causing systemic toxicity or an immune reaction.77,78 Various methods have been developed to generate HA molecules with specific crystallinity, particle size, and morphology.79,80 Owing to its biocompatibility, biodegradability, inorganic properties, and ease of fabrication, HA is not only by itself an excellent biomaterial for implants81–85 but can also be combined with other materials for a variety of applications, such as implant coatings86–90 or fabrication of nanomaterials.76,91,92 HA in conjunction with other biodegradable microspheres has been used to construct an injectable scaffold93 that promoted osteoblast attachment and proliferation and ALP activity. Previous studies have reported good biocompatibility of self-assembled HA molecules,86,94 consistent with our results.
4 Conclusion
SR-PM-HA has been fabricated by the S/O/Ns method according to the following stages: (i) preparation of S/O emulsion with methylene chloride combined with PLGA, SR and NH4HCO3, (ii) preparation of O/Ns emulsion formed by suspension with HA nanoparticles to PVA, (iii) and combination of S/O and O/Ns. SR-PM-HA has no cytotoxicity and performs satisfying drug release property, so it is suitable to be applied as drug delivery systems. SR-PM-HA could effectively promote the proliferation and stimulate the osteogenic differentiation of MC3T3-E1 cells. Our findings indicate that SR-PM-HA is a promising biomaterial for the treatment of bone defects by bone regeneration. To better investigate the osteoinductivity ability of SR-PM-HA, we would use human bone marrow stem cells for in vitro experiments and confirm our observations in vivo in the future.Acknowledgements
This work was supported by the National Natural Science Foundation for Youths (Grant No. 81401852), This work was supported by the National Natural Science Foundation (Grant No. 51631009 and 81373366), the Natural Science Foundation of Shanghai (No. 14ZR1424000), “Chen Guang” Project of the Shanghai Municipal Education Commission, Shanghai Education Development Foundation (No. 14CG14) and Funds for Interdisciplinary Projects of Medicine and Engineering of Shanghai JiaoTong University (No. YG2014QN06, YG2015MS06, YG2015QN13).References
- C. Bouissou, J. J. Rouse, R. Price and C. F. van der Walle, Pharm. Res., 2006, 23, 1295–1305 CrossRef CAS PubMed.
- R. A. Jain, Biomaterials, 2000, 21, 2475–2490 CrossRef CAS PubMed.
- J. Zhou, S. Han, Y. Dou, J. Lu, C. Wang, H. He, X. Li and J. Zhang, Int. J. Pharm., 2013, 448, 175–188 CrossRef CAS PubMed.
- S. C. Loo, Z. Y. Tan, Y. J. Chow and S. L. Lin, J. Pharm. Sci., 2010, 99, 3060–3071 CrossRef CAS PubMed.
- J. M. Chan, L. Zhang, K. P. Yuet, G. Liao, J. W. Rhee, R. Langer and O. C. Farokhzad, Biomaterials, 2009, 30, 1627–1634 CrossRef CAS PubMed.
- H. Wang, P. Zhao, W. Su, S. Wang, Z. Liao, R. Niu and J. Chang, Biomaterials, 2010, 31, 8741–8748 CrossRef CAS PubMed.
- Z. Zhai, X. Qu, H. Li, K. Yang, P. Wan, L. Tan, Z. Ouyang, X. Liu, B. Tian, F. Xiao, W. Wang, C. Jiang, T. Tang, Q. Fan, A. Qin and K. Dai, Biomaterials, 2014, 35, 6299–6310 CrossRef CAS PubMed.
- W. Liu, T. Wang, C. Yang, B. W. Darvell, J. Wu, K. Lin, J. Chang, H. Pan and W. W. Lu, Osteoporosis Int., 2016, 27, 93–104 CrossRef CAS PubMed.
- T. R. Arnett, J. Nutr., 2008, 138, 415S–418S CAS.
- M. Adabi, M. Naghibzadeh, M. Adabi, M. A. Zarrinfard, S. S. Esnaashari, A. M. Seifalian, R. Faridi-Majidi, H. Tanimowo Aiyelabegan and H. Ghanbari, Artif. Cells, Nanomed., Biotechnol., 2017, 45, 833–842 CrossRef CAS PubMed.
- K. Ariga, Anal. Sci., 2016, 32, 1141–1149 CrossRef PubMed.
- Y. Cui, B. Li, H. He, W. Zhou, B. Chen and G. Qian, Acc. Chem. Res., 2016, 49, 483–493 CrossRef CAS PubMed.
- N. C. Huang, Q. Ji, T. Yamazaki, W. Nakanishi, N. Hanagata, K. Ariga and S. H. Hsu, Phys. Chem. Chem. Phys., 2015, 17, 25455–25462 RSC.
- Z. Huang and S. Che, Bull. Chem. Soc. Jpn., 2015, 88, 617–632 CrossRef CAS.
- Z. Huang, Y. Yao, L. Han and S. Che, Chemistry, 2014, 20, 17068–17076 CrossRef CAS PubMed.
- Y. Jiao, X. Pang, M. Liu, B. Zhang, L. Li and G. Zhai, Colloids Surf., B, 2016, 140, 361–372 CrossRef CAS PubMed.
- B. Li, H. M. Wen, Y. Cui, W. Zhou, G. Qian and B. Chen, Adv. Mater., 2016, 28, 8819–8860 CrossRef CAS PubMed.
- V. Malgras, Q. Ji, Y. Kamachi, T. Mori, F.-K. Shieh, K. C.-W. Wu, K. Ariga and Y. Yamauchi, Bull. Chem. Soc. Jpn., 2015, 88, 1171–1200 CrossRef CAS.
- Q. Tang, J. Liu, L. K. Shrestha, K. Ariga and Q. Ji, ACS Appl. Mater. Interfaces, 2016, 8, 18922–18929 CAS.
- I. Uddin, S. Venkatachalam, A. Mukhopadhyay and M. A. Usmani, Curr. Pharm. Des., 2016, 22, 1472–1484 CrossRef CAS PubMed.
- J. Li, Y. Qiao and Z. Wu, J. Controlled Release, 2017, 256, 9–18 CrossRef CAS PubMed.
- T. Matoba, J. I. Koga, K. Nakano, K. Egashira and H. Tsutsui, J. Cardiol., 2017 DOI:10.1016/j.jjcc.2017.03.005.
- N. Rahoui, B. Jiang, N. Taloub and Y. D. Huang, J. Controlled Release, 2017, 255, 176–201 CrossRef CAS PubMed.
- X. Liu, M. Zhao, J. Lu, J. Ma, J. Wei and S. Wei, Int. J. Nanomed., 2012, 7, 1239–1250 CrossRef CAS PubMed.
- I. J. Castellanos, G. Cruz, R. Crespo and K. Griebenow, J. Controlled Release, 2002, 81, 307–319 CrossRef CAS PubMed.
- A. G. Coombes, M. K. Yeh, E. C. Lavelle and S. S. Davis, J. Controlled Release, 1998, 52, 311–320 CrossRef CAS PubMed.
- S. Freitas, H. P. Merkle and B. Gander, J. Controlled Release, 2005, 102, 313–332 CrossRef CAS PubMed.
- J. H. Kim and Y. H. Bae, Eur. J. Pharm. Sci., 2004, 23, 245–251 CrossRef CAS PubMed.
- S. Takada, Y. Yamagata, M. Misaki, K. Taira and T. Kurokawa, J. Controlled Release, 2003, 88, 229–242 CrossRef CAS PubMed.
- W. Lu and T. G. Park, PDA J. Pharm. Sci. Technol., 1995, 49, 13–19 CAS.
- T. G. Park, H. Yong Lee and Y. Sung Nam, J. Controlled Release, 1998, 55, 181–191 CrossRef CAS PubMed.
- L. Jorgensen, E. H. Moeller, M. van de Weert, H. M. Nielsen and S. Frokjaer, Eur. J. Pharm. Sci., 2006, 29, 174–182 CrossRef CAS PubMed.
- T. Morita, Y. Sakamura, Y. Horikiri, T. Suzuki and H. Yoshino, J. Controlled Release, 2000, 69, 435–444 CrossRef CAS PubMed.
- T. Ren, W. Yuan, H. Zhao and T. Jin, Micro Nano Lett., 2011, 6, 70–74 CAS.
- K. G. Carrasquillo, A. M. Stanley, J. C. Aponte-Carro, P. De Jesus, H. R. Costantino, C. J. Bosques and K. Griebenow, J. Controlled Release, 2001, 76, 199–208 CrossRef CAS PubMed.
- W. Yuan, F. Wu, Y. Geng, S. Xu and T. Jin, Int. J. Pharm., 2007, 339, 76–83 CrossRef CAS PubMed.
- W. Yuan and Z. Liu, Int. J. Nanomed., 2012, 7, 257–270 CrossRef CAS PubMed.
- X. Hong, L. Wei, L. Ma, Y. Chen, Z. Liu and W. Yuan, Int. J. Nanomed., 2013, 8, 2433–2441 Search PubMed.
- Y. Cai, Y. Chen, X. Hong, Z. Liu and W. Yuan, Int. J. Nanomed., 2013, 8, 1111–1120 Search PubMed.
- C. Z. Zhang, J. Niu, Y. S. Chong, Y. F. Huang, Y. Chu, S. Y. Xie, Z. H. Jiang and L. H. Peng, Eur. J. Pharm. Biopharm., 2016, 109, 1–13 CrossRef CAS PubMed.
- K. Jiang, H. Zhao, J. Dai, D. Kuang, T. Fei and T. Zhang, ACS Appl. Mater. Interfaces, 2016, 8, 25529–25534 CAS.
- J. W. Park, Y. P. Yun, K. Park, J. Y. Lee, H. J. Kim, S. E. Kim and H. R. Song, Colloids Surf., B, 2016, 147, 265–273 CrossRef CAS PubMed.
- Y. Wei, Y. Wang, H. Zhang, W. Zhou and G. Ma, J. Colloid Interface Sci., 2016, 478, 46–53 CrossRef CAS PubMed.
- Q. Xiao, K. Zhou, C. Chen, M. Jiang, Y. Zhang, H. Luo and D. Zhang, Mater. Sci. Eng., C, 2016, 69, 1068–1074 CrossRef CAS PubMed.
- P. Kasten, R. Luginbuhl, M. van Griensven, T. Barkhausen, C. Krettek, M. Bohner and U. Bosch, Biomaterials, 2003, 24, 2593–2603 CrossRef CAS PubMed.
- A. C. Grayson, G. Voskerician, A. Lynn, J. M. Anderson, M. J. Cima and R. Langer, J. Biomater. Sci., Polym. Ed., 2004, 15, 1281–1304 CrossRef CAS PubMed.
- L. Lu, S. J. Peter, M. D. Lyman, H. L. Lai, S. M. Leite, J. A. Tamada, S. Uyama, J. P. Vacanti, R. Langer and A. G. Mikos, Biomaterials, 2000, 21, 1837–1845 CrossRef CAS PubMed.
- Q. Wang, J. Wang, Q. Lu, M. S. Detamore and C. Berkland, Biomaterials, 2010, 31, 4980–4986 CrossRef CAS PubMed.
- T. G. Kim, H. Lee, Y. Jang and T. G. Park, Biomacromolecules, 2009, 10, 1532–1539 CrossRef CAS PubMed.
- J. Caverzasio, Bone, 2008, 42, 1131–1136 CrossRef CAS PubMed.
- S. Takaoka, T. Yamaguchi, S. Yano, M. Yamauchi and T. Sugimoto, Horm. Metab. Res., 2010, 42, 627–631 CrossRef CAS PubMed.
- N. Chattopadhyay, S. J. Quinn, O. Kifor, C. Ye and E. M. Brown, Biochem. Pharmacol., 2007, 74, 438–447 CrossRef CAS PubMed.
- P. Ducy, R. Zhang, V. Geoffroy, A. L. Ridall and G. Karsenty, Cell, 1997, 89, 747–754 CrossRef CAS PubMed.
- R. T. Franceschi, Crit. Rev. Oral Biol. Med., 1999, 10, 40–57 CAS.
- Y. Wang, T. Uemura, J. Dong, H. Kojima, J. Tanaka and T. Tateishi, Tissue Eng., 2003, 9, 1205–1214 CrossRef CAS PubMed.
- E. S. Siris, R. Adler, J. Bilezikian, M. Bolognese, B. Dawson-Hughes, M. J. Favus, S. T. Harris, S. M. Jan de Beur, S. Khosla, N. E. Lane, R. Lindsay, A. D. Nana, E. S. Orwoll, K. Saag, S. Silverman and N. B. Watts, Osteoporosis Int., 2014, 25, 1439–1443 CrossRef CAS PubMed.
- A. S. Hurtel-Lemaire, R. Mentaverri, A. Caudrillier, F. Cournarie, A. Wattel, S. Kamel, E. F. Terwilliger, E. M. Brown and M. Brazier, J. Biol. Chem., 2009, 284, 575–584 CrossRef CAS PubMed.
- T. C. Brennan, M. S. Rybchyn, W. Green, S. Atwa, A. D. Conigrave and R. S. Mason, Br. J. Pharmacol., 2009, 157, 1291–1300 CrossRef CAS PubMed.
- G. J. Atkins, K. J. Welldon, P. Halbout and D. M. Findlay, Osteoporosis Int., 2009, 20, 653–664 CrossRef CAS PubMed.
- D. A. Wang, C. G. Williams, F. Yang, N. Cher, H. Lee and J. H. Elisseeff, Tissue Eng., 2005, 11, 201–213 CrossRef CAS PubMed.
- G. A. Fielding, W. Smoot and S. Bose, J. Biomed. Mater. Res., Part A, 2014, 102, 2417–2426 CrossRef PubMed.
- E. Bonnelye, A. Chabadel, F. Saltel and P. Jurdic, Bone, 2008, 42, 129–138 CrossRef CAS PubMed.
- S. Choudhary, P. Halbout, C. Alander, L. Raisz and C. Pilbeam, J. Bone Miner. Res., 2007, 22, 1002–1010 CrossRef CAS PubMed.
- E. Canalis, M. Hott, P. Deloffre, Y. Tsouderos and P. J. Marie, Bone, 1996, 18, 517–523 CrossRef CAS PubMed.
- W. Querido, M. Farina and K. Anselme, Biomatter, 2015, 5, e1027847 CrossRef PubMed.
- F. Yang, D. Yang, J. Tu, Q. Zheng, L. Cai and L. Wang, Stem Cell., 2011, 29, 981–991 CrossRef CAS PubMed.
- P. J. Marie, Bone, 2006, 38, S10–S14 CrossRef CAS PubMed.
- P. Ammann, Bone, 2006, 38, 15–18 CrossRef PubMed.
- G. Xiao, H. Yin, W. Xu and Y. Lu, J. Biomater. Sci., Polym. Ed., 2016, 27, 1462–1475 CrossRef CAS PubMed.
- M. Al-Jawad, A. Steuwer, S. H. Kilcoyne, R. C. Shore, R. Cywinski and D. J. Wood, Biomaterials, 2007, 28, 2908–2914 CrossRef CAS PubMed.
- P. Malmberg and H. Nygren, Proteomics, 2008, 8, 3755–3762 CrossRef CAS PubMed.
- Y. Matsuura, A. Onda and K. Yanagisawa, Catal. Commun., 2014, 48, 5–10 CrossRef CAS.
- F. J. O'brien, Mater. Today, 2011, 14, 88–95 CrossRef.
- S. H. Tan, X. G. Chen, Y. Ye, J. Sun, L. Q. Dai and Q. Ding, J. Hazard. Mater., 2010, 179, 559–563 CrossRef CAS PubMed.
- F. Ye, H. Guo, H. Zhang and X. He, Acta Biomater., 2010, 6, 2212–2218 CrossRef CAS PubMed.
- W. P. Wijesinghe, M. M. Mantilaka, K. G. Chathuranga Senarathna, H. M. Herath, T. N. Premachandra, C. S. Ranasinghe, R. P. Rajapakse, R. M. Rajapakse, M. Edirisinghe, S. Mahalingam, I. M. Bandara and S. Singh, Mater. Sci. Eng., C, 2016, 63, 172–184 CrossRef CAS PubMed.
- T. Kokubo and H. Takadama, Biomaterials, 2006, 27, 2907–2915 CrossRef CAS PubMed.
- P. O'Hare, B. J. Meenan, G. A. Burke, G. Byrne, D. Dowling and J. A. Hunt, Biomaterials, 2010, 31, 515–522 CrossRef PubMed.
- J. D. Chen, Y. J. Wang, K. Wei, S. H. Zhang and X. T. Shi, Biomaterials, 2007, 28, 2275–2280 CrossRef CAS PubMed.
- F. Chen, Q. L. Tang, Y. J. Zhu, K. W. Wang, M. L. Zhang, W. Y. Zhai and J. Chang, Acta Biomater., 2010, 6, 3013–3020 CrossRef CAS PubMed.
- Z. Zhao, M. Espanol, J. Guillem-Marti, D. Kempf, A. Diez-Escudero and M. P. Ginebra, Nanoscale, 2016, 8, 1595–1607 RSC.
- J. Yu, H. Yang, K. Li, J. Lei, L. Zhou and C. Huang, J. Dent., 2016, 50, 21–29 CrossRef CAS PubMed.
- S. Pujari-Palmer, S. Chen, S. Rubino, H. Weng, W. Xia, H. Engqvist, L. Tang and M. K. Ott, Biomaterials, 2016, 90, 1–11 CrossRef CAS PubMed.
- N. S. Remya, S. Syama, V. Gayathri, H. K. Varma and P. V. Mohanan, Colloids Surf., B, 2014, 117, 389–397 CrossRef CAS PubMed.
- D. Gopi, M. T. Ansari, E. Shinyjoy and L. Kavitha, Spectrochim. Acta, Part A, 2012, 87, 245–250 CrossRef CAS PubMed.
- J. Shen, Y. Qi, B. Jin, X. Wang, Y. Hu and Q. Jiang, J. Biomed. Mater. Res., Part B, 2017, 105, 124–135 CrossRef CAS PubMed.
- A. Pommer, G. Muhr and A. David, J. Bone Jt. Surg., Am. Vol., 2002, 84, 1162–1166 CrossRef.
- C. Knabe, G. Berger, R. Gildenhaar, F. Klar and H. Zreiqat, Biomaterials, 2004, 25, 4911–4919 CrossRef CAS PubMed.
- J. C. Babister, L. A. Hails, R. O. Oreffo, S. A. Davis and S. Mann, Biomaterials, 2009, 30, 3174–3182 CrossRef CAS PubMed.
- D. Li, C. Ye, Y. Zhu, Z. Gou and C. Gao, J. Biomed. Mater. Res., Part B, 2012, 100, 1103–1113 CrossRef PubMed.
- Y. Wan, C. Wu, G. Xiong, G. Zuo, J. Jin, K. Ren, Y. Zhu, Z. Wang and H. Luo, J. Mech. Behav. Biomed. Mater., 2015, 47, 29–37 CrossRef CAS PubMed.
- B. Ma, S. Zhang, R. Liu, J. Qiu, L. Zhao, S. Wang, J. Li, Y. Sang, H. Jiang and H. Liu, Nanoscale, 2017, 9, 2162–2171 RSC.
- X. Hu, H. Shen, F. Yang, X. Liang, S. Wang and D. Wu, Appl. Surf. Sci., 2014, 292, 764–772 CrossRef CAS.
- J. Chen, Z. Wang, Z. Wen, S. Yang, J. Wang and Q. Zhang, Colloids Surf., B, 2015, 127, 47–53 CrossRef CAS PubMed.
Footnote |
| † Zhenyang Mao and Zhiwei Fang contributed equally to this work. |
| This journal is © The Royal Society of Chemistry 2017 |

