 Open Access Article
Creative Commons Attribution 3.0 Unported Licence
Hyaluronic acid-based carbon dots for efficient gene delivery and cell imaging†
Hai-Jiao Wang,
Ji Zhang*,
Yan-Hong Liu,
Tian-Ying Luo,
Xi He and
Xiao-Qi Yu *
*
Key Laboratory of Green Chemistry and Technology (Ministry of Education), College of Chemistry, Sichuan University, Chengdu 610064, PR China. E-mail: jzhang@scu.edu.cn; xqyu@scu.edu.cn; Fax: +86-28-85415886
First published on 9th March 2017
Abstract
A strategy that uses hyaluronic acid (HA) as a carbon source and polyethylenimine (PEI) as a passivant to construct carbon dots (HA-Cds) was proposed. The synthetic method is simple and green and no additive was required. These carbon dots could emit strong blue fluorescence under UV light. FT-IR and 1H NMR spectra confirmed that part of characteristic residues of HA and PEI remained in the HA-Cds structure. These materials had much lower cytotoxicity than PEI and high serum tolerance. Up to 50 times higher transfection efficiency than that of PEI was obtained in the presence of 10% serum. BSA protein adsorption, flow cytometry, and confocal microscopy assays also supported their good performance with serum. Furthermore, as multifunctional materials, HA-Cds had good intracellular imaging ability and displayed tunable fluorescence emission under varying excitation wavelengths. An HA competition assay showed that they may have target cell imaging ability in CD44 overexpressed cells. These materials with fluorescence activity also facilitated co-localization experiments by CLSM, which revealed that the DNA cargo could be effectively released into the cytosol, leading to effective gene transfection. These properties make the carbon dots promising candidates for in vivo diagnosis and gene therapy.
Introduction
Many diseases such as cancers, cystic fibrosis, AIDS, and cardiovascular ailments have become serious threats to people's health.1–3 Although traditional therapeutics such as chemotherapy, radiotherapy, and surgery have been developed to treat these diseases with some success, their cure at the level of their origin and prevention of relapses remain complex problems.4 As a new, powerful approach for the treatment of these severe diseases, gene therapy has attracted significant attention. The success of gene therapy largely depends on the effective transfer of a specific therapeutic gene to unhealthy cells. Because the spontaneous entry of naked nucleic acids into target cells is very difficult, gene transfer into cells primarily depends on vectors. Compared to viral vectors, non-viral gene vectors offer a safer and simpler method for the delivery of therapeutic genes. However, the relatively low in vivo transfection efficiency (TE) and potential toxicity still limit the clinical use of synthetic vectors.5–7 Therefore, it is still urgently necessary to design and synthesize novel non-viral gene vectors that may overcome transfection barriers such as protein-induced instability, cellular uptake, endosome escape, and nucleic acid release.As a new class of fluorescent nanomaterials with good chemical stability, lack of blinking, and low-toxicity, carbon dots (Cds) have drawn tremendous attention in the field of nanotechnology.8,9 One-step hydrothermal or microwave (MW)-assisted methods were widely used to construct Cds.10–12 Some inexpensive and biocompatible small molecules such as citrate,13 ascorbic acid,14 glucose,15 and ethanol16 were often used as carbon resources. On the other hand, effective surface passivation is another essential step to produce Cds with high fluorescence intensity.8 Using polyamine compounds as passivation agents can not only enhance their fluorescence intensity but also allow straightforward installation of cationic charge on the surface of the nanoparticles, offering them DNA binding capacity. Liu and coworkers first used polyethylenimine (PEI)-functionalized Cds, which were prepared with PEI as a surface passivation agent through one-step MW-assisted pyrolysis of glycerol, as gene vectors.17 Wang et al. passivated Cds by using alkyl-PEI 2 kDa for the safe and highly efficient delivery of siRNA and DNA.18 More recently, Pierrat and coworkers employed citric acid and bPEI 25 kDa under MW irradiation to construct Cds as efficient gene nanocarriers.19 However, the designed Cds in these limited reports usually showed lower TE compared to PEI 25 kDa, and their preparation methods were not mild and convenient enough as they required additives (acid/salt) or harsh conditions (e.g. laser ablation).
Although branched PEI 25 kDa has been used as a “golden standard” for non-viral gene vectors due to its high TE and universality for many cell lines, its high toxicity and low serum compatibility largely limit its use in vivo.20 The introduction of zwitterions or negatively charged groups into PEI is regarded as an effective method to overcome the above-mentioned shortcomings.21–24 For example, polyethylene glycol (PEG) has been commonly used to improve the biocompatibility of cationic materials.25–27 Hyaluronic acid (HA) is another biocompatible species used in the formation of nano-vectors. The negative charges on HA may afford a similar “stealth effect” to that observed with PEG.28,29 Besides, it is also known that HA has a strong affinity to bind cell-specific surface markers such as cluster determinant 44 (CD44) receptors, which are overexpressed on various tumor cells.30,31 To the best of our knowledge, the use of two polymers with no additives (acid, base and/or oxidant) to directly construct Cds by a MW-assisted method has not yet been reported. Herein, we prepared a class of Cds by using HA as a carbon source and PEI as a surface passivation agent via simple MW-assisted pyrolysis. We hope that the resulting nanomaterials will combine the advantages of Cds, PEI, and HA and will act as multifunctional biocompatible materials for simultaneous gene delivery and cell imaging.
Results and discussion
Preparation and characterization of HA-Cds
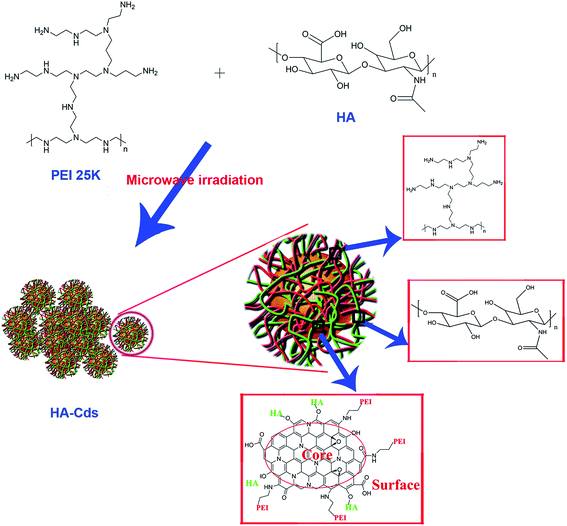
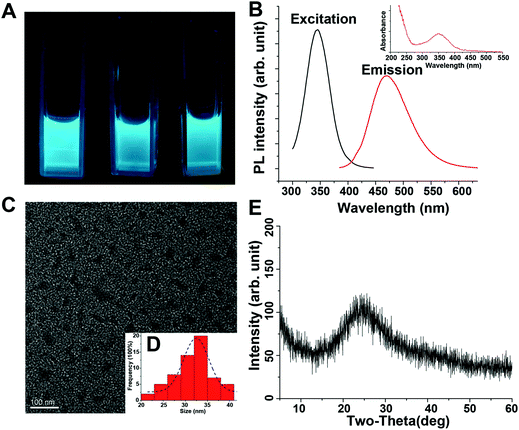
MW-assisted Cd preparation always uses small molecules as carbon sources or additives. In this work, we prepared six HA-based Cds (HA-Cds) by direct MW-assisted pyrolysis of PEI 25 kDa and HA with no additives (Scheme 1). Under MW irradiation, HA was dehydrated and then PEI was passivated to form the Cds. As HA and PEI are both polymers, their residues would be retained on the HA-Cd surface under the relatively mild preparation conditions. The cationic amino groups on the PEI residues can help the HA-Cds to bind and condense negatively charged DNA, while the HA residues might improve their biocompatibility. These Cds were named as HA-CPx, in which CP refers to the Cd-based polymer and x indicates the total MW irradiation time (min) for the preparation. Subsequently, the optical properties of these Cds were studied. As shown in Fig. 1A, all of the prepared HA-Cds (for the other three see Fig. S1†) emitted strong blue luminescence under UV light (365 nm). At this excitation wavelength, the maximum emission wavelength (λem) of HA-CP10 was found to be 470 nm and the maximum excitation wavelength (λex) was measured as 345 nm (Fig. 1B). The full width at half maximum (FWHM) under excitation at 365 nm was about 79 nm, which was smaller than the values reported in the literature.17,32 We also studied the optical properties of five other Cds, and similar results were obtained (Fig. S2†). Transmission electron microscopy (TEM) was performed to study the morphology of HA-CP10, and the anhydrous state particle diameter was measured as 32.5 ± 0.5 nm (Fig. 1C and D). Atomic force microscopy (AFM) images showed that the height of the HA-CP10 particles was 1 to 3.5 nm (Fig. S3†). The X-ray diffraction (XRD) pattern (Fig. 1E) displays a broad diffraction peak at 2θ = 24.4°, suggesting an amorphous nature. In addition, dynamic light scattering (DLS) was also applied to characterize the hydrodynamic sizes of these HA-Cds (Table S1†). When the microwave irradiation time was increased, their hydrodynamic sizes gradually decreased. This may be due to the increased consumption of PEI and HA residues as the irradiation time is increased.FT-IR was employed to identify the organic functional groups on the HA-Cds (Fig. S4†). The new strong peak at 1630 cm−1 reflects the presence of amide carbonyls, indicating successful conjugation between amines of PEI and carboxyls of HA. On the other hand, after microwave irradiation, some characteristic absorption peaks of raw PEI and HA remained in the spectra of the Cds. For example, the absorbance peaks of HA at 1388 cm−1 and 1049 cm−1 were attributed to carboxylate symmetric stretching and C–O stretching, respectively, and a broad band centered at 3432 cm−1 might suggest the existence of –OH and –NH. Their chemical structures were also characterized by 1H NMR (Fig. S5†). Multiplets with a chemical shift (δ) of 2.4–2.8 ppm were attributed to protons on the –CH2N– of PEI, which was successfully passivated in the HA-Cds. As with the IR analysis, characteristic NMR peaks of HA could still be found in the spectra of HA-Cds, further indicating that HA did not completely transform to the carbon core and some of its residues remained even after extended MW irradiation. For the HA-Cds, after various MW treatment times, no obvious differences were found in either the IR or NMR spectra. We therefore suppose that the six Cds might have similar structures and compositions. This was further proved by elemental analysis, which also gave similar C, N, and H contents for all the HA-Cds (Table S2†).
One important characteristic of PEI is its buffering ability over a wide range of pH values. This buffering property is known as the “proton sponge effect” and might enable PEI to escape more efficiently from the endosome.1 Therefore, the buffering capacities of these PEI-passivated HA-Cds, expressed as the percentage of amine groups that could be protonated within the endosome pH range of 7.4–5.1, were determined from acid–base titration. As shown in Table 1, although part of the PEI structure was damaged during the formation of these carbon dots by MW irradiation, these HA-Cds showed only slightly lower buffering capacity than PEI. In other words, most of the buffering capacity of PEI remained after the preparation of HA-Cds.
| PEI | HA-CP5 | HA-CP10 | HA-CP20 | HA-CP30 | HA-CP40 | HA-CP50 | |
|---|---|---|---|---|---|---|---|
| Buffering capacity | 20.1% | 16.8% | 14.4% | 15.0% | 14.5% | 14.7% | 16.5% |
The fluorescence emissions of the Cds may depend on the λex.8 The photoluminescence spectra recorded for HA-CP10 with λex ranged from 345 to 405 nm (Fig. S6A†). With an increase in λex, the fluorescence intensity decreased remarkably. Meanwhile, the normalized photoluminescence spectra revealed a small emission peak shift in the λex range 345–395 nm (Δλem = 10 nm, Fig. S6B†), which was in agreement with the literature.19 Quinine sulfate in 0.10 M H2SO4 (quantum yield 54%) was selected as a standard sample to calculate the quantum yields of the HA-Cds, and the Cds prepared with 10 min MW treatment (HA-CP10) gave the highest quantum yield (Table S3†). We speculate that the carbon core was not properly formed before 10 min but, on the other hand, when the MW irradiation time was increased, more HA would dehydrate to form a larger carbon core while more PEI was passivated on it, finally leading to a decrease in the photoluminescence performance. It was also reported that the MW pyrolysis time would significantly affect the photoluminescence performance.17
Interactions between the HA-Cds and plasmid DNA
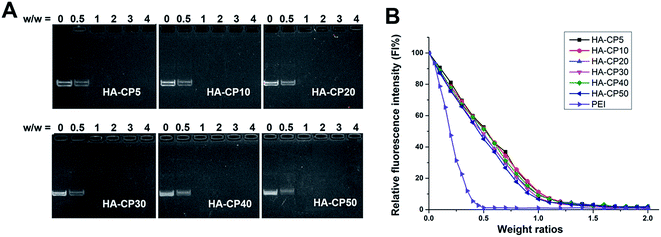
The ability of cationic gene vectors to condense DNA into nanosized particles is a crucial factor for efficient cell transfection. A gel retardation assay was used to confirm the interaction between the HA-Cds and plasmid DNA at various weight ratios, and the results are shown in Fig. 2A. As the weight ratio increased, the intensity of the DNA migration bands in the agarose gel decreased. All the HA-Cds could completely inhibit the electrophoretic mobility of plasmid DNA at a Cd/DNA weight ratio of 1![[thin space (1/6-em)]](https://www.rsc.org/images/entities/char_2009.gif) :
:![[thin space (1/6-em)]](https://www.rsc.org/images/entities/char_2009.gif) 1, suggesting that all the HA-Cds could effectively condense plasmid DNA though electrostatic interactions at a low dose. In addition, since a longer MW pyrolysis time did not reduce the DNA binding ability, it might be supposed that a considerable portion of the amino groups would remain on the surface of the Cds during the MW process. Furthermore, an ethidium bromide (EB) intercalation assay was also used to investigate the DNA affinity of these Cds. The fluorescence of EB can be greatly enhanced by its intercalation into double-stranded DNA, while the addition of gene vectors can expel EB from the intercalation site of the DNA, resulting in fluorescence quenching.33 As shown in Fig. 2B, both PEI and the HA-Cds could almost completely quench the fluorescence of the EB/DNA complex at low weight ratios (0.5 for PEI and 1.0 for HA-Cds), further indicating their good DNA binding ability. The CE50 values, which represent the weight ratios required to quench 50% of the EB fluorescence intensity, were 0.19 for PEI and 0.45–0.52 for the HA-Cds. The higher values for the HA-Cds might be attributed to their lower N content (Table S1†) and the fact that some of the N atoms participated in the formation of the core and could not be protonated.
1, suggesting that all the HA-Cds could effectively condense plasmid DNA though electrostatic interactions at a low dose. In addition, since a longer MW pyrolysis time did not reduce the DNA binding ability, it might be supposed that a considerable portion of the amino groups would remain on the surface of the Cds during the MW process. Furthermore, an ethidium bromide (EB) intercalation assay was also used to investigate the DNA affinity of these Cds. The fluorescence of EB can be greatly enhanced by its intercalation into double-stranded DNA, while the addition of gene vectors can expel EB from the intercalation site of the DNA, resulting in fluorescence quenching.33 As shown in Fig. 2B, both PEI and the HA-Cds could almost completely quench the fluorescence of the EB/DNA complex at low weight ratios (0.5 for PEI and 1.0 for HA-Cds), further indicating their good DNA binding ability. The CE50 values, which represent the weight ratios required to quench 50% of the EB fluorescence intensity, were 0.19 for PEI and 0.45–0.52 for the HA-Cds. The higher values for the HA-Cds might be attributed to their lower N content (Table S1†) and the fact that some of the N atoms participated in the formation of the core and could not be protonated.
Appropriate sizes and zeta potentials are also of great importance for the gene carriers, as these can even determine the endocytosis pathway of the nanoparticles.34 DLS was applied to characterize these properties of the HA-Cd/DNA complexes at different weight ratios (w/w = 0.5, 2, 6, 8, 10, 12, Fig. 3). The complexes showed particle sizes in the range 240–360 nm at the tested weight ratios. Other researchers have found that complexes with sizes between 50 and several hundred nanometers were suitable for cell uptake.35–37 The zeta potentials of the six complexes were also evaluated and found to increase from −5 mV to +44 mV along with an increase in the weight ratios. In general, nanoparticles with a higher positive charge exhibited a stronger affinity for the negatively charged cell membrane, resulting in higher cellular uptake.38,39 Our previous studies found that better gene transfection efficiency could be obtained when the surface charges of the complexes were higher than +20 mV.40–42 In this case, we also found that w/w ≥ 6 (zeta potential > +20 mV) is required for efficient transfection.
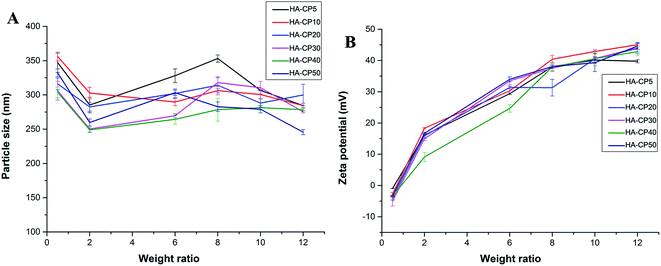 | ||
| Fig. 3 Average particle size (A) and zeta-potential (B) of HA-Cd/DNA complexes at different weight ratios (data represent mean ± SD, n = 3). | ||
Cytotoxicity
High cytotoxicity is a major barrier that significantly limits the use of non-viral gene vectors for gene therapy in clinical applications. Cds have been reported with low toxicity and excellent biocompatibility.43 Meanwhile, the strategy of introducing tissue-friendly HA to Cds might further enhance their biocompatibility. The cell viability after 24 h incubation with HA-Cd/DNA complexes at various weight ratios was evaluated in HeLa cells. As we hoped, these HA-Cd/DNA complexes all have much lower cytotoxicity than PEI (Fig. 4). As the weight ratio increased, the cell viability reduced gradually but only slightly. Even at a high weight ratio of 14, the percentage of surviving cells was still more than 80%, while this value was only 20% for PEI under the same conditions.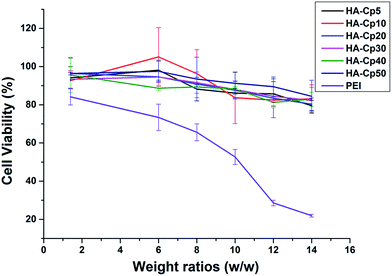 | ||
| Fig. 4 Cytotoxicity of HA-Cd/DNA complexes at different weight ratios (w/w = 1.4, 6, 8, 10, 12, 14) toward HeLa cells; 25 kDa PEI was used as a control. Data represent mean ± SD (n = 3). | ||
In vitro gene transfection
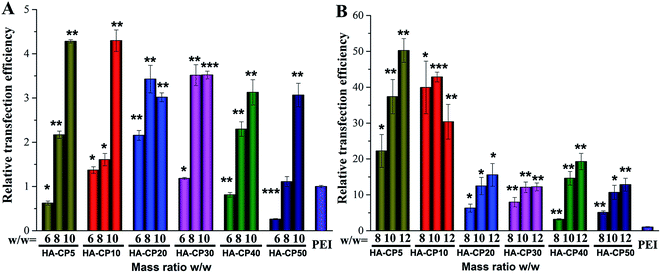
To evaluate the transfection efficiency (TE) of these HA-Cds as non-viral gene delivery vectors, a luciferase transfection assay of HA-Cd/DNA complexes at various w/w ratios was carried out in HeLa cells (Fig. 5) in comparison with 25 kDa PEI, which was used at its optimal w/w ratio of 1.4 (N/P ratio of 10). Before the luciferase transfection, a non-quantitative enhanced green fluorescent protein (eGFP) expression assay was performed to preliminarily optimize the HA-Cd/DNA weight ratio, and it was found that a w/w ≥ 6 is required for efficient transfection (Fig. S7†). The quantitative data also revealed that an increase in the weight ratio led to a significantly increased TE (Fig. 5A). At the optimized weight ratio, all the HA-Cds exhibited 3–4 times higher TE than PEI. Generally, during the formation of Cds involving PEI, the amino groups on PEI were partly consumed to form amide bonds or Cd cores, leading to reduced TE compared to PEI.17 However, our results showed that the PEI-passivated HA-Cds did not reduce but largely enhanced the TEs. We speculated that the low cytotoxicity of the HA-Cds and the formation of core–shell structures might contribute to the enhanced transfection level.17 With respect to the MW time span, it was found that 10 min of MW irradiation was most suitable for the preparation of HA-Cds with high TE. Extending the MW treatment might lead to greater consumption of the amino groups on PEI, which are essential for DNA binding and transfection; thus, a decreased TE might be obtained.It is believed that the toxicity of polycations, the inadequate release of DNA molecules, and the low availability of the vectors caused by aggregation with protein molecules in complex media or a lack of DNA protection are key reasons for a low TE.44 The serum components, especially negatively charged proteins, always exhibit non-specific interactions with cationic vector/DNA complexes, leading to a significantly decreased TE.45 To solve this problem, we introduced electronegative HA to the materials in the hope that such a component, especially its reserved residues, may reduce the cytotoxicity and avoid the dramatic reduction in TE in the physiological environment caused by strong protein adsorption by the cationic gene vector. To our delight, HA-Cds showed significantly higher serum tolerance than PEI. In the presence of serum, a TE of up to 50 times higher than that of PEI was obtained (Fig. 5B). Thus, we believe that the HA residue may exhibit a “stealth effect” and effectively resist non-specific protein adsorption. As with the transfection without serum, HA-Cds prepared via a shorter MW irradiation time have better TE. The transfection in HEK293 cells also confirmed the good serum tolerance of the HA-Cds (Fig. S8†).
To visually compare the gene transfer ability of the studied Cds, we also transfected pEGFP-Nl reporter genes into HeLa cells using an inverted fluorescence microscope for observation. Based on the results from luciferase and cytotoxicity assays, a HA-Cd/DNA weight ratio of 10 was chosen for transfection. The images in Fig. S9† give similar results to the luciferase assay. The transfection mediated by HA-Cds led to much stronger green fluorescence than that using PEI, especially in the presence of serum. Besides, unlike with PEI, the density of transfected cells was seldom affected by the serum, further indicating the good biocompatibility of our materials.
Bovine serum albumin (BSA) was selected as a model protein to simulate the 10% serum condition and to determine the interactions between the vectors and serum components (Fig. 6). After PEI was added, the BSA solution became turbid immediately, indicating fast electrostatic adsorption, which led to aggregation and precipitation. Meanwhile, on the contrary, the HA-Cds caused little aggregation, and the BSA solutions remained transparent after incubation with these Cds. The amount of BSA adsorbed per mg of these cationic materials was also calculated, and the quantitative results exhibited a large difference in the adsorption amount of BSA. This may indicate the good serum tolerance of HA-Cds. In addition, we also studied the stability of HA-Cds (HA-CP10 was chosen as the model) toward 10% fetal bovine serum (FBS, v/v) and different concentrations of bull serum albumin (BSA, 0.1 mg mL−1 and 0.2 mg mL−1) solutions (Table S4†). Although the hydrodynamic particle size of HA-CP10 increased to 113.8 nm toward 10% FBS, the size seldom changed over 3 days, suggesting good stability under protein-rich conditions.
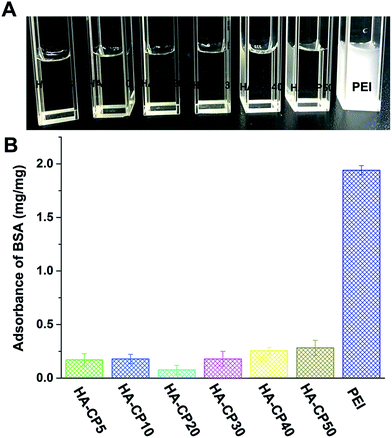 | ||
| Fig. 6 Protein adsorption of the HA-Cds and PEI: (A) intuitive picture; (B) quantitative results. Data represent mean ± SD (n = 3). | ||
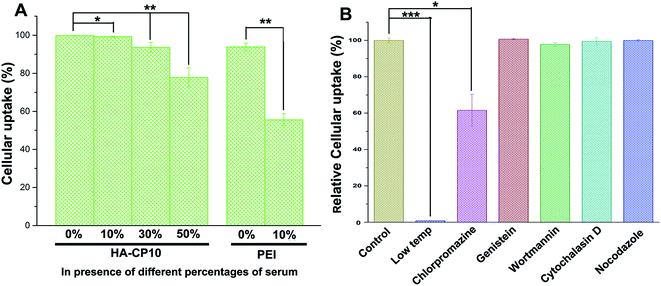
As one of the main barriers in the gene delivery process, the internalization of the nucleic acid complexes largely influences the TE. Flow cytometry was performed to analyze the cellular uptake of DNA. Based on the results of the quantum yields of the HA-Cds, the luciferase assays, and the cytotoxicity, HA-CP10 was chosen as the model. After incubation of the HA-CP10/DNA complexes (at a weight ratio of 10) with HeLa cells for 4 h, the percentage of cells that were positive for Cy5-labeled pDNA was calculated (Fig. 7A). In the absence of serum, HA-CP10 exhibited excellent cellular uptake, and the percentage of positive cells was ∼99.7%. At a serum content of 10%, no obvious decrease in the cellular uptake percentage was found. Although a further increase in the serum concentration led to a gradually reduced uptake, a good percentage of positive cells (77.8%) could also be obtained with 50% serum. On the other hand, for PEI, the percentage of positive cells decreased dramatically to 55.5% with 10% serum. The results also demonstrate the good stability of HA-Cds in extracellular circumstances, and the much better resistance toward serum proteins makes it easier for the HA-Cd complexes to reach the cells. Furthermore, the uptake pathway of HA-Cd/DNA complexes was also studied. Endocytosis has been demonstrated to adopt a variety of forms, such as macropinocytosis, clathrin-mediated endocytosis, and caveolae-mediated endocytosis.46,47 After incubation at 4 °C, the cellular uptake almost ceased (Fig. 7B), indicating that the complexes enter the cells mainly via energy-dependent pathways. The uptake mechanism of such a complex was subsequently studied by using different chemical endocytosis inhibitors. Wortmannin is a phosphatidyl inositol-3-phosphate inhibitor,48 while cytochalasin D can inhibit actin polymerization and membrane ruffling;49 both of these can inhibit the macropinocytosis pathway. Chlorpromazine, genistein, and nocodazole may inhibit the pathways of clathrin-mediated, caveolae-mediated, and microtubule-mediated endocytosis, respectively. The results shown in Fig. 7B reveal that only chlorpromazine may lead to an obvious decrease in cellular uptake, indicating that clathrin-mediated endocytosis might be the major cellular uptake pathway for such a complex. Previous reports have suggested that such an endocytosis pathway might be the most efficient uptake process as it could facilitate the orientation of DNA cargo to the perinuclear region and the subsequent nuclear import.50,51
Confocal laser scanning microscopy (CLSM) was utilized to visually examine the internalization of Cy5-labeled DNA (red) in HeLa cells (Fig. S10†). After 1 h incubation, the red signals could be easily found in the cells. It is worth mentioning that for the HA-CP10-mediated transfection, the guest DNA was mostly distributed in the cytosol, while for the PEI-mediated experiment, most of the Cy5-labeled DNA was distributed close to the cell membrane. This also indicates that transfection by HA-CP10 occurs at a higher rate. As a result, more DNA cargoes could be delivered by HA-CP10 than by PEI, especially for longer transfection times (4 h, Fig. S10†).
Cell imaging studies
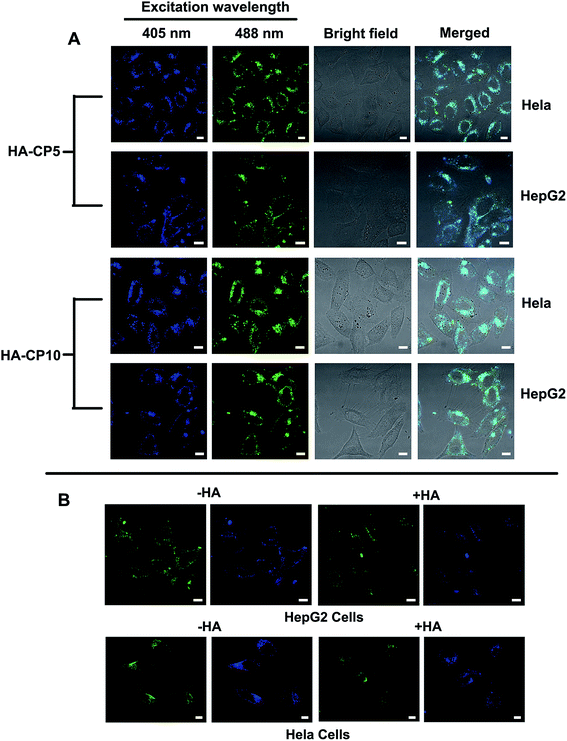
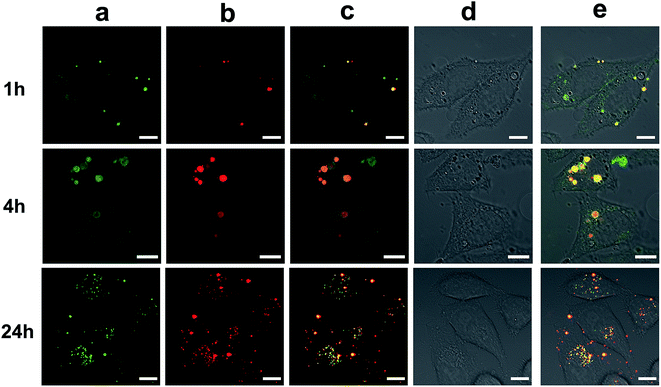
As a type of newly emerged fluorescent nanomaterial, Cds have been widely used in bioimaging, chemical sensing, and biosensing.8 To evaluate the bioimaging ability of the HA-Cds, two selected materials (HA-CP5 and HA-CP10) were first incubated with HeLa and HepG2 cells and then observed by CLSM. As shown in Fig. 8A, bright fluorescence could be found in both cell lines owing to the strong fluorescence emitted from HA-Cds. Under different λex, HA-Cds could stain cells with different colours (blue and green under λex of 405 and 488 nm, respectively). As elucidated from the optical spectra, after MW irradiation, some HA residues remained on the surface of the HA-Cds. Therefore, HA-Cds might have targeting imaging ability with respect to cells overexpressing CD44 (such as HeLa and HepG2 cells).52,53 An HA competition assay was carried out to evaluate the targeting imaging ability of these HA-Cds in HeLa and HepG2 cells. The results shown in Fig. 8B revealed that after preincubation of the cells with free HA, the fluorescence intensity of the HA-Cds decreased in both cell lines. Since the free HA may competitively bind to the receptors on the cell membrane, such a decrease may be reasonable, and it also demonstrated that these HA-Cds have target cell imaging ability.The good fluorescence properties of these Cds could also be utilized to study the gene transfection process.54 The CLSM images of HA-CP10/Cy5-DNA complexes after different transfection times in HeLa cells are shown in Fig. 9. The green signal of HA-CP10 and the red signal of Cy5 overlapped significantly after 1 h transfection, and only the merged yellow signal could be observed. This indicates that almost all Cy5-DNA cargos were co-localized with HA-CP10 vectors. With an increase in the transfection time, stronger fluorescence signals were found and, more importantly, more and more red signals could be observed in the merged image, especially after 24 h transfection (Fig. 9c). Such results suggest that some of the HA-CP10/Cy5-DNA complexes have decomposed and free DNA has been released. It is well known that the dissociation of the vectors/DNA complex is a necessary step for effective gene delivery.55 Consequently, HA-Cds may not only deliver DNA into the cells effectively, but may also act as efficient fluorescence signals, which help us to understand the transfection process and its mechanism.
Conclusions
In summary, a new type of carbon dots was obtained from HA and PEI via MW-assisted preparation with no additives. It was hoped that these materials would combine the good gene transfection efficiency of PEI with the targeting properties and biocompatibility of HA. Meanwhile, the fluorescence properties may also endow these Cd materials with cell imaging ability. Some characterization methods, including FT-IR and NMR, indicated that some characteristic residues of HA and PEI remained in the Cd structure. Subsequent experiments revealed that the elaborately designed Cds exhibited much lower cytotoxicity and higher TE than PEI in HeLa cells. Besides the low toxicity, these materials also show good serum tolerance, and a TE of up to 50 times higher than that of PEI was obtained in the presence of 10% serum. Several assays, including BSA adsorption, flow cytometry, and confocal microscopy, also proved their good transfection performance. Meanwhile, their particular fluorescence properties provide these Cds with cell imaging ability, allowing the DNA transportation process to be monitored. Under different λex, HA-Cds could stain cells green or blue. An HA competition assay showed that these HA-Cds have target cell imaging ability in CD44 overexpressed cells. The materials with fluorescence activity also facilitated co-localization experiments by CLSM, which revealed that the DNA cargo could be effectively released into the cytosol, leading to effective gene transfection.Materials/methods
Materials and methods
All chemicals and reagents were obtained commercially and were used as received. The 1H NMR spectra were measured on a Bruker AM400 NMR spectrometer with D2O as solvent. Fourier transform infrared spectroscopy (FT-IR) was performed on an FTIR Nicolet 380 spectrometer. The composition of the HA-based Cds (HA-Cds) was determined by elemental analysis on an Elementar Vario EL III apparatus. TEM observations were performed on a Tecnai G2 F20 S-TWIN instrument. AFM measurements were carried out with a BRUKER INNOVA instrument. A luciferase assay kit was purchased from Promega (Madison, WI, USA). An endotoxin-free plasmid purification kit was purchased from TIANGEN (Beijing, China). Hyaluronic acid sodium salt (6 kDa) was purchased from Bloomage Freda Biopharm Company Limited (Shandong, China). Branched polyethylenimine (PEI 25 kDa) with molecular weight 25 kDa was purchased from Sigma-Aldrich (St Louis, MO, USA). The plasmids used in the study were pGL-3 (Promega, Madison, WI, USA) coding for luciferase DNA and pEGFP-N1 (Clontech, Palo Alto, CA, USA) coding for EGFP DNA. The Dulbecco's modified Eagle's medium (DMEM), and fetal bovine serum were purchased from Invitrogen Corp. HEK293, HeLa, and HepG2 (liver hepatocellular carcinoma) cell lines were purchased from Shanghai Institute of Biochemistry and Cell Biology, Chinese Academy of Sciences.Some experiments and methods, including cell culture, agarose gel retardation, ethidium bromide (EB) exclusion, quantum yield measurements, and dynamic light scattering (DLS) assays were carried out following previously reported procedures.19,36,42,56
Preparation of HA-based Cds
Briefly, hyaluronic acid sodium salt (250 mg) and branched PEI 25 kDa (250 mg) were dissolved in 50 mL (for HA-CP5) or 100 mL (For HA-CP10–HA-CP50) deionized water in a 250 mL beaker flask. The beaker flask was then placed at the center of the rotating plate of a domestic microwave oven (700 W) and heated for different time intervals. For HA-CP5, the solution was treated for 5 min. For HA-CP10–HA-CP50, the solution was treated for 1, 2, 3, 4, and 5 intervals, respectively (10 min for each interval, and before each interval, water was added to maintain the solution volume at 100 mL). After heating, the yellow solution was dialyzed against 500 mL of HCl (pH 1) for 24 h (MWCO 3500 Da)19 and then against deionized water for another 48 h (MWCO 3500 Da). Finally, the residue was lyophilized to yield powdered materials.Acid–base titration
Briefly, 5 mg HA-Cds was dissolved in 2.5 mL deionized water and then added to 2.5 mL of 300 mM NaCl aqueous solution. HCl (1 N) was added to adjust the pH to 2.0. Aliquots of 0.1 N NaOH were added, and the solution pH was measured with a pH meter (pHS-25) after each addition. The buffering capacity, defined as the percentage of amine groups becoming deprotonated from pH 5.1 to 7.4, was calculated using the following equation:| Buffering capacity (%) = 100[(ΔV1NaOH − ΔV2NaOH) × 0.1 M]/N mol |
ΔV1NaOH is the volume of NaOH solution (0.1 M) required to raise the pH value of the HA-Cd solution from 5.1 to 7.4, ΔV2NaOH is the volume of NaOH solution (0.1 M) required to raise the pH value of the NaCl solution from 5.1 to 7.4, N mol is the total moles of amine groups in the HA-Cds or PEI. For HA-Cds, N = 5 × 10⁻³ WN content/14 (WN content represents the N content of the HA-Cds).
Cytotoxicity assays and toxicity
The toxicity of HA-Cd/DNA complexes was determined with a CellTiter 96®AQueous One Solution Cell Proliferation Assay. About 9000 cells per well were seeded into 96-well plates. After 24 h, the HA-Cds were complexed with 0.2 μg of DNA at various weight ratios for 30 min. The cells were then incubated in a culture medium (100 μL) containing the complexes for 24 h. The solutions were then removed and 100 μL PBS containing 20 μL CellTiter 96®AQueous One Solution Cell Proliferation was added to each well for an additional 1 h incubation at 37 °C. Then, the absorbance of each sample was measured using an ELISA plate reader (model 680, BioRad) at a wavelength of 490 nm. The cell survival was expressed as follows: cell viability = (ODtreated/ODcontrol) × 100%. Besides, the cell viability of 25 kDa PEI was also determined.Transfection procedure
The gene transfection of a series of complexes was investigated in HeLa cells and HEK293 cells. Cells were seeded in 24-well plates (1.05 × 10⁵ cells per well) and grown to reach 70–80% cell confluence at 37 °C for 24 h in 5% CO2. Before transfection, the medium was replaced with a serum-free or a 10% serum-containing culture medium containing HA-Cds/pDNA (0.8 μg) complexes at various weight ratios. After 4 h under standard incubator conditions, the medium was replaced with fresh medium containing serum and incubated for another 20 h.For fluorescence microscopy assays, cells were transfected by complexes containing pEGFP-N1. After 24 h incubation, GFP-expressed cells were observed with an inverted fluorescence microscope (Nikon Eclipse TE 2000E) equipped with a cold Nikon camera.
For luciferase assays, cells were transfected by complexes containing pGL-3. For a typical assay in a 24-well plate, 24 h post transfection as described above, cells were washed with cold PBS and lysed with 100 μL 1× lysis reporter buffer (Promega). The luciferase activity was measured with a microplate reader (Model 550, BioRad, USA). The protein content of the lysed cell was determined by BCA protein assay. The TE was expressed as the relative fluorescence intensity per mg protein (RLU per mg protein). All the experiments were done in triplicate.
Protein adsorption assay
In brief, 1 mL of HA-Cd solution (1 mg mL−1) was mixed with 1 mL of bovine serum albumin solution (2 mg mL−1). After shaking for 0.5 h at 37 °C and centrifuging at full-speed, the supernatant was carefully collected. The concentration of BSA in the supernatant was determined by BCA protein assay. The protein adsorbed on the polyplexes was calculated using the following equation:| q = (Ci − Cs) × V/m |
Inhibition studies
To probe the internalization mechanism of the HA-Cd/DNA complexes, the cellular uptake study was performed at 4 °C or in the presence of various endocytic inhibitors with a serum-free or a 10% serum-containing medium. Briefly, cells were incubated with complexes at 4 °C for 4 h, wherein the energy-dependent endocytosis was blocked. Otherwise, cells were preincubated with various endocytic inhibitors including cytochalasin D (10 mg mL−1), wortmannin (50 nM), genistein (200 μM), nocodazole (33 μM), and chlorpromazine (10 μg mL−1). Following pretreatment for 30 min, the inhibitor solutions were replaced by the freshly prepared test complexes (Cy5-labeled plasmid DNA) in media containing inhibitors at the same concentrations. After further incubation for 4 h, cells were harvested and analyzed by flow cytometry. In the study, the groups in the presence of test complexes at 37 °C but without inhibitor treatment were used as controls. The results were represented as percentage uptake levels of control cells.Cellular uptake of plasmid DNA (flow cytometry)
The cellular uptake of the HA-Cd/Cy5-labeled DNA complexes was analyzed by flow cytometry. A Label IT Cy5 Labeling Kit was used to label pDNA according to the manufacturer's protocol. Briefly, HeLa cells were seeded in 12-well plates (2.0 × 10⁵ cells per well) and allowed to attach and grow for 24 h. The medium was exchanged with serum-free or serum-containing medium. Cells were incubated with complexes containing Cy5-labeled DNA (2 μg of DNA per well, optimal weight ratio of each sample) in media for 4 h at 37 °C. Subsequently, the cells were washed with 1× PBS and harvested with 0.25% trypsin/EDTA and resuspended in 1× PBS. The mean fluorescence intensity was analyzed using a flow cytometer (Becton Dickinson and Company). The Cy5-labeled plasmid DNA uptake was measured in the FL4 channel using the red diode laser (633 nm).Confocal laser scanning microscopy (CLSM) analysis
HeLa cells or HepG2 cells were seeded in a 35 mm confocal dish (Φ = 15 mm) at a density of 2 × 10⁴ cells per well. After 24 h under standard incubation conditions, the medium was exchanged with serum-containing medium. For the internalization assay, cells were incubated with HA-Cds or PEI/Cy5-labeled pGL-3 (1.6 μg of DNA per well, w/w = 10) complexes in media for 1 h and 4 h at 37 °C. For the cellular trafficking assay, cells were incubated with HA-Cd/Cy5-labeled pGL-3 (1.6 μg of DNA per well, w/w = 10) complexes in media for 1 h, 4 h, and 24 h at 37 °C. For the HA competition assay, cells were firstly incubated with HA (1 mg) for 2 h then further incubated with HA-Cds for another 4 h. Finally, cells were rinsed twice with PBS (pH 7.4) and fixed with 4% paraformaldehyde for 10 min. The CLSM observation was performed using a Leica TCS SP5 instrument at excitation wavelengths of 405 nm and 488 nm for HA-Cds and 633 nm for Cy5 (red).Acknowledgements
This work was financially supported by the National Natural Science Foundation of China (Nos. 21672155, 21472131, 21232005). We also thank the Analytical & Testing Center of Sichuan University for the TEM analysis.References
- M. Morille, C. Passirani, A. Vonarbourg, A. Clavreul and J.-P. Benoit, Biomaterials, 2008, 29, 3477–3496 CrossRef CAS PubMed.
- H. Jin, A. Kanthasamy, A. Ghosh, V. Anantharam, B. Kalyanaraman and A. G. Kanthasamy, Biochim. Biophys. Acta, Mol. Basis Dis., 2014, 1842, 1282–1294 CrossRef CAS PubMed.
- O. Sankoh, S. Arthur, B. Nyide and M. Weston, HIV AIDS Rev., 2015, 14, 1–8 CrossRef.
- H. Zhang, H. Wu, J. Wang, Y. Yang, D. Wu, Y. Zhang, Y. Zhang, Z. Zhou and S. Yang, Biomaterials, 2015, 42, 66–77 CrossRef CAS PubMed.
- R. Srinivas, S. Samanta and A. Chaudhuri, Chem. Soc. Rev., 2009, 38, 3326–3338 RSC.
- C. H. Jones, C.-K. Chen, A. Ravikrishnan, S. Rane and B. A. Pfeifer, Mol. Pharm., 2013, 10, 4082–4098 CrossRef CAS PubMed.
- L. Li, S. Puhl, L. Meinel and O. Germershaus, Biomaterials, 2014, 35, 7929–7939 CrossRef CAS PubMed.
- S. Y. Lim, W. Shen and Z. Gao, Chem. Soc. Rev., 2015, 44, 362–381 RSC.
- Q. Xu, T. Kuang, Y. Liu, L. Cai, X. Peng, T. S. Sreeprasad, P. Zhao, Z. Yu and N. Li, J. Mater. Chem. B, 2016, 4, 7204–7219 RSC.
- H. Ding, F. Du, P. Liu, Z. Chen and J. Shen, ACS Appl. Mater. Interfaces, 2015, 7, 6889–6897 CAS.
- Y. Liu, Y. Liu, S.-J. Park, Y. Zhang, T. Kim, S. Chae, M. Park and H.-Y. Kim, J. Mater. Chem. A, 2015, 3, 17747–17754 CAS.
- H. He, X. Wang, Z. Feng, T. Cheng, X. Sun, Y. Sun, Y. Xia, S. Wang, J. Wang and X. Zhang, J. Mater. Chem. B, 2015, 3, 4786–4789 RSC.
- Y. Guo, Z. Wang, H. Shao and X. Jiang, Carbon, 2013, 52, 583–589 CrossRef CAS.
- H. Wu, C. Mi, H. Huang, B. Han, J. Li and S. Xu, J. Lumin., 2012, 132, 1603–1607 CrossRef CAS.
- Z.-C. Yang, M. Wang, A. M. Yong, S. Y. Wong, X.-H. Zhang, H. Tan, A. Y. Chang, X. Li and J. Wang, Chem. Commun., 2011, 47, 11615–11617 RSC.
- Y. Hu, J. Yang, L. Jia and J.-S. Yu, Carbon, 2015, 93, 999–1007 CrossRef CAS.
- C. Liu, P. Zhang, X. Zhai, F. Tian, W. Li, J. Yang, Y. Liu, H. Wang, W. Wang and W. Liu, Biomaterials, 2012, 33, 3604–3613 CrossRef CAS PubMed.
- L. Wang, X. Wang, A. Bhirde, J. Cao, Y. Zeng, X. Huang, Y. Sun, G. Liu and X. Chen, Adv. Healthcare Mater., 2014, 3, 1203–1209 CrossRef CAS PubMed.
- P. Pierrat, R. Wang, D. Kereselidze, M. Lux, P. Didier, A. Kichler, F. Pons and L. Lebeau, Biomaterials, 2015, 51, 290–302 CrossRef CAS PubMed.
- X. Zhai, W. Wang, C. Wang, Q. Wang and W. Liu, J. Mater. Chem., 2012, 22, 23576–23586 RSC.
- J. Sun, F. Zeng, H. Jian and S. Wu, Polym. Chem., 2013, 4, 5810–5818 RSC.
- K.-M. Xiu, N.-N. Zhao, W.-T. Yang and F.-J. Xu, Acta Biomater., 2013, 9, 7439–7448 CrossRef CAS PubMed.
- W. Wang, X. Ji, A. Kapur, C. Zhang and H. Mattoussi, J. Am. Chem. Soc., 2015, 137, 14158–14172 CrossRef CAS PubMed.
- H. Tian, Z. Guo, L. Lin, Z. Jiao, J. Chen, S. Gao, X. Zhu and X. Chen, J. Controlled Release, 2014, 174, 117–125 CrossRef CAS PubMed.
- L. Jin, X. Zeng, M. Liu, Y. Deng and N. He, Theranostics, 2014, 4, 240–255 CrossRef PubMed.
- J. G. Piao, S. G. Ding, L. Yang, C. Y. Hong and Y. Z. You, Biomacromolecules, 2014, 15, 2907–2913 CrossRef CAS PubMed.
- M. H. Ramadan, J. E. Prata, O. Karacsony, G. Duner and N. R. Washburn, Langmuir, 2014, 30, 7485–7495 CrossRef CAS PubMed.
- H. Y. Yoon, H. R. Kim, G. Saravanakumar, R. Heo, S. Y. Chae, W. Um, K. Kim, I. C. Kwon, J. Y. Lee, D. S. Lee, J. C. Park and J. H. Park, J. Controlled Release, 2013, 172, 653–661 CrossRef CAS PubMed.
- Y. He, G. Cheng, L. Xie, Y. Nie, B. He and Z. Gu, Biomaterials, 2013, 34, 1235–1245 CrossRef CAS PubMed.
- H. Tian, L. Lin, J. Chen, X. Chen, T. G. Park and A. Maruyama, J. Controlled Release, 2011, 155, 47–53 CrossRef CAS PubMed.
- J. H. Park, H. J. Cho, H. Y. Yoon, I. S. Yoon, S. H. Ko, J. S. Shim, J. H. Cho, J. H. Park, K. Kim, I. C. Kwon and D. D. Kim, J. Controlled Release, 2014, 174, 98–108 CrossRef CAS PubMed.
- V. N. Mehta, S. Jha, H. Basu, R. K. Singhal and S. K. Kailasa, Sens. Actuators, B, 2015, 213, 434–443 CrossRef CAS.
- A. Dehshahri, R. K. Oskuee, W. T. Shier, A. Hatefi and M. Ramezani, Biomaterials, 2009, 30, 4187–4194 CrossRef CAS PubMed.
- S. Zhang, H. Gao and G. Bao, ACS Nano, 2015, 9, 8655–8671 CrossRef CAS PubMed.
- Y. Liu and T. M. Reineke, J. Am. Chem. Soc., 2005, 127, 3004–3015 CrossRef CAS PubMed.
- Y. Zhou, B. Yang, X. Ren, Z. Liu, Z. Deng, L. Chen, Y. Deng, L.-M. Zhang and L. Yang, Biomaterials, 2012, 33, 4731–4740 CrossRef CAS PubMed.
- Q.-F. Zhang, Q.-Y. Yu, Y. Geng, J. Zhang, W.-X. Wu, G. Wang, Z. Gu and X.-Q. Yu, ACS Appl. Mater. Interfaces, 2014, 6, 15733–15742 CAS.
- H. Gao, W. Shi and L. B. Freund, Proc. Natl. Acad. Sci. U. S. A., 2005, 102, 9469–9474 CrossRef CAS PubMed.
- C. He, Y. Hu, L. Yin, C. Tang and C. Yin, Biomaterials, 2010, 31, 3657–3666 CrossRef CAS PubMed.
- Q. Guo, Y.-H. Liu, M.-M. Xun, J. Zhang, Z. Huang, X.-D. Zhou and X.-Q. Yu, J. Mater. Chem. B, 2015, 3, 2660–2670 RSC.
- W.-J. Yi, Q.-F. Zhang, J. Zhang, Q. Liu, L. Ren, Q.-M. Chen, L. Guo and X.-Q. Yu, Acta Biomater., 2014, 10, 1412–1422 CrossRef CAS PubMed.
- Q.-F. Zhang, W.-J. Yi, B. Wang, J. Zhang, L. Ren, Q.-M. Chen, L. Guo and X.-Q. Yu, Biomaterials, 2013, 34, 5391–5401 CrossRef CAS PubMed.
- J. Ge, Q. Jia, W. Liu, L. Guo, Q. Liu, M. Lan, H. Zhang, X. Meng and P. Wang, Adv. Mater., 2015, 27, 4169–4177 CrossRef CAS PubMed.
- J. Zhang, Z. Wang, W. Lin and S. Chen, Biomaterials, 2014, 35, 7909–7918 CrossRef CAS PubMed.
- B. Wang, C. He, C. Tang and C. Yin, Biomaterials, 2011, 32, 4630–4638 CrossRef CAS PubMed.
- S. D. Conner and S. L. Schmid, Nature, 2003, 422, 37–44 CrossRef CAS PubMed.
- S.-F. Peng, M. T. Tseng, Y.-C. Ho, M.-C. Wei, Z.-X. Liao and H.-W. Sung, Biomaterials, 2011, 32, 239–248 CrossRef CAS PubMed.
- N. Araki, M. T. Johnson and J. A. Swanson, J. Cell Biol., 1996, 135, 1249–1260 CrossRef CAS PubMed.
- O. P. Perumal, R. Inapagolla, S. Kannan and R. M. Kannan, Biomaterials, 2008, 29, 3469–3476 CrossRef CAS PubMed.
- K. L. Douglas, Biotechnol. Prog., 2008, 24, 871–883 CAS.
- C. Y. M. Hsu and H. Uludağ, Biomaterials, 2012, 33, 7834–7848 CrossRef CAS PubMed.
- H. Wu, H. Shi, Y. Wang, X. Jia, C. Tang, J. Zhang and S. Yang, Carbon, 2014, 69, 379–389 CrossRef CAS.
- E. Song, W. Han, C. Li, D. Cheng, L. Li, L. Liu, G. Zhu, Y. Song and W. Tan, ACS Appl. Mater. Interfaces, 2014, 6, 11882–11890 CAS.
- J. Kim, J. Park, H. Kim, K. Singha and W. J. Kim, Biomaterials, 2013, 34, 7168–7180 CrossRef CAS PubMed.
- A. Barnard, P. Posocco, S. Pricl, M. Calderon, R. Haag, M. E. Hwang, V. W. Shum, D. W. Pack and D. K. Smith, J. Am. Chem. Soc., 2011, 133, 20288–20300 CrossRef CAS PubMed.
- Y. Huang, X. Yang, T. Xu, Q. Kong, Y. Zhang, Y. Shen, Y. Wei, G. Wang and K. J. Chang, Int. J. Oncol., 2016, 49, 153–163 CAS.
Footnote |
| † Electronic supplementary information (ESI) available: Supplemental figures and compounds characterization. See DOI: 10.1039/c7ra01417a |
| This journal is © The Royal Society of Chemistry 2017 |

