 Open Access Article
Creative Commons Attribution 3.0 Unported Licence
Tunable luminescence and energy transfer properties of Bi3+ and Mn4+ co-doped Ca14Al10Zn6O35 phosphors for agricultural applications†
Li Lia,
Yuexiao Pan *ac,
Zhen Chena,
Shaoming Huanga and
Mingmei Wu*b
aKey Laboratory of Carbon Materials of Zhejiang Province, College of Chemistry and Materials Engineering, Wenzhou University, Wenzhou 325035, P. R. China. E-mail: yxpan8@gmail.com; Fax: +86-577-8837-3017; Tel: +86-577-8837-3017
bMOE Key Laboratory of Bioinorganic and Synthetic Chemistry, School of Chemistry and Chemical Engineering, Sun Yat-Sen University, Guangzhou 510275, P. R. China. E-mail: ceswmm@mail.sysu.edu.cn; Tel: +86-20-84111823
cKey Laboratory of Optoelectronic Materials Chemistry and Physics, Chinese Academy of Sciences, Fuzhou, Fujian 350002, China
First published on 6th March 2017
Abstract
A series of Bi3+ and Mn4+ co-activated Ca14Al10Zn6O35 (CAZO) phosphors were synthesized using a solid state sintering method. The phase and morphologies of the CAZO based phosphors were confirmed using powder X-ray diffraction (XRD) and scanning electron microscopy (SEM), respectively. A novel phosphor CAZO:Bi3+ emits bright blue light under near-ultraviolet (NUV) excitation and its luminescence properties were characterized by diffuse reflectance and photoluminescence spectra. Tunable luminescence from blue to red was observed in Bi3+ and Mn4+ co-activated CAZO, which is attributed to energy transfer from Bi3+ to Mn4+. The energy transfer mechanism has been characterized by the decay times of the Bi3+ emission, which changes with the concentration of Mn4+. The energy transfer efficiency from Bi3+ to Mn4+ increases linearly with increasing the concentration of Mn4+. The as-obtained phosphor has a potential application in agricultural industry because the blue and red lights excited by NUV light emitting diodes (LEDs) are helpful for the improvement of photosynthesis.
1. Introduction
Artificial lighting in which the wavelengths of the output lighting can be controlled so that they match well with the absorption wavelengths of plant photoreceptors has drawn considerable attention because it can be used to increase crop yield and to tune the plant growth process in phytotrons and greenhouses. Blue light with wavelengths of 400–500 nm and red light with wavelengths of 600–720 nm are indispensable for plant growth because they match the absorption wavelengths of carotenoids and chlorophyll, and improve the photosynthesis of plants.1,2 LEDs are attracting much interest due to their energy saving properties and long serving time. Artificial lighting produced by a blue LED and a red LED suffers disadvantages, such as the need for separately driven power supplies, mismatch of the spectral distributions, and color changing with the input power.3,4Luminescence materials free of rare earth ion doping are currently an active research area for potential applications in photoelectronic fields due to the lower cost of the raw materials compared to that of rare earth elements. The transition metal ions Bi3+ and Mn4+ exhibit outstanding optical properties in inorganic solid state crystal lattices, which are attributed to their intrinsic multiple energy levels. The phosphor LuVO4:Bi3+ emits efficient yellow emission and is restored to its initial state after eleven rounds of thermal expansion and contraction while the phosphor ScVO4:Bi3+ emits strong red-orange light and cannot be restored.5 (Y,Sc)(Nb,V)O4:Bi3+ exhibits tunable emission spanning from about 450 nm (blue) to 647 nm (orange-red) via adjustment of the cations in the host lattice.6 The phosphor ZnWO4: Bi3+,Eu3+ emits green light with an emission peak at 560 nm and the quenching concentration of Bi3+ was greatly increased by energy transfer from Bi3+ to Eu3+.7 The Bi3+-doped gadolinium tungstate phosphor emits visible radiation from the blue to red regions and an intense near-infrared (NIR) photon centered at 976 nm has been obtained through a quantum-cutting (QC) phenomenon by codoping with Yb3+ ions.8 Mn4+ activated inorganic phosphors, such as fluorides,9–11 germinates12,13 and aluminates,14–17 show potential in the improvement of the color rendition of white LEDs due to their broad and strong absorption in the blue region which matches well with the electroluminescence of blue LED chips. They can produce highly efficient red emission to compensate the red components in the spectrum of the YAG:Ce-GaN type white LED.
Recently, several phosphors based on the host lattice CAZO have been identified as good candidates in various photoelectricity applications with high luminescence efficiency, chemically and physically stable characteristics, ease of synthesis, and low cost of raw materials.16–20 Even though the luminescent properties of rare earth ions and Mn4+ in the host lattice CAZO have been extensively studied, blue emission luminescence from Bi3+ in CAZO has not been observed. It is worth investigating the efficient energy transfer between the two transition metal ions Bi3+ and Mn4+ owing to the energy match between the 3P1 (Bi3+) and 2E (Mn4+) levels.
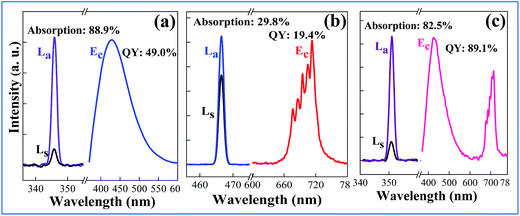
In this work, we report the observation of strong blue emission in a novel phosphor CAZO:Bi3+. Moreover, a phosphor CAZO:Bi3+,Mn4+ has been achieved and its emission color can be easily tuned by controlling the relative intensity ratio of the blue emission from Bi3+ and the red emission from Mn4+. The optimized internal quantum yield (QY) of the phosphor is as high as 89.1%, which is due to the efficient energy transfer from Bi3+ to Mn4+.
2. Experimental
2.1 Synthesis of the phosphors CAZO:Bi3+ and CAZO:Bi3+,Mn4+
A series of powder samples were synthesized using a solid state reaction technique at high temperature. The solid state reagents CaCO3 (A.R.), Al2O3 (A.R.), ZnO (A.R.), Bi2O3 (A.R.) and MnCO3 (A.R.) were used as starting materials and weighed according to the stoichiometic compositions of the compounds Ca14−x%Al10Zn6O35:x% Bi3+ (x = 0.05, 0.1, 0.5, 1, 2, 3, 4 or 5) and Ca13.995Al10–x%Zn6O35:0.5% Bi3+,x% Mn4+ (x = 0.05, 0.1, 0.2, 0.25, 0.3, 0.35, 0.45, 0.5 or 1). The starting materials were mixed thoroughly by grinding in an agate mortar for 30 min. The powder mixtures were first sintered at 700 °C for 5 h and then sintered at 1150 °C for 5 h in air. After having cooled down to room temperature in the furnace, the samples were ground into powders for further measurement.2.2 Characterization
The phase formation and crystal structure determination of the products were identified using a Bruker (Karlsruhe, Germany) D8 Advance X-ray powder diffractometer (XRD) with graphite monochromatized Cu Kα radiation (λ = 0.15418 nm). The XRD data were collected in the range of 10–80°. The morphology and structure of the samples were studied using field emission scanning electron microscopy (FE-SEM) on a Nova NanoSEM 200 scanning electron microscope. UV-vis diffuse reflectance spectra were measured using a Shimadzu UV-3600 spectrometer. Photoluminescence (PL) spectra were recorded using a FluoroMax-4 spectrofluorometer (Horiba Jobin Yvon Inc.) with a 150 W xenon lamp with a heating attachment. The internal QY was measured using an integrating sphere coated with barium sulfate.3. Results and discussion
3.1 Crystal structure and morphologies
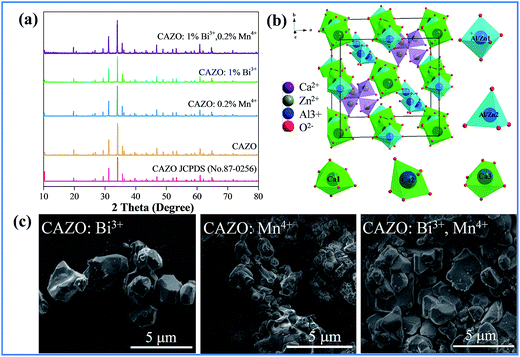
The XRD patterns of the as-prepared samples of CAZO, CAZO:0.2% Mn4+, CAZO:1% Bi3+ and CAZO:0.2% Mn4+,1% Bi3+ were obtained to verify the phase purity. As shown in Fig. 1a, all of the peaks of undoped CAZO and the phosphors match well with the standard data of CAZO in the Joint Committee on Powder Diffraction Standards (JCPDS) file No. 50-0426. The sharp crystalline features observed in the XRD profiles indicate that micrometer particles with good crystallinity were obtained using the solid state synthesis method. The introduction of Bi3+ and Mn4+ does not cause significant changes in the crystal structure of the host lattice, which illustrates that Bi3+ and Mn4+ have been effectively built into the host lattice in the form of a solid solution.Fig. 1b displays a partial structural overview of CAZO and the coordination environment of the cation sites in CAZO. In the crystal lattice of CAZO, four fifths of the positions occupied by Al and Zn are in a tetrahedral coordination, and the one fifth dependent position is in an octahedral coordination. In this structure, Ca2+ has three different coordination environments.16,19 Two of them are in a six-coordinated octahedron, and the third one is in a seven-coordinated polyhedron. On the basis of the effective ionic radii with different coordination numbers, Bi3+ (r = 0.117 nm) ions are expected to randomly occupy the six- and seven-coordinated Ca2+ (r = 0.114 nm; r = 0.120 nm) sites, and Mn4+ (r = 0.067 nm) ions are preferentially accommodated at the Al3+ (r = 0.067 nm) sites in the centers of the octahedron coordinated by the O2− ions in the crystal structure.16,19 To keep the electroneutrality of the compound, excess O2− ions may form for charge compensation. Fig. 1c presents typical SEM images of the CAZO:0.5% Bi3+, CAZO:0.2% Mn4+ and CAZO:0.5% Bi3+,0.2% Mn4+ samples; the morphologies of the samples exhibit aggregations and irregularity, and the diameters are observed to range from sub-micrometer to a few micrometers.
3.2 Photoluminescence of the blue phosphor CAZO:Bi3+
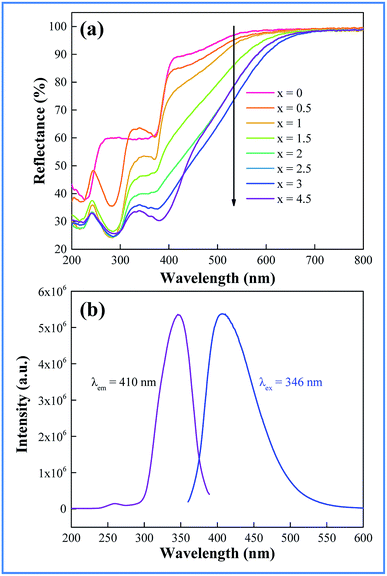
The light absorption capability of the as-prepared samples of CAZO:Bi3+ has been evaluated using the reflectance from BaSO4 as a reference. The UV-vis diffuse reflectance spectra of CAZO:Bi3+ with various concentrations of Bi3+ are shown in Fig. 2a. For all of the samples, two absorption bands peaking at 290 and 380 nm in the UV-visible region are observed, which are attributable to the 1S0–1P1 and 1S0–3P1 transitions of Bi3+, respectively. With increasing the concentration of the Bi3+ ions, the absorption is intensified and the band edge extends to the longer wavelength, which yields the daylight color of powder samples ranging from white to pale brown.Fig. 2b shows the emission and excitation spectra of the as-synthesized Bi3+ ion singly doped CAZO phosphor. The excitation spectrum of CAZO:Bi3+ monitored at 410 nm consists of two bands with a maximum at 346 nm, which matches well with the electroluminescence wavelength of NUV chips for agricultural applications. Although LED chips with wavelengths at about 346 nm are not currently dominant, they are commercially available, so it is significant to develop a phosphor upon this excitation wavelength especially free of rare earth elements. The weak absorption band at 260 nm and the strong one at 346 nm are ascribed to the parity-allowed transitions 1S0–1P1 and 1S0–3P1 of Bi3+, respectively.21 The emission spectrum of CAZO:Bi3+ exhibits an intense and broad band in the region of 400–600 nm peaking at 410 nm with a full width of half-maximum (FWHM) around 86 nm, which is assigned to the 3P1–1S0 transition of Bi3+ ions.
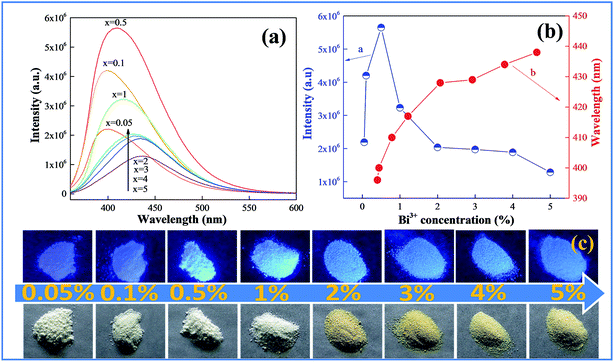
Fig. 3 shows the emission spectra and color of the samples of CAZO:x% Bi3+ (x = 0.05, 0.1, 0.5, 1, 2, 3, 4 or 5) changing with the Bi3+ concentration. As shown in Fig. 3a, all of the emission spectra of CAZO:Bi3+ demonstrate broadening spectral profiles, and the emission bands of Bi3+ give an evident red-shift. We can see from Fig. 3b that the emission bands of Bi3+ shift from 396 to 436 nm as the Bi3+ concentration increases from 0.05 to 5 mol%. The red shift may result from two reasons: (i) the change of the CAZO crystal field by substitution of Ca2+ with Bi3+ due to the small difference in the two ionic radii, which results in the increasing of the crystal field strength around Bi3+and the splitting of the 3d energy level of Bi3+;22–24 (ii) the increase of the energy transfer probability between Bi3+ ions which reduces the high-energy portion in the whole emission profile, and then lowers the overall energy as represented by the red shift.25 It can be observed that the emission intensity of the Bi3+ ions increases with increasing doping concentration, reaches a maximum at x = 0.5, and then decreases sharply when the Bi3+ concentration is higher than 0.5 mol% due to concentration quenching. The highest photoluminescence intensity was achieved at x = 0.5. The corresponding photographs of the samples with varied concentration of Bi3+ ions are shown in Fig. 3c. The daylight color of the samples changes from white to pale brown with an increase of the Bi3+ concentration, which is consistent with the results of the UV-vis diffuse reflection spectra. The samples with low Bi3+ concentrations (x = 0.05 and 0.1) show purple-blue and those with high Bi3+ concentrations (x ≧ 0.5) emit blue light upon excitation by a UV lamp.
3.3 Tunable luminescence of the Bi3+ and Mn4+ co-doped CAZO phosphor via energy transfer
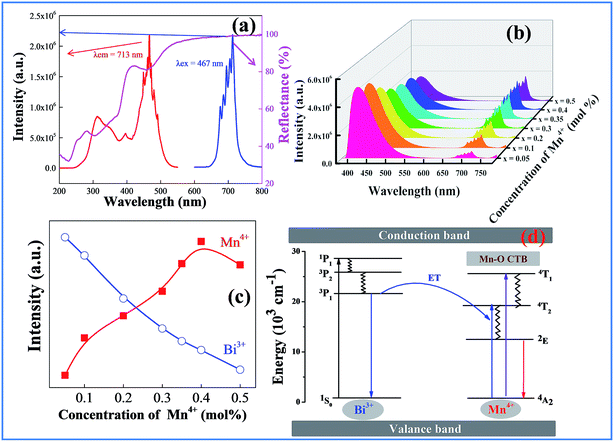
Fig. 4a shows the luminescence and UV-vis diffuse reflection spectra of CAZO:Mn4+. As expected for substitution of Al3+ with Mn4+ in an oxide host CAZO, the d–d transition of Mn4+ within its 3d3 electron configuration produces red light at about 690 nm. As shown in Fig. 4a, the emission band of CAZO:Mn4+ with a group of sharp peaks is attributed to transitions between the vibronic levels of 2E and 4A2 of Mn4+. The excitation spectra exhibit two typical absorption bands at 314 and 467 nm, which are attributed to the 4A2–4T1 and 4A2–4T2 transitions of the Mn4+ ion in the octahedral coordination, respectively. The white powder CAZO:Mn4+ has a reflectance of about 90% in the visible region and exhibits two absorption bands in the NUV region and blue regions in the diffuse reflection spectra of CAZO:Mn4+, which is consistent with its excitation spectra.A strong and broad absorption band of CAZO:Mn4+ in the blue range overlaps with the emission of CAZO:Bi3+, which provides the possibility for energy transfer from Bi3+ to Mn4+ ions in the host lattice CAZO. To confirm the phenomenon of energy transfer from the Bi3+ to Mn4+ ions, a series of Bi3+ and Mn4+ co-doped CAZO samples were prepared. Fig. S1† shows the excitation spectra of the phosphor CAZO:1% Bi3+,0.5% Mn4+ monitored at 417 nm and 712 nm. The band at 346 nm in the excitation spectrum monitored at 417 nm is attributed to the 1S0–3P1 transition of Bi3+ as observed in the excitation spectrum of Bi3+ singly doped CAZO. In the excitation spectrum monitored at 712 nm, the band between 250 and 400 nm is jointly originated from the 1S0–3P1 transition of Bi3+ and the 4A2–4T1 transition of Mn4+. The strong absorption band in the range of 400–500 nm is attributed to the 4A2–4T2 transition of Mn4+, which is overlapping with the emission of Bi3+. Fig. 4b illustrates the emission spectra of the typical samples of CAZO:0.5% Bi3+,x% Mn4+ (x = 0.05, 0.1, 0.2, 0.3, 0.35, 0.4 or 0.5) excited at 351 nm. It is found that both blue light from Bi3+ and red light from Mn4+ are produced in all of the Bi3+ and Mn4+ co-doped CAZO samples. The emission band from 400 nm to 550 nm with a maximum at 410 nm is ascribed to the 3P1–1S0 transition of Bi3+ ions while that from 650 nm to 750 nm is ascribed to the 2E–4A2 emission of Mn4+ ions. Fig. S2† shows that the red emission of CAZO:0.5% Bi3+,0.5% Mn4+ matches well with the absorption of chlorophy II A and the blue emission overlaps with the absorption of both chlorophy II A and chlorophy II B, which indicates the potential application of the phosphor in artificial lighting. Furthermore, as shown in Fig. 4c, the intensity of the blue emission decreases and that of the red emission increases with increasing the Mn4+ concentration, which is indicative of the occurrence of energy transfer between Bi3+–Mn4+. The red emission intensity arrives at a maximum at x = 0.4 due to concentration quenching. Thanks to the variation of the emission spectra of the CAZO:Bi3+,Mn4+ phosphors with varying Mn4+ concentration, the emission color can be tuned via changing the Bi3+/Mn4+ ratio.
The schematic energy level diagram for the electronic transitions and the energy transfer process in Bi3+ and Mn4+ co-doped CAZO are shown in Fig. 4d. Under excitation at 351 nm, the Bi3+ ions are initially excited from the ground state 1S0 to the excited state 3P1. Some of the Bi3+ ions return to the ground state 1S0 through radiative transition and yield blue emission. The other Bi3+ ions at the 3P1 state transfer their energy to the adjacent Mn4+ ions and promote Mn4+ ions from the ground state 4A2 to the excited state 4T2 as follows:
| Bi3+ (3P1) + Mn4+ (4A2) → Bi3+ (1S0) + Mn4+ (4T2) | (1) |
The Mn4+ ions in the 4T2 state relax to the 2E level through a non-radiative transition and then produce red emission when they return to the ground state 4A2.
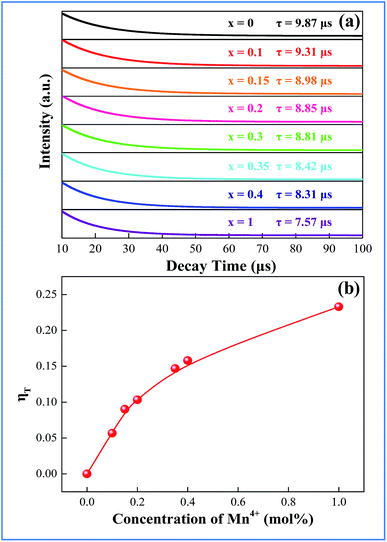
In order to better understand the energy-transfer sensitization mechanism, the luminescence decay times of the 410 nm emission of Bi3+ in the CAZO:0.5% Bi3+,x% Mn4+ (x = 0.05–0.5) phosphors have been measured with excitation at 346 nm as shown in Fig. 5. All of the decay curves can be fitted using a single-exponential decay:
It = I0![[thin space (1/6-em)]](https://www.rsc.org/images/entities/char_2009.gif) exp(−t/τ) exp(−t/τ)
| (2) |
The lifetime of Bi3+ decreases from 9.31 to 7.57 μs when the Mn4+ content is increased from 0.10 to 1.0 mol%, which is indicative of the increasing non-radiative energy transfer rate. The non-radiative energy transfer of Bi3+ ions changing with Mn4+ content may be mainly ascribed to the energy transfer from Bi3+ to Mn4+. Generally, in oxide phosphors, the exchange interaction or multipole–multipole interaction comes into effect only when the distance between the sensitizer and activator is shorter than 5.0 Å.26 The critical distance among the Bi3+ and Mn4+ ions can be calculated using the following equation:27
| Rc ≈ 2[3V/4πxcN]1/3 | (3) |
 | (4) |
On the basis of Dexter’s energy transfer formula of multipolar interactions, the following relationship can be given:27–29
 | (5) |
 | (6) |
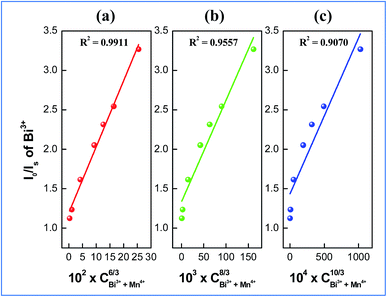
 and CBi3++Mn4+n/3 (n = 6, 8 or 10) are shown in Fig. 6. It could be easily observed that a good linear behavior occurs only when n = 6; it shows a best linear relation with goodness of fit of R2 = 0.9911, implying that the energy transfer from Bi3+ to Mn4+ occurs predominantly via a dipole–dipole interaction mechanism.
3.4 Improvement of the total internal QY of the phosphor due to the energy transfer from Bi3+ to Mn4+ ions
The QY is a key parameter to evaluate a luminescence material. It is defined as the ratio of emitted photons to absorbed ones. As shown in Fig. 7, the excitation lines and emission spectra of CAZO:Bi3+, CAZO:Mn4+ and CAZO:Bi3+,Mn4+ were measured using an integrating sphere coated with BaSO4. The absorbance of the phosphor was calculated according to the following eqn (7):22,30,31
 | (7) |
 | (8) |
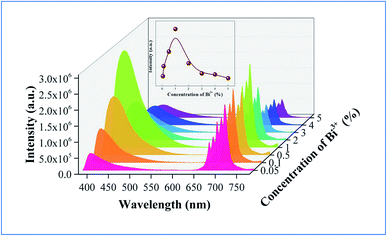
In order to explain the phenomenon that the QY of CAZO:Bi3+,Mn4+ is much higher than any of the Bi3+ or Mn4+ singly doped samples, a series of samples CAZO:x% Bi3+,0.5% Mn4+(x = 0.05, 0.1, 0.5, 1, 2, 3, 4 or 5) were investigated and their emission spectra under excitation at 351 nm are shown in Fig. 8. The total luminescence intensities from both Bi3+ and Mn4+ are varying with the concentration of Bi3+ ion as shown in Fig. 4c and the insert of Fig. 8. To obtain the highest luminescence intensity, the optimum concentration of Bi3+ in CAZO:Bi3+ is 0.5 mol% (Fig. 3b) while that in CAZO:Bi3+,Mn4+ is 1.0 mol%, which signifies the increased concentration of luminescence centers in Bi3+ and Mn4+ co-doped samples. The doping concentration of Bi3+ is increased by two times due to the energy transfer from Bi3+ to Mn4+ and decreased non-radiative transitions between the Bi3+ donors.7 Thus, the total internal QY of the Bi3+ and Mn4+ co-doped phosphor is increased obviously by the increased radiative emissions from both Bi3+ and Mn4+.
4. Conclusion
In summary, a novel blue-emitting phosphor CAZO:Bi3+ was prepared using a solid state method. The phosphor CAZO:Bi3+ exhibits a broad blue emission peak with a maximum at 467 nm that originates from the 3P1–1S0 transition of Bi3+. The emission intensities and lifetime values of the Bi3+ emission of the phosphors CAZO:Bi3+,Mn4+ decrease linearly with increasing concentration of Mn4+, which strongly verified that an effective energy transfer occurred from Bi3+ to Mn4+ in the CAZO host. The efficiency of energy transfer between Bi3+ and Mn4+ is about 23.7%. The internal QY of CAZO:Bi3+,Mn4+ is as high as 89.1% due to increasing of the optimum concentration of Bi3+ ions. The as-synthesized color-tunable phosphors have potential applications in NUV white LEDs in agricultural industry.Acknowledgements
This research was jointly supported by the National Natural Science Foundation of China (51572200, 51102185, U1301242) and Zhejiang Province (Y16E020041), Public Industrial Technology Research Projects of Zhejiang Province (2015C31142), Research Fund for the Doctoral Program of Higher Education of China (20130171130001), and Key Laboratory of Optoelectronic Materials Chemistry and Physics, Chinese Academy of Sciences (2008DP173016).References
- G. Tamulaitis, P. Duchovskis, Z. Bliznikas, K. Breivė, R. linskaitė, A. Brazaitytė, A. Novičkovas and A. Žukauskas, J. Phys. D: Appl. Phys., 2005, 38, 3182–3187 CrossRef CAS.
- L. Ma, D. J. Wang, Z. Y. Mao, Q. F. Lu and Z. H. Yuan, Appl. Phys. Lett., 2008, 93, 144101 CrossRef.
- N. Yeh and J. P. Chung, Renewable Sustainable Energy Rev., 2009, 13, 2175–2180 CrossRef CAS.
- J. Y. Chen, N. M. Zhang, C. F. Guo, F. J. Pan, X. J. Zhou, H. Suo, X. Q. Zhao and E. M. Goldys, ACS Appl. Mater. Interfaces, 2016, 8, 20856–20864 CAS.
- F. W. Kang, M. Y. Peng, D. Y. Lei and Q. Y. Zhang, Chem. Mater., 2016, 28, 7807–7815 CrossRef CAS.
- F. W. Kang, H. S. Zhang, L. Wondraczek, X. B. Yang, Y. Zhang, D. Y. Lei and M. Y. Peng, Chem. Mater., 2016, 28, 2692–2703 CrossRef CAS.
- L. L. Wang, Q. L. Wang, X. Y. Xu, J. Z. Li, L. B. Gao, W. K. Kang, J. S. Shi and J. Wang, J. Mater. Chem. C, 2013, 1, 8033–8040 RSC.
- R. V. Yadav, R. S. Yadav, A. Bahadur, A. K. Singh and S. B. Rai, Inorg. Chem., 2016, 55, 10928–10935 CrossRef CAS PubMed.
- H. Y. Tan, M. Z. Rong, Y. Y. Zhou, Z. Y. Yang, Z. L. Wang, Q. H. Zhang, Q. Wang and Q. Zhou, Dalton Trans., 2016, 45, 9654–9660 RSC.
- Y. W. Zhu, L. Huang, R. Zou, J. H. Zhang, J. B. Yu, M. M. Wu, J. Wang and Q. Su, J. Mater. Chem. C, 2016, 4, 5690–5695 RSC.
- D. Sekiguchi and S. Adachi, ECS J. Solid State Sci. Technol., 2014, 3, R60–R64 CrossRef CAS.
- S. P. Singh, M. Kim, W. B. Park, J. W. Lee and K. S. Sohn, Inorg. Chem., 2016, 55, 10310–10319 CrossRef CAS PubMed.
- X. Ding, G. Zhu, W. Y. Geng, Q. Wang and Y. H. Wang, Inorg. Chem., 2016, 55, 154–162 CrossRef CAS PubMed.
- B. Wang, H. Lin, F. Huang, J. Xu, H. Chen, Z. B. Lin and Y. S. Wang, Chem. Mater., 2016, 28, 3515–3524 CrossRef CAS.
- R. P. Cao, M. Y. Peng, E. H. Song and J. R. Qiu, ECS J. Solid State Sci. Technol., 2012, 1, R123–R126 CrossRef CAS.
- W. Lü, W. Z. Lv, Q. Zhao, M. M. Jiao, B. Q. Shao and H. P. You, Inorg. Chem., 2014, 53, 11985–11990 CrossRef PubMed.
- T. Hasegawa, S. W. Kim, T. Abe, S. Kumagai, R. Yamanashi, K. Seki, K. Uematsu, K. Toda and M. Sato, Chem. Lett., 2016, 45, 1096–1098 CrossRef CAS.
- W. Lü, M. M. Jiao, B. Q. Shao, L. F. Zhao, Y. Feng and H. P. You, Dalton Trans., 2016, 45, 466–468 RSC.
- J. H. Chen, W. R. Zhao, N. H. Wang, Y. J. Meng, S. P. Yi, J. He and X. Zhang, J. Mater. Sci., 2016, 51, 4201–4212 CrossRef CAS.
- X. J. Gao, W. Li, X. L. Yang, X. L. Jin and S. G. Xiao, J. Phys. Chem. C, 2015, 119, 28090–28098 CAS.
- G. Blasse and A. Bril, J. Chem. Phys., 1968, 48, 217–222 CrossRef CAS.
- W. Chao, P. L. Li, Z. J. Wang, Y. S. Sun, J. G. Cheng, Z. L. Li, M. M. Tian and Z. P. Yang, Phys. Chem. Chem. Phys., 2016, 18, 28661–28673 RSC.
- S. H. Miao, Z. G. Xia, J. Zhang and Q. L. Liu, Inorg. Chem., 2014, 53, 10386–10393 CrossRef CAS PubMed.
- E. Cavalli, F. Angiuli, F. Mezzadri, M. Trevisani, M. Bettinelli, P. Boutinaud and M. G. Brik, J. Phys.: Condens. Matter, 2014, 26, 385503 CrossRef PubMed.
- R. J. Xie, N. Hirosaki, T. Suehiro, F. F. Xu and M. Mitomo, Chem. Mater., 2006, 18, 5578–5583 CrossRef CAS.
- B. M. Antipeuko, I. M. Bataev, V. L. Ermolaev and T. A. Privalova, Opt. Spectrosc., 1970, 29, 335 Search PubMed.
- G. Blasse, Energy Transfer in Oxidic Phosphors, Philips Res. Rep., 1969, 24, 131–144 CAS.
- R. Reisfeld, E. Greenberg, R. Velapoldi and B. Barnett, J. Chem. Phys., 1972, 56, 1698–1705 CrossRef CAS.
- D. L. Dexter and J. H. Schulman, J. Chem. Phys., 1954, 22, 1063–1070 CrossRef CAS.
- Integrating Sphere F-3018 Operation Manual Part number 81089 version 1.1, provided by HORIBA Jobin Yvon Inc., May, 2005 Search PubMed.
- B. Wang, H. Lin, J. Xu, H. Chen and Y. S. Wang, ACS Appl. Mater. Interfaces, 2014, 6, 22905–22913 CAS.
Footnote |
| † Electronic supplementary information (ESI) available. See DOI: 10.1039/c7ra01285c |
| This journal is © The Royal Society of Chemistry 2017 |

