 Open Access Article
Bio-power performance enhancement in microbial fuel cell using Ni–ferrite decorated anode†
Xinhong Peng *a,
Xizhang Chua,
Shenghui Wanga,
Ke Shana,
Daiwang Songa and
Ya Zhoub
aInstitute of Seawater Desalination and Multipurpose Utilization, State Oceanic Administration (SOA), Tianjin, 300192, P. R. China. E-mail: pxinhong@126.com; Fax: +86-22-87897993; Tel: +86-22-87897992
bInstitute of Chemical Industry, Hebei University of Technology, Tianjin 300130, P. R. China
First published on 13th March 2017
Abstract
Microbial fuel cell (MFC) is an emerging field in biotechnology for bio-power recovery synchronizing with wastewater degradation. However, the bio-current generation is severely limited by the extracellular electron transfer (EET) from the bacteria to the anode. A nano spinel type NiFe2O4 decorated MFCs anode was designed, fabricated and optimized. The MFC with the 5% NiFe2O4 added anode delivered a maximum power density (MPD) of 806.4 mW m−2, which was 26% higher than the value of 642 mW m−2 obtained for the un-added one. The MFC polarization resistance equipped with the most appropriate amount (5%) of NiFe2O4 decorator was only 92 Ω, which is 39% lower than that (150 Ω) of the control. Electrochemical impedance spectroscopy (EIS), cyclic voltammetry (CV) and Tafel tests exhibited remarkable enhancement in kinetic activity towards the bio-catalytic anodic reaction, which was attributed to the lower charge transfer resistance, higher substrate oxidation rate and exchange current density (i0). Further increment of the modifier can give rise to some negative effect, possibly due to the inhibition of electron diffusion on the contact interface. The study suggests that non-precious NiFe2O4 can be a promising promotor for the development of high-performance MFCs.
1. Introduction
The microbial fuel cell (MFC) is a promising renewable bio-energy recovery technology that directly converts chemical energy of wastewater to electricity via bio-catalysis.1–3 However, relatively lower bio-power output in MFCs limits its development for practical and commercial applications. As reported, the MFCs power behavior is tremendously restrained by the reactor configuration, electrode materials, and seeding bacterial characteristics and so on. Among these, the extracellular electron transfer (EET) efficiency at anode-microbe interfaces is a key factor index, where the exoelectrogenic bacteria attach, multiply and transfer electrons released by substrate oxidation simultaneously. Therefore, it is of great significance to seek appropriate anode materials to accelerate the EET for the bio-current improvement in MFCs.Although Pt is widely applied as the active material in MFCs4 with a lack of economic viability, more attention is being paid to identifying less expensive but effective alternatives, such as raw and modified carbon materials, owing to their good chemical stability and biological compatibility. Conventional electrodes, such as 3D graphite rods5 or 2D carbon cloth6 can generate maximum 26 mW m−2 or 611.5 ± 6 mW m−2 electrical power in a single-chamber air-cathode MFC. There was an application limit for graphite rod because of its low porosity and low surface area for bacterial colonization. In addition, the carbon cloth power performance was close to but lower than that in our previous study.7 Apart from its use as the carrier of the electrogenic bacteria, the MFCs anode should have excellent conductivity and sufficient capacitance to eliminate the energy overshoot.8,9 Cui et al. reported that power performance was enhanced by 186% with improved electrical conductivity by the electrophoretic deposition of carbon nanotubes (CNTs) on the surface of polyaniline modified graphite felt.10 Transition metal oxides with good pseudocapacitance can show an increase in transient/stationary electron storage. RuO2 is of interest in improving the power generation 17 fold by being coated on the carbon felt, as stated by Lv et al.11 However, either the high cost/toxicity for RuO2 or the relative weak mechanical strength/conductivity for the carbon material restricts the scale-up application of MFCs.
More recently, stainless steel mesh (SSM) has been proposed to be a good current collector with the characteristic of anti-corrosion, low cost and excellent electrical conductivity.12 Spinel ferrites, with the experience of various redox reactions resulting from its multiple oxidation states, are now being widely used as a biological sensor, in bio-separation, and high-density magnetic data storage media13 owing to the bio-compatibility, relative non-toxicity and magnetic properties. In addition, new functionality for their electrochemistry have also been developed due to the effective mass transport, high surface area, and microenvironment control.14 Exoelectrogenic bacteria, consisting of dissimilar metal-reducing bacteria, such as Shewanella and Geobacter species, can utilize Ni2+,15 and Fe(III) or Mn(IV) oxides16 as the electron acceptor to promote bacterial colonization and reduce the anodic internal resistance and EET. In contrast, few studies have explained the relationship between ferrites and anodic performance in MFCs. Nano NiFe2O4 has higher conductivity and better reaction activity than NiO and Fe2O3.17 Herein, a composite anode was fabricated with NiFe2O4 as a modifier and SSM as a current collector. The aim of the present study was to investigate the effects of magnetic NiFe2O4 with different amounts on the bio-electricity and electrochemical catalysis activity in MFCs.
2. Materials and methods
2.1 Preparation of nano NiFe2O4
All chemical reagents were of analytical grade and used without further purification. The fabrication process was carried out using hydrothermal method without inert protection.18 In a typical synthesis, 0.29 g of Ni(NO3)2·6H2O, 0.81 g Fe(NO3)3·9H2O, 0.2 g cetyltrimethylammonium bromide (CTAB) were dissolved in 32 mL distilled water with the drop-wise addition of 3 mL aqueous ammonia under magnetic stirring. The uniform mixture was transferred to a Teflon-lined stainless steel autoclave with a volume of 50 mL. The autoclave was sealed and heated to 180 °C for 12 h, and then cooled naturally to room temperature. The brown precipitates were collected by a suction filter, followed by washing several times with deionized water and absolute ethanol. The final products were dried in a vacuum oven at 90 °C for standby application.2.2 Assembly of MFCs system
Double anodes were prepared using the same technical process previously described19 and assembled into two identical MFCs configurations under per NiFe2O4 amount, respectively, and then measured in parallel comparison to establish the reproducibility of each addition amount.20 The electrode sheet was made up of NiFe2O4, active carbon (Xinsen Carbon Co. Ltd., Fujian, China), and conductional carbon black (JinQiuShi chemical Co. Ltd, Tianjin, China) with a 5 wt% polytetrafluoroethylene (PTFE, 60 wt%; Horizon LID, Shanghai, China) emulsion. The electrode sheet was then anchored with the SSM (Shengsong Screen Co. Ltd, Tianjin, China), which was used as the matrix and current collector. The amount of NiFe2O4 in the composite anodes was 0 wt%, 3 wt%, 5 wt% and 7 wt% (hereafter referred to as control, C3NFO, C5NFO and C7NFO, respectively). The obtained electrodes were dried at room temperature for 12 h to remove the residual solvent. A cathode a with sandwich structure was laminated in parallel with an activated carbon catalytic layer, a carbon black gas diffusion layer and a SSM current collector.A 28 mL cylindrical membrane-less single-chamber configuration was used as the MFC reactor (4 cm long by 3 cm diameter; 7 cm2 project area), which was run in a 30 ± 0.5 °C temperature-controlled biochemical incubator (Taisite Instrument Co. Ltd., Tianjin, China) in batch mode under 1 kΩ, except if noted otherwise. The anode and cathode were located on both sides of the MFC structure at a distance of 4 cm and connected by a corrosion resistive titanium wire to form the external circuit. All the reactors were inoculated by the secondary effluent from wastewater treatment plant in Tianjin City until the output voltage was ≥300 mV.7 The medium was refreshed with sodium acetate (1 g L−1) with a COD of 780 mg L−1, 50 mM phosphate buffer solution (PBS, g L−1, Na2HPO4 4.576, NaH2PO4 2.132, NH4Cl 0.31, KCl 0.13), trace minerals (12.5 mL L−1) and vitamins (5 mL L−1) as soon as the voltage was ≤50 mV.
2.3 Physical and electrochemical analysis
X-ray diffraction (XRD) was conducted on a Bruker D8 Advance diffractometer with Cu Ka radiation (λ = 1.5406 Å). The X-ray intensity was measured from 10 to 80° 2θ with a velocity of 0.02° min−1. Transmission electron microscopy (TEM) is one of the most useful ways to characterize nanoparticles. It was carried out with a FEI tecnai G2 F30 instrument. To obtain information on the valence state of Ni and Fe, X-ray photoelectron spectroscopy (XPS) was performed on an Escalab 250Xi of Thermo Fisher Scientific, England.The output voltages across resistors were monitored every 30 min using a date acquisition system (PISO-813, ICP DAS Co. Ltd, China). The anode and cathode potentials are described according to Ag/AgCl reference electrode (3.5 M KCl, +197 mV vs. standard hydrogen electrode; SHE). Polarization and power density curves were plotted by varying the external resistance from 1000 to 50 Ω at a time interval of 20 min. The power density P (mW m−2) was obtained according to P = IV/A.
All the bio-electrochemical tests were operated in situ by a potentiostat (parstat 3000, Princeton Applied Research, USA) in a classical three-electrode system for the MFCs reactor with the as-prepared anode as the working electrode, the air-cathode as the counter electrode, and an Ag/AgCl close to the anode as the reference electrode. Electrochemical impedance spectroscopy (EIS) was analyzed with the voltage amplitude of 10 mV over the frequency range from 100 kHz to 0.01 Hz at the open circuit potential (OCP). The obtained data were simulated using Zsimpwin software (ver. 3.50). The Tafel measurements displayed the intrinsic electron transfer rate toward the anode surface with different weight fractions of nano NiFe2O4, which was calculated using the Tafel empirical equation: log![[thin space (1/6-em)]](https://www.rsc.org/images/entities/char_2009.gif) i = log
i = log![[thin space (1/6-em)]](https://www.rsc.org/images/entities/char_2009.gif) i0 − βnFη/2.303RT. The Tafel plot was conducted by sweeping at 1 mV s−1 from the OCP of the anode (vs. Ag/AgCl) to an over-potential (η) of 80 mV.21 The cyclic voltammetry (CV) polarization curve of the anodic biofilm was swept by applying a potential ramp at a scan rate of 0.1 mV s−1 over the potential range from −0.8 to 0 V (vs. Ag/AgCl) under turnover conditions.
i0 − βnFη/2.303RT. The Tafel plot was conducted by sweeping at 1 mV s−1 from the OCP of the anode (vs. Ag/AgCl) to an over-potential (η) of 80 mV.21 The cyclic voltammetry (CV) polarization curve of the anodic biofilm was swept by applying a potential ramp at a scan rate of 0.1 mV s−1 over the potential range from −0.8 to 0 V (vs. Ag/AgCl) under turnover conditions.
3. Results and discussion
3.1 Structural characterization
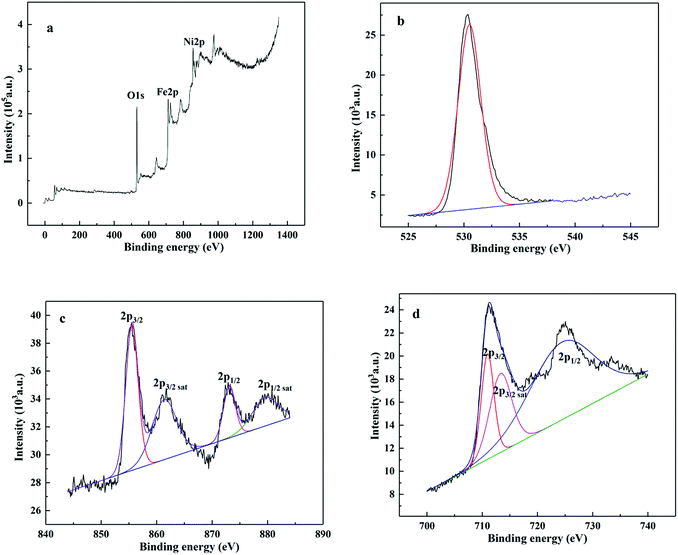
The XRD pattern of the as-obtained NiFe2O4 is shown in Fig. 1a. The characteristic peaks were located at 18.4°, 30.2°, 35.7°, 43.3°, 57.4° and 62.9° 2θ with simultaneously indexing to (111), (220), (311), (400), (511) and (440) panels, respectively. The natural phase was identified as a spinel type cubic structure of Fd![[3 with combining macron]](https://www.rsc.org/images/entities/char_0033_0304.gif) m corresponding to the JCPD file no. 54-0964. Fig. 1b exhibited a paper-like morphology of the as-prepared NiFe2O4 by TEM. As shown in Fig. 1b, the NiFe2O4 nanoparticles were characterized by particle sizes of ca. 10 nm, which was the same as that calculated by Scherrer's equation. Furthermore, the lattice fringe spacing of 2.5 Å (inset in Fig. 1c) was observed to originate from the (311) plane of NiFe2O4, matching well with the XRD data. The XPS spectra survey (Fig. 2a) further proved the presence of Ni, Fe and O elements with a ratio of 1
m corresponding to the JCPD file no. 54-0964. Fig. 1b exhibited a paper-like morphology of the as-prepared NiFe2O4 by TEM. As shown in Fig. 1b, the NiFe2O4 nanoparticles were characterized by particle sizes of ca. 10 nm, which was the same as that calculated by Scherrer's equation. Furthermore, the lattice fringe spacing of 2.5 Å (inset in Fig. 1c) was observed to originate from the (311) plane of NiFe2O4, matching well with the XRD data. The XPS spectra survey (Fig. 2a) further proved the presence of Ni, Fe and O elements with a ratio of 1![[thin space (1/6-em)]](https://www.rsc.org/images/entities/char_2009.gif) :
:![[thin space (1/6-em)]](https://www.rsc.org/images/entities/char_2009.gif) 2.3
2.3![[thin space (1/6-em)]](https://www.rsc.org/images/entities/char_2009.gif) :
:![[thin space (1/6-em)]](https://www.rsc.org/images/entities/char_2009.gif) 4.8, which was similar to the theoretical value of NiFe2O4. As shown in Fig. 2b, the O 1s peak was located at a binding energy of 530.4 eV, corresponding to the metal–oxygen bond.22 The high resolution scan of Ni 2p spectrum was deconvoluted into two spin–orbit doublets peaks of Ni 2p3/2 at 855.5 eV of and Ni 2p1/2 at 873.1 eV and two shakeup satellites peaks of Ni 2p3/2 at 861.4 eV and Ni 2p1/2 at 879.6 eV, indicating the existence of Ni2+/Ni3+ species on the NiFe2O4 surface (Fig. 2c).23 In the deconvoluted XPS spectra of Fe 2p core level peaks (Fig. 2d), two strong peaks of Fe 2p3/2 and Fe 2p1/2 at 710.9 eV and 724.4 eV should be attributed to Fe3+,24 and a weak peak of Fe 2p3/2 sat at 713.3 eV suggested the presence of Fe2+.25 All the information given above was consistent with published reports on prepared NiFe2O4.
4.8, which was similar to the theoretical value of NiFe2O4. As shown in Fig. 2b, the O 1s peak was located at a binding energy of 530.4 eV, corresponding to the metal–oxygen bond.22 The high resolution scan of Ni 2p spectrum was deconvoluted into two spin–orbit doublets peaks of Ni 2p3/2 at 855.5 eV of and Ni 2p1/2 at 873.1 eV and two shakeup satellites peaks of Ni 2p3/2 at 861.4 eV and Ni 2p1/2 at 879.6 eV, indicating the existence of Ni2+/Ni3+ species on the NiFe2O4 surface (Fig. 2c).23 In the deconvoluted XPS spectra of Fe 2p core level peaks (Fig. 2d), two strong peaks of Fe 2p3/2 and Fe 2p1/2 at 710.9 eV and 724.4 eV should be attributed to Fe3+,24 and a weak peak of Fe 2p3/2 sat at 713.3 eV suggested the presence of Fe2+.25 All the information given above was consistent with published reports on prepared NiFe2O4.
 | ||
| Fig. 1 Crystallization and morphology of NiFe2O4 particles. (a) XRD patterns, (b) TEM image and (c) HRTEM image with different magnifications. | ||
3.2 Bio-power generation performance
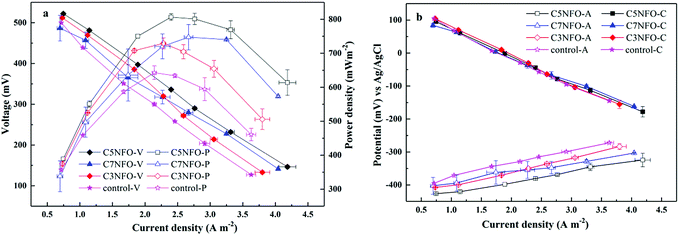
With the refreshment of MFCs medium, the output current first increased rapidly to the maximum for a certain time and then decreased sharply to ca. 20 mV. When the output voltages were ≥500 mV for three consecutive periods, the MFCs system was stable without a statistically significant difference between these two MFCs under the per NiFe2O4 amount (ANOVA, P > 0.05). The acetate-fed MFCs had enriched functional bacterial communities focusing on the Geobacter family with certain abundance26 and could be utilized for electricity generation tests using variable external resistance. Fig. 3b shows that the four cathodes had a similar polarization resistance, indicating that the significant difference in i–V behavior was not due to the cathode but the anode. The polar potential in 5% NiFe2O4-added anode ranged from −426.5 to −282 mV, which was lower than those of C7NFO (−402.5 to −265 mV), C3NFO (−407.5 to −259 mV), and the control (−395 to −260 mV), suggesting that the least thermodynamic driving force was used to oxidize the substrate for the C5NFO-anode. The C5NFO-anode delivered the largest current density of 4.18 A m−2, which was 16%, 10%, and 3.4% higher than the control (3.62 A m−2), C3NFO (3.80 A m−2), and C7NFO (4.04 A m−2), respectively.The fuel cell performance and power density are illustrated in Fig. 3a. For the ferrite-decorated anodes, they all demonstrated a larger maximum power density (MPD) than the corresponding unmodified anode (the control). In addition, the C5NFO-MFC showed the best performance with a MPD of 806.4 mW m−2, which was 11%, 8%, and 26% higher than C3NFO-MFC (729 mW m−2), C7NFO-MFC (747 mW m−2), and the control (642 mW m−2), respectively. Furthermore, the MFCs performance with different amounts of Ni2FeO4 was still stable for two months (Fig. S1 in ESI†). For MFCs with different amounts of Ni2FeO4, more than 95% of acetate was removed with only a small amount staying in solution when the voltage output dropped to below 20 mV. The current density was inversely proportional to the MFCs resistance as Jung et al. illustrated.26 Thus, there would be minimal difference for current density in high external resistance. The coulombic efficiency (EC) was calculated using the calculation formula.27 It was 21–23% for the MFCs system under the external resistance of 1 kΩ. The slope of the polarization curves could be fitted to the internal resistance of MFCs configuration. The plot explained that the polarization resistance decreased significantly with the addition of NiFe2O4. It was noted that there was an 18% (3% NiFe2O4 added, 122 Ω) and 39% (5% NiFe2O4 added, 92 Ω) decrease from the control (150 Ω); unexpectedly, with a further increase in NiFe2O4 content, the polarization resistance did not continue to decrease but increased by 27.1% to 117 Ω (7% NiFe2O4 added). This phenomenon could be interpreted by the following bio-analysis from the electrochemical measurements.
3.3 Bio-electrochemical analysis
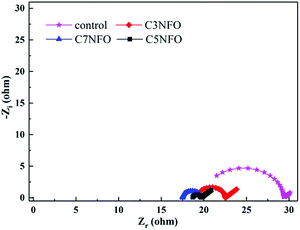
After the reactor run for stabilization, EIS measurement of MFCs anode was performed (Fig. 4). The appropriate impedance spectra were fitted to Nyquist mode by the equivalent circuit model (ECM): R(Q(RW)). As reported, electrode potential losses were derived from three sources: activation losses, ohmic losses, and mass transfer losses. Based on the fitting simulation results with errors of ≤10%, Rs represents the ohmic resistance and Rct represents the charge transfer resistance, which corresponds to the diameter of the semicircle over the high-frequency range. Rw represents the Warburg parameter. Owing to the deviation from ideal for the electric double layer, the constant phase element (CPE) was used to replace the capacitors (Q). Table 1 shows that the CPE increased from 0.19 × 10⁻⁴ F (the control) in the following order: 0.55 × 10⁻⁴ F (3% NiFe2O4 added), 1.24 × 10⁻⁴ F (5% NiFe2O4 added) and 4.28 × 10⁻⁴ F (7% NiFe2O4 added). This was possibly due to the pseudocapacitive behavior of NiFe2O4 with more electrons being stored in the modified anodes. There was a contrary tendency to respond to Rs with clear differences among the four anodes of 19.94 Ω (the control) > 19.22 Ω (3% NiFe2O4 added) > 18.7 Ω (5% NiFe2O4 added) > 17.5 Ω (7% NiFe2O4 added), indicating that NiFe2O4 helped reduce the anode ohmic resistance. The Rct decreased from 9.394 Ω (the control) to 2.122 Ω (3% NiFe2O4 added) and then to 0.974 Ω (5% NiFe2O4 added), confirming that NiFe2O4 can serve as an electron reservoir to facilitate the EET activity and then to minimize the electron transport resistance to the interior surface. Rw is inversely proportional to the anodic diffusivity. The same tendency was observed with Rct, where the addition of 3% and 5.0% NiFe2O4 decreased Rw from the control (2.563 Ω s−0.5) to 0.432 Ω s−0.5 and then to 0.409 Ω s−0.5 in Table 1, showing that the diffusion condition of electrons was promoted by the addition of NiFe2O4. However, the Rct and Rw increased to 3.285 Ω and 0.469 Ω s−0.5 with the further addition of NiFe2O4 to 7%. This was in accordance with the power density curves in the context, possibly due to the redox reactions of Ni3+/Ni2+ and Fe3+/Fe2+ on the anodic surface inhibiting electron transport from the bacteria to the electrode interface. Further investigation should be done to identify the mechanism in detail.| Anodes | Rs (Ω) | Rct (Ω) | CPE (10−4 F) | Rw (Ω s−0.5) |
|---|---|---|---|---|
| Control | 19.94 | 9.394 | 0.19 | 2.563 |
| C3NFO | 19.22 | 3.285 | 0.55 | 0.469 |
| C5NFO | 18.7 | 0.974 | 1.24 | 0.409 |
| C7NFO | 17.5 | 2.122 | 4.28 | 0.432 |
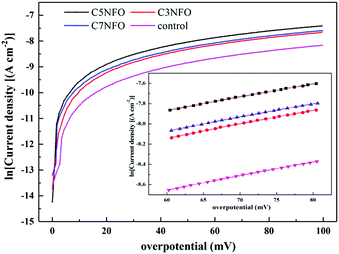
The Tafel plot was made to extract the parameters of the exchange current density (i0 A cm−2) from the linear region of the polarization curve on a semi-log plot, (∼+80 mV of OCP with R2 ≥ 0.999), as shown in Fig. 5. Table 2 shows that the Tafel region of the polarization curve for the MFCs anode reinforced with different weight fractions of NiFe2O4, and the i0 was ordered as follows: C5NFO-MFC (1.75 × 10⁻⁴ A cm−2) > C7NFO-MFC (1.40 × 10⁻⁴ A cm−2) > C3NFO-MFC (1.28 × 10⁻⁴ A cm−2) > the control (0.76 × 10⁻⁴ A cm−2). An ANOVA test of four different levels (0, 3, 5, and 7 wt%) was studied to determine the statistical significance of altering the NiFe2O4 weight fractions at the 95% confidence level. Table 3 shows that the p-value was below 0.05, implying a significant effect of NiFe2O4 content on i0. Normal to the i0 of the un-added one, the kinetic activities (KAs, 1.84 and 1.68) of the C7NFO-anode and C3NFO-anode were 20% and 27% lower than that (2.31) of the C5NFO-anode (Table 2), respectively, indicating that the MFC operating with NiFe2O4 content of 5.0% obtained the fastest EET. This was in fair agreement with the power density curve, further confirming that the addition of NiFe2O4 could accelerate the EET. Compared to previous reports, the maximum KA of 2.31 received here was 1.7 fold as much as 1.32 of the Fe3O4-added anode7 and 5% higher than 2.2 of the Fe3O4/ceramic–graphite composite electrode.21 The results verified that ferrite can be a better choice as a promoter for anodic power generation.
| Anodes | Fitting equation | i0 (10−4 A cm−2) | R2 | KA |
|---|---|---|---|---|
| Control | η = 0.01388![[thin space (1/6-em)]](https://www.rsc.org/images/entities/char_2009.gif) ln ln![[thin space (1/6-em)]](https://www.rsc.org/images/entities/char_2009.gif) i − 9.48476 i − 9.48476 |
0.76 | 0.999 | 1 |
| C3NFO | η = 0.01374![[thin space (1/6-em)]](https://www.rsc.org/images/entities/char_2009.gif) ln ln![[thin space (1/6-em)]](https://www.rsc.org/images/entities/char_2009.gif) i − 8.96354 i − 8.96354 |
1.28 | 0.999 | 1.68 |
| C5NFO | η = 0.01308![[thin space (1/6-em)]](https://www.rsc.org/images/entities/char_2009.gif) ln ln![[thin space (1/6-em)]](https://www.rsc.org/images/entities/char_2009.gif) i − 8.64961 i − 8.64961 |
1.75 | 0.999 | 2.31 |
| C7NFO | η = 0.01347![[thin space (1/6-em)]](https://www.rsc.org/images/entities/char_2009.gif) ln ln![[thin space (1/6-em)]](https://www.rsc.org/images/entities/char_2009.gif) i − 8.87591 i − 8.87591 |
1.40 | 0.999 | 1.84 |
| Source | DF | Adj SS | Adj MS | F-Value | P-Value |
|---|---|---|---|---|---|
| Factor (wt%) | 3 | 6.940 | 2.3134 | 327.463 | 0.000 |
| Error | 80 | 0.565 | 0.007 | ||
| Total | 83 | 7.505 |
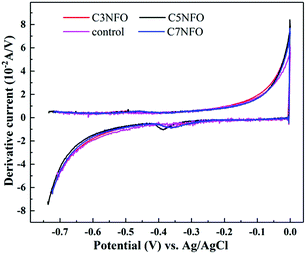
To better understand the influence of anode materials on the MFCs performance, CV tests were recorded to elicit the biocatalyst oxidation of the acetate substrate for the electron transfer process from the bacteria to the anode. Fig. S2† shows that the CVs of MFCs anode were slightly different in shape. The anodic oxidation current first increased with increasing NiFe2O4 content to 5% and then decreased with further increment to 7%. Generally, a more rapid oxidation reaction rate could be acquired at 5%. The first derivative (DCV) of the corresponding CVs for the NiFe2O4-added anodes apparently exhibited the presence of a redox centre (Fig. 6), which was close to the midpoint potential of riboflavin (−0.42 V vs. Ag/AgCl) as the customary redox mediator. However, a closer look at the DCVs revealed an interesting shift about the onset potential. The onset potentials of the NiFe2O4 added anodes were distinctly lower than that of the un-added anode (−0.371 V vs. Ag/AgCl). It was −0.415 V vs. Ag/AgCl with the least thermodynamics loss when 5% NiFe2O4 was added to the anode; neither too high (7% NiFe2O4 added) nor too low (3% NiFe2O4 added) would cause more thermodynamics loss. This phenomenon was coincident with the Tafel and EIS results mentioned above. Although the slight increase in exogenous matter can significantly improve the bio-power output, the content was too low to observe an obvious redox peak of Ni or Fe. More research will be needed in the future.
4. Conclusion
A spinel-type NiFe2O4 modified composite anode with a content of 5 wt% delivered an MPD of 806.4 mW m−2, 26% higher than (642 mW m−2) the control. Bio-electrochemical analysis showed that the internal resistance was significantly reduced by 39%, and the corresponding EET efficiency was considerably facilitated due to the enhanced kinetic activities. Either too high (7 wt% NiFe2O4 added) or too low (3 wt% NiFe2O4 added) inhibited the power outputs, possibly resulting from the decrease in interface conductivity. As a consequence, the proper addition of NiFe2O4 to the MFCs anode can be a good accelerator for future development.Acknowledgements
This study was supported by the National Natural Science Foundation of China (NSFC, No. 51409052), the Scientific Research Project of the Marine Public Welfare Industry of China (No. 201505006) and the Fundamental Research Funds for the Central Public Interest Scientific Institution (No. K-JBYWF-2016-T17, K-JBYWF-2015-T16).References
- B. E. Logan and K. Rabaey, Science, 2012, 337, 686–690 CrossRef CAS PubMed.
- Y.-Y. Yu, C.-X. Guo, Y.-C. Yong, C.-M. Li and H. Song, Chemosphere, 2015, 140, 26–33 CrossRef CAS PubMed.
- S. Jung, M. M. Mench and J. M. Regan, Environ. Sci. Technol., 2011, 45, 9069–9074 CrossRef CAS PubMed.
- A. Baudler, I. Schmidt, M. Langner, A. Greiner and U. Schroeder, Energy Environ. Sci., 2015, 8, 2048–2055 CAS.
- H. Liu, R. Ramnarayanan and B. E. Logan, Environ. Sci. Technol., 2004, 38, 2281–2285 CrossRef CAS PubMed.
- W.-F. Liu, S.-A. Cheng and J. Guo, Appl. Surf. Sci., 2014, 320, 281–286 CrossRef CAS.
- X.-H. Peng, H.-B. Yu, X. Wang, Q.-X. Zhou, S.-J. Zhang, L.-J. Geng, J.-W. Sun and Z. Cai, Bioresour. Technol., 2012, 121, 450–453 CrossRef CAS PubMed.
- X.-H. Peng, H. Yu, H.-B. Yu and X. Wang, Bioresour. Technol., 2013, 138, 353–358 CrossRef CAS PubMed.
- X.-H. Peng, X.-Z. Chu, W. Liu, S.-H. Wang, Y. Zou and X.-N. Wang, Chin. J. Catal., 2015, 36, 1326–1332 CrossRef CAS.
- H.-F. Cui, L. Du, P.-B. Guo, B. Zhu and J. H. Luong, J. Power Sources, 2015, 283, 46–53 CrossRef CAS.
- Z.-S. Lv, D.-H. Xie, X.-J. Yue, C.-H. Feng and C.-H. Wei, J. Power Sources, 2012, 210, 26–31 CrossRef CAS.
- K. Guo, D. Hidalgo, T. Tommasi and K. Rabaey, Bioresour. Technol., 2016, 211, 664–668 CrossRef CAS PubMed.
- A. A. Ensafi, F. Saeid, B. Rezaei and A. R. Allafchian, Anal. Methods, 2014, 6, 6885–6892 RSC.
- A. A. Ensafi, B. Arashpour, B. Rezaei and A. R. Allafchian, Mater. Sci. Eng., C, 2014, 39, 78–85 CrossRef CAS PubMed.
- D. H. Park and J. G. Zeikus, Appl. Microbiol. Biotechnol., 2002, 59, 58–61 CrossRef CAS PubMed.
- R. Nakamura, F. Kai, A. Okamoto, G. J. Newton and K. Hashimoto, Angew. Chem., Int. Ed., 2009, 48, 508–511 CrossRef CAS PubMed.
- Y.-L. Kuo, W.-C. Huang, W. Hsu, Y. Tseng and Y. Ku, Aerosol Air Qual. Res., 2015, 15, 2700–2708 CAS.
- Z.-Y. Yu, L.-F. Chen and S.-H. Yu, J. Mater. Chem. A, 2014, 2, 10889–10894 CAS.
- X.-H. Peng, H. Yu, X. Wang, N.-S. Gao, L.-J. Geng and L.-N. Ai, J. Power Sources, 2013, 223, 94–99 CrossRef CAS.
- W.-H. He, W.-L. Yang, Y.-S. Tian, X.-P. Zhu, J. Liu, Y.-J. Feng and B. E. Logan, J. Power Sources, 2016, 332, 447–453 CrossRef CAS.
- D. A. Lowy, L. M. Tender, J. G. Zeikus, D. H. Park and D. R. Lovley, Biosens. Bioelectron., 2006, 21, 2058–2063 CrossRef CAS PubMed.
- B.-C. Ge, K.-X. Li, Z. Fu, L.-T. Pu, X. Zhang, Z.-Q. Liu and K. Huang, J. Power Sources, 2016, 303, 325–332 CrossRef CAS.
- R.-C. Jin, H. Jiang, Y. Sun, Y.-X. Ma, H.-H. Li and G. Chen, Chem. Eng. J., 2016, 303, 501–510 CrossRef CAS.
- J.-F. Li, S.-L. Xiong, Y.-R. Liu, Z.-C. Ju and Y.-T. Qian, ACS Appl. Mater. Interfaces, 2013, 5, 981–988 CAS.
- R. A. Jones and H. W. Nesbitt, Am. Mineral., 2002, 87, 1692–1698 CrossRef CAS.
- S. Jung and J. M. Regan, Appl. Microbiol. Biotechnol., 2007, 77, 393–402 CrossRef CAS PubMed.
- H. Liu, S.-A. Cheng and B. E. Logan, Environ. Sci. Technol., 2005, 39, 658–662 CrossRef CAS PubMed.
Footnote |
| † Electronic supplementary information (ESI) available. See DOI: 10.1039/c7ra01253e |
| This journal is © The Royal Society of Chemistry 2017 |

