 Open Access Article
A high-performance bio-adhesive derived from soy protein isolate and condensed tannins
Chang Liu ,
Yi Zhang,
Xiaona Li,
Jing Luo,
Qiang Gao* and
Jianzhang Li*
MOE Key Laboratory of Wooden Material Science and Application, Beijing Forestry University, Beijing 100083, China. E-mail: gaoqiang@bjfu.edu.cn; changliu3104@bjfu.edu.cn; Fax: +86-01062336912
First published on 18th April 2017
Abstract
In this research, condensed tannins (CTs) were modified by hexamine and mixed with soy isolate protein (SPI) under pH 9.0 conditions to form a series of new high-performance bio-adhesives (HCT-SPI). The adhesives had a compact structure and stable thermal performance according to the results of FTIR, SEM and TGA measurements. Their high crosslinking density was attributed to the crosslinking reaction of CT molecules via the imine groups of the hexamine decomposition product; another reason was that the ortho-quinone obtained via pyrocatechol oxidation on the tannins B ring led to covalent interactions and a crosslinking reaction with SPI molecules. The hydrolytic stability of HCT-SPI 5 adhesive (SPI 15 g, CTs 5 g, hexamine 2.5 g) increased by 3.2% compared to the native SPI-based adhesive, and the wet shear strength of plywood bonded by the HCT-SPI 5 adhesive was enhanced by 90.7% compared to plywood bonded by native SPI-based resins, which is acceptable for industrial application in plywood fabrication according to the China National Standard (≥0.7 MPa).
1. Introduction
Adhesives play a prominent role in a wide array of industrial fields including construction, aerospace, automobile manufacturing, packaging, wood products, and many more. Most adhesives are derived from petroleum, which is a nonrenewable and generally unsustainable resource. Common adhesives such as phenol-formaldehyde (PF) and urea-formaldehyde (UF) also release formaldehyde, which is known to be harmful to human health.1 With increasing concern regarding environmental safety and sustainability, there is an urgent need for developing eco-friendly adhesives from renewable, natural resources.Previous researchers have indeed responded to this demand. Soy protein-based adhesive has shown remarkable potential as a bio-based adhesive since its first discovery in the 1930s.2 It is considered a notable alternative to petroleum polymer because it is inexpensive, abundant, and easily handled. However, the low bonding strength and poor wet resistance of soy protein-based adhesive limits its more extensive application.1 Thus a number of chemical modifications have been proposed to improve these properties, which can be roughly divided into two categories.
1.1 Soy protein structure modification
Previous researchers have focused on unfolding soy protein molecules and exposing their hydrophobic subunits. Urea3 and undecylenic acid (UA),4 for example, were used to denature soy protein and break the soy protein molecule secondary structure to enhance the soy protein-based adhesive's water resistance. The wet shear strength of plywood bonded by the modified adhesive does not meet the interior use requirement, however, because the denature process exposes many hydrophilic groups in the soy protein molecule such as –NH2, –COOH, and –OH.1.2 Crosslinking agent modification
Researchers have used polyamidoamine-epichlorohydrin (PAE) as cross-linker to react with the –NH2, –COOH, and other exposed groups of soy protein to increase the cross-linking density of the soy protein-based adhesive; plywood bonded by this adhesive shows wet shear strength up to 0.95 MPa.5 Luo found that epoxide can also crosslinked with soy protein adhesive to improve the wet shear strength of the resultant plywood by 182.9%, up to 1.16 MPa, which within interior-use plywood requirements according to China National Standard (≥0.7 MPa).6 The use of crosslinkers does not entirely eliminate dependence on petroleum-derived materials, however, and the large amount of waste generated at the end of the product's life is harmful.Condensed tannins (CTs) are an eco-friendly raw material for adhesive production that are ubiquitous in wood, barks and fruits.7 Structurally, CTs are composed of flavan-3-ol sub-units groups in which two phenolic rings, A and B, are connected through a central oxygen-containing ring referred to as the heterocyclic ring (or “C ring”) (Fig. 1).8 The connection between CTs molecules is mainly through “C4→C8” or “C4→C6” bonds. Based on their structural features, CTs have been widely applied in the wood adhesive industry in recent years for bonding interior and exterior wood products such as particleboard and plywood to replace part of the phenol; therefore reduce the emissions of toxic gases.9 They can also substitute for phenol in the production of resins.10,11 Most thermoset adhesive are highly crosslinked for a good bonding performance and stable structure, thus the tannin-based adhesive has to enhance its crosslinking degree to fulfill the demand of commercial use.12 In the past decades, hexamine is commonly used in the field of tannin-based adhesive. Based on the decomposition reaction, hexamine plays a role in promoting autocondensation reaction of tannins and further increasing the crosslinking degree of the resultant adhesive, leading to a high viscosity adhesive with stable thermal curing behavior, which meets the exterior-use particle board requirements.13–16
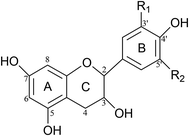 | ||
| Fig. 1 Chemical structures of flavonoid ring system.8 | ||
One of the most promising applications of these novel bio-adhesives is their potential use as wood adhesives. A wood adhesive needs appropriate flowability during bonding in order to form sufficient contact with the wood substrates; it is essential for the adhesive to solidify appropriately as well to hold the substrates together via chemical reaction to crosslink the material (or build molecular weight in the case of thermoset adhesives). In short, crosslinking property is a crucial factor in effective wood adhesives.17
In this study, condensed tannins (CTs) were modified by hexamine and mixed with soy protein isolate (SPI) to develop a series of new SPI-based adhesives without any petroleum additives. FTIR and other supporting analyses were conducted to investigate the chemical changes occurring during synthesis process. In addition, TG and SEM were used to investigate the thermal and morphological properties respectively. Three-layer plywood specimens were fabricated with the adhesive samples as-prepared and their wet shear strength was tested according to China National Standards (GB/T 9846.3-2004).
2. Materials and methods
2.1 Materials
CTs were purchased from Tian'guan Biotech Co. (Henan, China) with the following components: 60.1% CTs, 27.4% non-tannins, 9.5% moisture, and 3% insoluble substance. SPI with more than 95% protein content was obtained from Yuwang Ecological Food Industry Co., Ltd. (Shandong, China) and milled to 250 mesh flour. Hexamine and sodium hydroxide (NaOH) were AR-grade reagents purchased from Tianjin Chemical Reagent Co. The sodium hydroxide was diluted to 30% (w/w) solutions. Poplar (Populus tomentosa) veneers (40 × 40 × 1.5 cm, 8% moisture content) were provided by Hebei Province, China.2.2 Preparation of different adhesives
The HCT-SPI adhesive was prepared as follows: 2.5 g hexamine powder and CTs (2.5, 5, 7.5 and 10 g) were mixed in 85 g water and stirred for 15 min at 20 °C to obtain a HCT mixture; 30% NaOH solution was then used to adjust the pH of HCT mixture to 9.0. Finally, 15 g SPI was added to the mixture and stirred for 30 min at 20 °C to obtain a homogeneous adhesive, the resulting adhesives were labeled “HCT-SPI 2.5”, “HCT-SPI 5”, “HCT-SPI 7.5”, and “HCT-SPI 10” indicating the different CT additions.There were six controls, the codes and components of which are listed in Table 1. The pH value was adjusted by 30% NaOH solution and SPI was always the last component added to the mixture. The native SPI sample was not pH-adjusted. All samples were mixed at 20 °C to obtain a homogeneous substance.
| Sample code | SPI (g) | Water (g) | CTs (g) | Hexamine (g) | pH |
|---|---|---|---|---|---|
| SPI | 15 | 85 | 0 | 0 | — |
| al-SPI | 15 | 85 | 0 | 0 | 9.0 |
| CT-SPI | 15 | 85 | 5 | 0 | 9.0 |
| H-SPI | 15 | 85 | 0 | 2.5 | 9.0 |
| H-CT | 0 | 85 | 5 | 2.5 | 9.0 |
| al-CT | 0 | 85 | 5 | 0 | 9.0 |
2.3 FTIR, SEM and TG measurement
Each adhesive sample was placed in an oven at 120 ± 2 °C to cure completely, then ground into 200-mesh powder. FTIR analyses were carried out using a Nicolet 6700 spectrometer (Nicolet Instrument Corporation, Madison, WI) with potassium bromide (KBr) crystal. Spectra were recorded in the 4000–500 cm−1 range at a resolution of 4 cm−1, averaging 32 scans per sample.TG measurement was scanned from 10 °C to 610 °C using a thermogravimetric analyzer (TA Q50, Waters Company, USA) at a rate of 10 °C min−1; 5 ± 0.1 mg powdered sample was weighed in a platinum cup and the weight changes were recorded in a nitrogen environment.
The fracture surfaces of cured adhesive films with thickness of about 1.5 mm were observed under a Hitachi S-4800 emission scanning electron microscope (Hitachi Scientific Instruments, Tokyo, Japan). Prior to examination, the fractured specimens were sputter-coated with 10 nm Au/Pd film using a Q150T S Turbo-Pumped Sputter Coater/Carbon Coater (Quorum Technologies Ltd., UK) to ensure sufficient conductivity.
2.4 Characterization of adhesive samples
3. Results and discussion
3.1 Reaction mechanism of modified CTs
The reaction mechanism of modified CTs under alkaline conditions was measured according to their FTIR spectra (Fig. 2); native CTs and alkaline CTs (pH = 9.0) were also investigated. The typical absorption peaks of aromatic nuclei (1611, 1515, and 1445 cm−1) decreased considerably in the H-CT spectra, and the benzene ring breathing (875, 813, and 775 cm−1) of CTs became negligible and eventually disappeared in the spectrum of H-CT. Those declining trends were mirrored in the al-CT spectrum, which can be attributed to the oxidation reaction in the B ring of CTs under alkaline conditions. The product obtained by oxidation reaction is an ortho-quinone, which can react with protein amino groups to form Schiff bases. The ortho-quinone can also undergo a Michael addition reaction, which can further react with amino groups to form Schiff bases.18 These reactions are benefit to build a three-dimensional crosslinked network formation.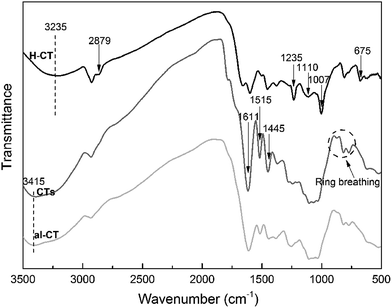 | ||
| Fig. 2 FTIR spectra of H-CT (SPI 0 g, CTs 5 g, hexamine 2.5 g, pH = 9.0), CTs and al-CT (SPI 0 g, CTs 5 g, hexamine 0 g, pH = 9.0). | ||
The oxidation reaction of H-CT is accompanied by the decomposition (and recomposition) of hexamine. In the H-CT spectrum, the hydroxyl group (3415 cm−1) participating in the H-bond shifted to 3235 cm−1 after hexamine was introduced, indicating the weakened vibrational energy of O–H bonding likely caused by the decomposition of hexamine or degradation of CTs. The characteristic peaks of 2879, 1110, and 675 cm−1 were due to the CH2 stretching, C–H out of plane bending, and N–C–N bending in the decomposed hexamine, respectively. The peaks observed at approximately 1007 and 1235 cm−1 can be attributed to the reactions of amine and ether groups of tannins and decomposed hexamine. According to Kamoun,13 the decomposed products of hexamine include imine groups. In the main reaction between decomposed hexamine and tannins, the imine group (H2C![[double bond, length as m-dash]](https://www.rsc.org/images/entities/char_e001.gif) N–CH2+) reacts with the A ring nucleophilic site to form an aminomethylene bridge, which could further bond with other CTs molecules with hydrogen bond, as a result, plenty of CTs molecules cross-linked with each other via imine groups to form a compound with high crosslinking density. The reaction mechanism of H-CT under alkaline condition is depicted in Fig. 3.
N–CH2+) reacts with the A ring nucleophilic site to form an aminomethylene bridge, which could further bond with other CTs molecules with hydrogen bond, as a result, plenty of CTs molecules cross-linked with each other via imine groups to form a compound with high crosslinking density. The reaction mechanism of H-CT under alkaline condition is depicted in Fig. 3.
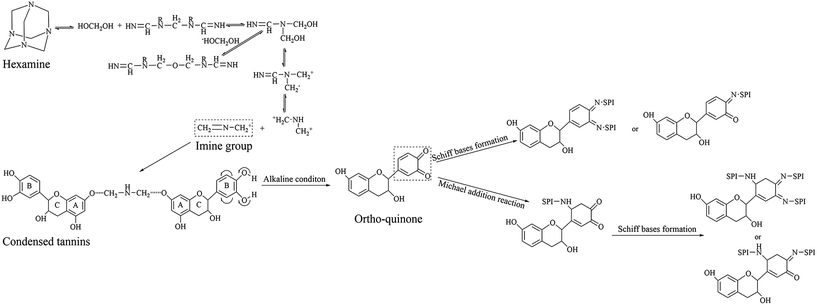 | ||
| Fig. 3 Reaction mechanism of modified CTs.13,18 | ||
3.2 Reaction mechanism of HCT-SPI adhesive
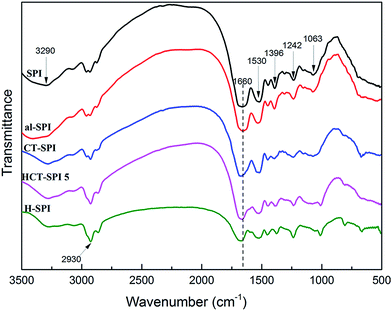
![[double bond, length as m-dash]](https://www.rsc.org/images/entities/char_e001.gif) O stretching (amide I), N–H bending (amide II), and N–H in plane and C–N stretching vibration (amide III), respectively. Peaks corresponding to the stretching vibration of COO– and C–O of hydroxyl groups bonded to carbon atoms were observed at 1396 cm−1 and 1063 cm−1 respectively.19 Because there was no obvious change between SPI and al-SPI spectra, the alkaline condition (pH = 9.0) was not the main factor influencing the chemical reaction of SPI adhesive.
O stretching (amide I), N–H bending (amide II), and N–H in plane and C–N stretching vibration (amide III), respectively. Peaks corresponding to the stretching vibration of COO– and C–O of hydroxyl groups bonded to carbon atoms were observed at 1396 cm−1 and 1063 cm−1 respectively.19 Because there was no obvious change between SPI and al-SPI spectra, the alkaline condition (pH = 9.0) was not the main factor influencing the chemical reaction of SPI adhesive.
In the HCT-SPI 5 spectrum, the absorption peaks of COO– (1396 cm−1) and C–O (1063 cm−1) decreased, indicating that hydroxyl groups bonded to carbon atoms were affected by the modified CTs. The amide I peak also shifted from 1660 to 1675 cm−1 (blue shift) in the HCT-SPI 5 spectrum, which means the absorption peak move to the shorter wavelength, and indicating that the soy protein molecule has a denser structure than native SPI.6 When soy protein molecules are crosslinked and form a network, the structure become dense and ordered, so that, the vibration of functions need more energy, which presents a blue shift. The variations in the band between 1700 and 1000 cm−1 of HCT-SPI 5 spectra was similar to that in the CT-SPI spectra, suggesting that the active carbonyls and C![[double bond, length as m-dash]](https://www.rsc.org/images/entities/char_e001.gif) C groups of ortho-quinone crosslinked into peptide chains or formed new covalent bonds with SPI molecules in alkaline pH: these reactions were responsible for forming the crosslined network structure we observed, and thus improved crosslinking density of the adhesive. The absorption peak of the –CH2 group (2930 cm−1) increased markedly as observed in the H-SPI spectrum, indicating that the decomposition of hexamine could occur during HCT-SPI 5 synthesis. That is, CTs molecules could cross-link with each other via imine groups and increase the crosslinking density of the resultant adhesive.
C groups of ortho-quinone crosslinked into peptide chains or formed new covalent bonds with SPI molecules in alkaline pH: these reactions were responsible for forming the crosslined network structure we observed, and thus improved crosslinking density of the adhesive. The absorption peak of the –CH2 group (2930 cm−1) increased markedly as observed in the H-SPI spectrum, indicating that the decomposition of hexamine could occur during HCT-SPI 5 synthesis. That is, CTs molecules could cross-link with each other via imine groups and increase the crosslinking density of the resultant adhesive.
 | ||
| Fig. 6 HCT-SPI adhesive reaction mechanism (SPI: native SPI adhesive; HCT-SPI 5: SPI 15 g, CTs 5 g, hexamine 2.5 g, pH = 9.0). | ||
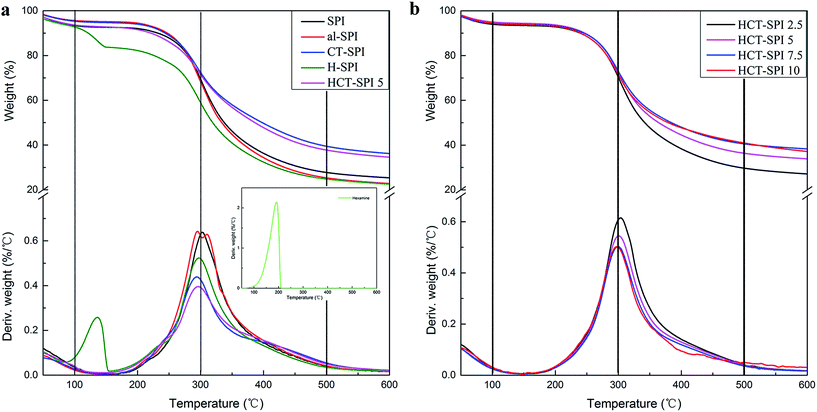
The thermal degradation process can be divided into three main stages: 0–100 °C, 100–300 °C, and 300–500 °C.20 The first stage was attributed to the evaporation of residual moisture. No degradation of soy protein was found and the weight loss was less than 10%. The second stage was attributed to micromolecule loss and unstable chemical bond decomposition. Further heating caused the degradation of soy protein involving broken intermolecular and intramolecular hydrogen bonds, electrostatic bonds, and cleavage of the covalent bonding between the peptide bonds of amino acid residues. In the native SPI-based adhesive, almost 23.8% weight loss occurred in the second stage with a peak temperature of 300 °C caused by decomposition of the most stable units. After introducing 5 g CTs and modified CTs, the weight loss of the adhesives decreased to 22.9 and 22.1%, respectively, suggesting that the CT-SPI and HCT-SPI 5 adhesives had better thermal stability than other adhesive samples. The third stage was characterized by the main skeleton structure of the adhesive degradation, including the breakage of S–S, O–N, and O–O linkages, as well as the decomposition of protein backbone peptide bonds following the generation of various gases such as CO, CO2, NH3, and H2S. The weight losses of CT-SPI and HCT-SPI 5 adhesives were 33.03 and 33.79%, respectively, marking a decrease of 20% compared to the weight loss of the native SPI adhesive (41.8%). The soy protein molecules reacted with ortho-quinone under alkaline pH conditions and formed the crosslinked protein molecule network structure, which plays a major role in the adhesive structure system and enhances the adhesive's thermostability.
According to Fig. 5b, as CTs addition in our HCT-SPI samples increased to 7.5 g, the weight loss of hydrogen bonds, disulfide, and other weak bonds decreased and thus degradation decreased, i.e., thermal stability increased. The lowest weight loss of HCT-SPI adhesives was 21.5% (HCT-SPI 7.5), after that, the weight loss would not change too much with CTs adding further, in other words, the modified CTs can enhance the thermal stability of SPI adhesive within 7.5 g CTs addition through creating a more stable crosslinked structure. During the third stage, the weight loss of these four adhesives were around 33%, which means the amount of modified CTs has little influence on the main skeleton structure of the adhesive degradation.
3.3 SEM analysis
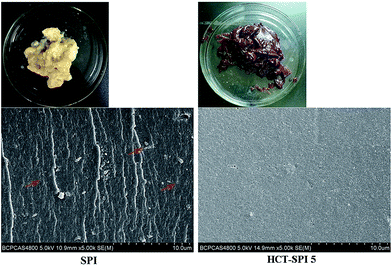
Pictures and scanning electron micrographs of the fracture surface of the cured SPI and HCT-SPI adhesives are shown in Fig. 7, here we use HCT-SPI 5 adhesive as a representative because all the HCT-SPI adhesives have similar features and fracture morphology. In the pictures, a dark red homogeneous HCT-SPI 5 adhesive not prone to gel was obtained after the introduction of modified CTs. According to SEM images, typical conchoidal fracture was presented at the surface of the native SPI; a number of cracks and holes (marked by red arrows) were observed on the fracture surface of the SPI-based adhesive sample. The entire cross-section appeared very loose and disordered. Holes and cracks resulted from water vaporization in the adhesive during the curing process which were easily intruded by moisture, reducing the water resistance of the SPI-based adhesive overall.21 After the introduction of modified CTs, cracks and wrinkles disappeared, holes decreased, and a smoother and compact cross-section was produced due to the reaction between the CTs and soy protein having formed a three-dimensional network; said network balanced the cross-linking internal structure in adhesive system, effectively preventing moisture intrusion and improving the water resistance of the adhesive.3.4 Physical characteristics of HCT-SPI adhesive
| Sample | Residual rate (%) | Apparent viscosity (mPa s) |
|---|---|---|
| a SPI-based adhesives: SPI: native SPI adhesive; al-SPI: native SPI adhesive under pH = 9.0; CT-SPI: SPI 15 g, CTs 5 g, pH = 9.0; HCT-SPI 5: SPI 15 g, CTs 5 g, hexamine 2.5 g, pH = 9.0; H-SPI: SPI 15 g, hexamine 2.5 g, pH = 9.0. HCT-SPI adhesives: the resulting adhesives were labeled according to the different CT additions. | ||
| SPI | 89.00 ± 0.03 | 30![[thin space (1/6-em)]](https://www.rsc.org/images/entities/char_2009.gif) 220 220 |
| al-SPI | 85.29 ± 0.09 | 35![[thin space (1/6-em)]](https://www.rsc.org/images/entities/char_2009.gif) 470 470 |
| CT-SPI | 89.89 ± 0.02 | 11![[thin space (1/6-em)]](https://www.rsc.org/images/entities/char_2009.gif) 370 370 |
| H-SPI | 86.80 ± 0.07 | 8601 |
| HCT-SPI 2.5 | 89.85 ± 0.05 | 23![[thin space (1/6-em)]](https://www.rsc.org/images/entities/char_2009.gif) 700 700 |
| HCT-SPI 5 | 91.82 ± 0.03 | 19![[thin space (1/6-em)]](https://www.rsc.org/images/entities/char_2009.gif) 900 900 |
| HCT-SPI 7.5 | 90.90 ± 0.04 | 17![[thin space (1/6-em)]](https://www.rsc.org/images/entities/char_2009.gif) 890 890 |
| HCT-SPI 10 | 89.87 ± 0.05 | 17![[thin space (1/6-em)]](https://www.rsc.org/images/entities/char_2009.gif) 530 530 |
![[thin space (1/6-em)]](https://www.rsc.org/images/entities/char_2009.gif) 000 mPa s.22 During the plywood manufacturing process, the coating process is ineffective if adhesive viscosity is too high; if the viscosity is too low, the adhesive will eject during hot pressing or excessively diffuse around the material surfaces. Either scenario results in low bond strength.23 As shown in Table 2, for the adhesive SPI, the high apparent viscosity (30
000 mPa s.22 During the plywood manufacturing process, the coating process is ineffective if adhesive viscosity is too high; if the viscosity is too low, the adhesive will eject during hot pressing or excessively diffuse around the material surfaces. Either scenario results in low bond strength.23 As shown in Table 2, for the adhesive SPI, the high apparent viscosity (30![[thin space (1/6-em)]](https://www.rsc.org/images/entities/char_2009.gif) 220 mPa s) caused adhesive flow and distribution issues leading to a lack of mechanical inter-locking between the veneers and adhesive during hot pressing. The apparent viscosity of HCT-SPI adhesives decreased to the range of 23
220 mPa s) caused adhesive flow and distribution issues leading to a lack of mechanical inter-locking between the veneers and adhesive during hot pressing. The apparent viscosity of HCT-SPI adhesives decreased to the range of 23![[thin space (1/6-em)]](https://www.rsc.org/images/entities/char_2009.gif) 700 to 17
700 to 17![[thin space (1/6-em)]](https://www.rsc.org/images/entities/char_2009.gif) 530 mPa s, meeting the operating viscosity limits of soy protein-based adhesives (ranging from 5000 to 25
530 mPa s, meeting the operating viscosity limits of soy protein-based adhesives (ranging from 5000 to 25![[thin space (1/6-em)]](https://www.rsc.org/images/entities/char_2009.gif) 000 mPa s) of the wood industry.22
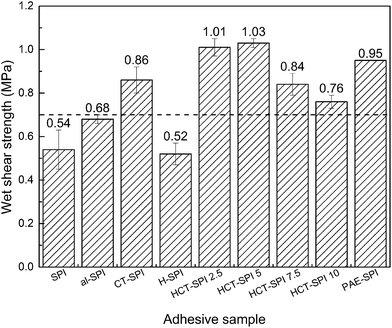
000 mPa s) of the wood industry.22Fig. 8 shows the wet shear strength of three-layer plywood bonded by different adhesives, the dashed line represents for the interior-use plywood requirement according to China National Standard (GB/T 9846.3-2004). The wet shear strength bonded by native SPI, al-SPI, and H-SPI adhesives were 0.54, 0.68, and 0.52 MPa, respectively, which failed to meet the interior-use plywood requirement (≥0.70 MPa). The wet shear strength of the plywood bonded by CT-SPI adhesive increased to 0.86 MPa, i.e., improved by 59.3% compared to the plywood bonded by SPI adhesive. This can be attributed to three factors: first, the compact network structures formed by crosslinking reaction between the CT and SPI molecules prevented water intrusion into this dense structure. Second, the extensive hydrogen bonding, pi-cation, electrostatic interactions, and ortho-quinone's covalent interactions enhanced the bond strength between the SPI-CTs adhesives and wood substance. Third, the CTs reduced the viscosity and increased the flowability of the adhesive during hot pressing, which benefited the adhesive distribution, and interlocking with the wood. The wet shear strength of the plywood bonded by HCT-SPI 2.5 and HCT-SPI 5 adhesives further increased to 1.01 and 1.03 MPa, marking an improvement by 17.5% and 19.8% compared to the plywood bonded by CT-SPI adhesives, respectively; therefore the optimal water resistance was obtained after mixing 5 g HCT to the SPI adhesive, which enhanced the wet shear strength by 90.7% compared to plywood bonded by native SPI adhesive. This wet shear strength is also higher than the soy protein adhesive modified by PAE (PAE-SPI: 0.95 MPa), which is now a popular modification method in the USA,5 indicating a higher cross-linking density in the former adhesive, which due to the addition of hexamine. This result is consistent with the reaction mechanism analysis of modified CTs described above. The wet shear strength of the HCT-SPI 7.5 and HCT-SPI 10 adhesives decreased until falling below the PAE-SPI adhesive regardless of CTs addition. This is because the lower viscosity of these adhesives caused unevenly coating issues which lead to the wet shear strength stability of the plywood. Their inferior hydrolytic stability also decreased the water resistance of the adhesive and further reduced the wet shear strength of the resultant plywood.
4. Conclusions
In the present work, CTs were first modified by hexamine and then mixed with SPI under pH = 9.0 condition to prepare the HCT-SPI adhesive. The cured adhesive presented a high crosslinking density, which was attributed to two factors: first, that the imine group (H2C![[double bond, length as m-dash]](https://www.rsc.org/images/entities/char_e001.gif) N–CH2+) generated by hexamine decomposition reacted with the nucleophilic site of the tannins A ring to form an aminomethylene bridge, the bridge had ability to bond with other CTs molecules and finally increase the crosslinking density of the resultant adhesive; and secondly, that the ortho-quinone obtained via pyrocatechol oxidation on the tannins B ring led to covalent interaction and crosslinking reaction with SPI molecules, which further increased the crosslinking density of the resultant adhesive.
N–CH2+) generated by hexamine decomposition reacted with the nucleophilic site of the tannins A ring to form an aminomethylene bridge, the bridge had ability to bond with other CTs molecules and finally increase the crosslinking density of the resultant adhesive; and secondly, that the ortho-quinone obtained via pyrocatechol oxidation on the tannins B ring led to covalent interaction and crosslinking reaction with SPI molecules, which further increased the crosslinking density of the resultant adhesive.
Among the HCT-SPI adhesives, the plywood bonded by HCT-SPI 5 adhesive showed better wet shear strength of 1.03 MPa, enhanced by 90.7% compared to plywood bonded by native SPI adhesive, which meet the interior-use plywood requirement (≥0.7 MPa). The fracture surface of HCT-SPI 5 adhesive showed a compact and homogeneous structure with relatively few pores, and also presented favorable thermal properties due to the crosslinked three-dimensional network structure formed by SPI and modified CTs. The hydrolytic stability improved by 3.2% compared to the native SPI-based adhesive, and the apparent viscosity also suitable for actual plywood industrial manufacture.
Acknowledgements
The authors are grateful for the financial support of the National Key Research and Development Program of China (2016YFD0600705)References
- N. A. Costa, J. Pereira, J. Ferra, P. Cruz, J. Martins, F. D. Magalhães, A. Mendes and L. H. Carvalho, Wood Sci. Technol., 2013, 47, 1261–1272 CrossRef CAS.
- X. Mo and X. S. Sun, J. Adhes. Sci. Technol., 2012, 27, 1–13 Search PubMed.
- J. J. Xie, N. Li and N. Zeng, Adv. Mater. Res., 2012, 580, 481–484 CrossRef CAS.
- H. Liu, C. Li and X. S. Sun, Ind. Crops Prod., 2015, 74, 577–584 CrossRef CAS.
- C. Gui, G. Wang, D. Wu, J. Zhu and X. Liu, Int. J. Adhes. Adhes., 2013, 44, 237–242 CrossRef CAS.
- J. Luo, C. Li, X. Li, J. Luo, Q. Gao and J. Li, RSC Adv., 2015, 5, 62957–62965 RSC.
- A. Pizzi, Rev. Adhes. Adhes., 2013, 1, 88–113 CrossRef CAS.
- Y. T. Deng, G. Liang, Y. Shi, H. L. Li, J. Zhang, X. M. Mao, Q. R. Fu, W. X. Peng, Q. X. Chen and D. Y. Shen, Process Biochem., 2016, 51, 1092–1099 CrossRef CAS.
- J. Cui, X. Lu, X. Zhou, L. Chrusciel, Y. Deng, H. Zhou, S. Zhu and N. Brosse, Ann. For. Sci., 2015, 72, 27–32 CrossRef.
- A. Moubarik, B. Charrier and A. Allal, et al., Eur. J. Wood Wood Prod., 2010, 68, 167–177 CrossRef CAS.
- J. V. Patel, J. Adhes. Sci. Technol., 2012, 26, 2217–2227 Search PubMed.
- R. Böhm, M. Hauptmann and A. Pizzi, et al., Int. J. Adhes. Adhes., 2016, 68, 1–8 CrossRef.
- C. Kamoun, A. Pizzi and M. Zanetti, J. Appl. Polym. Sci., 2003, 90, 203–214 CrossRef CAS.
- F. Pichelin, M. Nakatani, A. Pizzi, S. Wieland, A. Despres and S. Rigolet, For. Prod. J., 2006, 56, 31–36 CAS.
- A. Trosa and A. Pizzi, Eur. J. Wood Wood Prod., 2001, 59, 266–271 CrossRef CAS.
- A. Ballerini, A. Despres and A. Pizzi, Eur. J. Wood Wood Prod., 2005, 63, 477–478 CrossRef CAS.
- C. R. Frihart and M. J. Birkeland, ACS Symp. Ser., 2014, 1178, 167–192 CrossRef CAS.
- K. Li, X. Geng, J. Simonsen and J. Karchesy, Int. J. Adhes. Adhes., 2004, 24, 327–333 CrossRef CAS.
- J. Luo, J. Luo, X. Li, Q. Gao and J. Li, J. Appl. Polym. Sci., 2016, 133, 43362 Search PubMed.
- J. F. Su, H. Zhen, X. Y. Yuan, X. Y. Wang and L. Min, Carbohydr. Polym., 2010, 79, 145–153 CrossRef CAS.
- J. Luo, J. Luo, C. Yuan, W. Zhang, J. Li, Q. Gao and H. Chen, RSC Adv., 2015, 5, 100849–100855 RSC.
- R. Kumar, V. Choudhary, S. Mishra, I. K. Varma and M. Bo, Ind. Crops Prod., 2002, 16, 155–172 CrossRef CAS.
- J. Li, J. Luo, X. Li, Z. Yi, Q. Gao and J. Li, Ind. Crops Prod., 2015, 74, 613–618 CrossRef CAS.
- K. K. Yang, X. L. Wang and Y. Z. Wang, J. Ind. Eng. Chem., 2007, 13, 485–500 CAS.
| This journal is © The Royal Society of Chemistry 2017 |


