DOI:
10.1039/C7RA01114H
(Paper)
RSC Adv., 2017,
7, 14107-14113
Synthesis of Y2O3:Bi3+,Eu3+ nanosheets from layered yttrium hydroxide precursor and their photoluminescence properties†
Received
25th January 2017
, Accepted 24th February 2017
First published on 2nd March 2017
Abstract
We produced Y2O3:Bi3+,Eu3+ nanosheets by calcining layered yttrium hydroxide (LYH) precursor nanosheets at 800 °C for 2 h. The precursor nanosheets were synthesized from metallic chlorides dissolved in methanol, via a solvothermal reaction at 200 °C for 2.5 h. X-ray diffraction and transmission electron microscopy revealed that the LYH nanosheets were composed of crystallites with a uniform crystallographic orientation. Their sheet-like morphology and single-crystal nature remained after calcination, while the thickness of the nanosheets decreased. Their excitation spectrum was monitored at the 612 nm emission wavelength, corresponding to the 5D0 → 7F2 transition of Eu3+, and featured a broad band at 332 nm that was attributed to the 6s2 → 6s6p transition of Bi3+. The Y2O3:Bi3+,Eu3+ nanosheets therefore exhibited red emission from Eu3+ via energy transfer from Bi3+ to Eu3+ following near-UV excitation of Bi3+. The photoluminescence (PL) properties of the calcined samples were investigated with various concentrations of Bi3+ in Y2O3 nanosheets codoped with 2 at% Eu3+. The highest PL quantum yield was 23% at a Bi3+ concentration of 0.2 at%. The PL lifetimes of the calcined samples decreased with increasing Bi3+ concentration due to concentration quenching. The PL intensity increased over time under continuous excitation, which might be attributable to the photooxidation of Bi following its reduction by polyethyleneimine or methanol during the LYH synthesis.
1 Introduction
Y2O3 doped with Eu3+ (Y2O3:Eu3+) shows strong red emission under ultraviolet (UV) light via the charge–transfer transition of O2− → Eu3+.1–3 It is well known that the codopant Bi3+ acts as a sensitizer for Eu3+ via energy transfer from Bi3+ to Eu3+ following the 6s2 → 6s6p transition of Bi3+ under near-UV excitation.4–6 Y2O3 codoped with Bi3+ and Eu3+ (Y2O3:Bi3+,Eu3+) therefore shows red emission from Eu3+ excited by near-UV excitation at wavelengths of around 300–400 nm. Y2O3:Bi3+,Eu3+ has attracted attentions for an application to wavelength-conversion material in white light-emitting diodes,7 while Y2O3:Eu3+ had been used in the traditional cathode ray tube.8
In recent years, one of the potential applications of phosphors such as these, which absorb near-UV light, is as a spectral converter to improve the photoelectric conversion efficiency of solar cells.9–13 The sensitivity of commercial silicon solar modules is low in the UV region because of reflection and absorption by encapsulation materials.13 Thermalization losses following the absorption of photons with excess energy also reduce the sensitivity.14 A spectral converter converts near-UV light to visible light, from which the solar modules can generate electricity more efficiently. The fluorescent film used for spectral converters requires transparency in the visible range to prevent the loss of visible sunlight. In addition, the phosphors for spectral converters must have high stability under sunlight, i.e., light-fastness and thermal stability. Inorganic nanophosphors, such as YVO4:Bi3+,Eu3+ nanoparticles, can satisfy those requirements. YVO4:Bi3+,Eu3+ nanoparticles, which show red emission under near-UV excitation, exhibit high transparency because of their low light-scattering loss. Previously, we reported transparent films fabricated by dispersing YVO4:Bi3+,Eu3+ nanoparticles in a polyurethane matrix.15 The fabricated films could convert near-UV light to red light and had high transparency in the visible range. However, exposure to near-UV irradiation also decreased the photoluminescence (PL) intensity of the films. Under near-UV excitation, YVO4:Bi3+,Eu3+ reacted photochemically with the polyurethane matrix and with citrate ions adsorbed on the surfaces of the nanoparticles, which resulted in the reduction of V5+ to V4+.16–18
In contrast to YVO4:Bi3+,Eu3+ nanoparticles, Y2O3:Bi3+,Eu3+ is composed of chemically stable ions. In addition, Y2O3 is not semiconductive, which means it does not behave as a photocatalyst under near-UV irradiation. It is reported that Y2O3:Eu3+ nanosheets can be obtained via the calcination of yttrium hydroxides, and that they are suitable for transparent phosphor films.19 For those reasons, Y2O3:Bi3+,Eu3+ nanosheets represent a promising material for spectral converters.
Y2O3:Eu3+ nanophosphors have mostly been produced via the calcination of precursors.1,2,20–22 Recently, Y2O3:Eu3+ nanosheets prepared from layered rare earth hydroxide (LRH; RE2(OH)5A·nH2O; RE = Y, Eu, A = free anions) were reported.23 LRHs contain host layers composed of planar rare earth hydroxides, with H2O molecules and free anions intercalated in the interlayers.24 The host layer is a close-packed crystal plane, so LRHs tend to become nanosheets through crystallization along the (001) plane.25 Furthermore, [111]-oriented oxide nanosheets can be obtained from the corresponding [001]-oriented LRH nanosheets via quasi-topotactic transformation under calcinations.26 Highly [111]-oriented and transparent rare earth oxide films can be fabricated by the deposition of LRH nanosheets onto a substrate followed by calcinations.24,27,28 LRH nanosheets have drawn attention as precursors for highly oriented and transparent films.
Very recently, we fabricated Y2O3:Bi3+,Eu3+ nanosheets using nitrates as the starting reagents, and these nanosheets showed high photostability under near-UV excitation.29 In the synthesis, ethylene glycol was used as a solvent for bismuth nitrate (Bi(NO3)3·5H2O) because bismuth nitrate is not soluble in water. The concentration of Bi3+ in the Y2O3:Bi3+,Eu3+ nanosheets was lower than the nominal value, probably because of the high stability of bismuth ions coordinated with ethylene glycol. In the present work, we chose bismuth chloride (BiCl3) as an alternative bismuth source. Although bismuth chloride is only sparingly soluble in alcohols under ambient conditions, its solubility is increased under the high-temperature conditions of solvothermal synthesis. In the present work, we synthesized nanosheets of layered yttrium hydroxide codoped with Bi3+ and Eu3+ (LYH:Bi3+,Eu3+) in a mixture of chlorides in methanol and a polyethyleneimine (PEI) aqueous solution, inside an autoclave. We then synthesized Y2O3:Bi3+,Eu3+ nanosheets via the calcination of these LYH precursors, and measured their photoluminescent properties.
2 Experimental section
2.1 Materials
YCl3·6H2O (99.99%), BiCl3 (99.5%), and methanol (99.8%) were purchased from Kanto Chemical. EuCl3·6H2O (99.9%) was purchased from Soekawa Chemical. PEI (Mw = 25![[thin space (1/6-em)]](https://www.rsc.org/images/entities/char_2009.gif) 000, 99%) was purchased from Sigma-Aldrich. All reagents were used without further purification.
000, 99%) was purchased from Sigma-Aldrich. All reagents were used without further purification.
2.2 Preparation of precursors and calcined sample
YCl3·6H2O, EuCl3·6H2O, and BiCl3 (total 0.5 mmol, Eu = 2 at%, Bi = 0.1–10 at%) were added to 16 mL of methanol. Then, the mixture was added into 5 mL of 2 wt% PEI aqueous solution. The resulting suspension was placed in a Teflon vessel with a volume of 50 mL and heated in a stainless steel autoclave (Berghof, DAB-2) at 200 °C for 2.5 h. After cooling to room temperature, the precipitate was isolated by washing with ethanol, followed by 5 min of centrifugation at 11![[thin space (1/6-em)]](https://www.rsc.org/images/entities/char_2009.gif) 000 × g (10
000 × g (10![[thin space (1/6-em)]](https://www.rsc.org/images/entities/char_2009.gif) 000 rpm using a rotor with a diameter of 10 cm). This cycle of washing and centrifugation was performed twice. The precipitate was then dried at 60 °C for 5 h to obtain a precursor codoped with Bi3+ and Eu3+. An undoped precursor, as well as precursors singly doped with either Bi3+ or Eu3+, were also prepared by the same procedure. The precursors were heated to 800 °C at a heating rate of 10 °C min−1 in an air flow of 300 mL min−1, and kept at that temperature for 2 h to obtain the calcined samples.
000 rpm using a rotor with a diameter of 10 cm). This cycle of washing and centrifugation was performed twice. The precipitate was then dried at 60 °C for 5 h to obtain a precursor codoped with Bi3+ and Eu3+. An undoped precursor, as well as precursors singly doped with either Bi3+ or Eu3+, were also prepared by the same procedure. The precursors were heated to 800 °C at a heating rate of 10 °C min−1 in an air flow of 300 mL min−1, and kept at that temperature for 2 h to obtain the calcined samples.
2.3 Characterization
Thermal analysis was performed using a thermogravimetry and differential thermal analysis (TG-DTA) instrument (Thermo Plus-8120, Rigaku) at a heating rate of 10 °C min−1 in an air flow of 300 mL min−1. X-ray diffraction (XRD) patterns were measured on an X-ray diffractometer (Rint-2200, Rigaku) with a Cu Kα radiation source and monochromator. Elemental compositions were determined by the fundamental parameter method using an X-ray fluorescence (XRF) analyzer (ZFX mini II, Rigaku). Particles were observed with a transmission electron microscope (TEM; Tecnai G2 and Tecnai 12, FEI). The samples for TEM were prepared by drying a drop of a methanol dispersion of each sample on a carbon-reinforced collodion film of a copper grid. The topographies of the nanosheets were observed with an atomic force microscope (AFM; AFM5100N, Hitachi) in dynamic mode using a cantilever (Pointprobe NCHR, Nano world). The samples for AFM were prepared by drying a drop of a methanol dispersion of each sample on a negative-type silicon wafer. PL and photoluminescence excitation (PLE) spectra were recorded on a fluorescence spectrometer (FP-6500, JASCO). Changes in PL intensity during continuous near-UV excitation were measured with the same apparatus. Each spectral response was calibrated using an ethylene glycol solution of Rhodamine B (5.5 g L−1) and a standard light source (ESC-333, JASCO). The PL quantum yield (QY), Φ, was measured on the same spectrometer equipped with an integrating sphere (ISF-513, JASCO), based on the following equation:| |
 | (1) |
where Iem is the integrated emission intensity of the sample, Iex is the integrated intensity of the incident excitation light, and Iref is the integrated intensity of the excitation light reflected by the sample. A reflectance standard (Spectralon SRS-99, Labsphere) was used to determine Iex. PL decay curves were recorded on a fluorescent lifetime spectrometer (Quantaurus-Tau C11367, Hamamatsu Photonics) using a Xe flash lamp with a band path filter of 365 nm.
3 Results and discussion
3.1 Particulate and structural properties of precursors and of samples calcined at 800 °C
The TG-DTA profiles (Fig. 1) of the precursor codoped with 10 at% Bi3+ and 2 at% Eu3+ show the endothermic weight loss proceeding in three steps, which are similar to those previously observed for Ln2(OH)5NO3·nH2O.23,30 In the case of Y2(OH)5Cl·nH2O herein, the first step, occurring below 145 °C, corresponds to the evaporation of co-intercalated water. The second step, at 300 °C, corresponds to the dehydration of the host layers. The third step, at 800 °C, corresponds to the evaporation of intercalated anions. The third step occurred at a higher temperature than for Ln2(OH)5NO3·nH2O, possibly because of the higher charge density of chloride ions. All the precursors showed qualitatively similar TG-DTA thermograms (Fig. S1†).
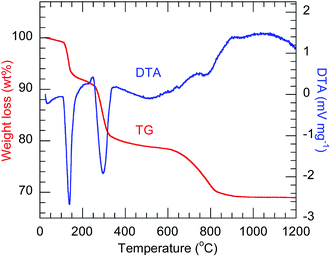 |
| | Fig. 1 TG-DTA thermograms of the 10 at% Bi3+,2 at% Eu3+-codoped precursor. | |
The XRD patterns (Fig. 2) of all the precursors were indexed to orthorhombic Y2(OH)5Cl·nH2O, as reported by Liang et al.31 The high-precision XRD profiles (Fig. S2(A) and Table S1†) indicated a shift of the (220) reflection to the lower-angle side in the doped samples. This indicates an expansion of the metal-to-metal distances in the LYH host layers23 caused by the substitution of Bi3+ and Eu3+ (with their larger ionic radii) for Y3+. The crystallite sizes of the precursors, calculated from the widths of the (220) reflection peaks using the Scherrer equation, were approximately 60–70 nm. The TEM images revealed that all the precursors obtained after autoclaving possessed an elongated sheet-like shape, as shown in panels (a)–(d) of Fig. 3. The lateral sizes of the nanosheets were on the order of hundreds of nanometers. The crystallite sizes determined from the (220) reflection peaks were thus smaller than the lateral sizes, indicating that the precursors were polycrystalline. The thickness of the nanosheets measured by AFM (Fig. S3(A)†) was 40 nm, which corresponds to ∼50 layers. Panel (b) of Fig. 4 shows a selected-area electron diffraction (SAED) image of one Bi3+,Eu3+-codoped precursor nanosheet (panel (a) of Fig. 4), which exhibits a spot pattern of LYH.32 This indicates that each nanosheet was composed of crystallites with a uniform crystallographic orientation; i.e., they had a single-crystal nature. The high-resolution TEM image of the selected nanosheet (panel (c) of Fig. 4) showed lattice fringes representing the (220) plane, with a spacing of 0.31 nm. The fast Fourier transform (FFT) image in panel (d) of Fig. 4 is similar to the SAED pattern.
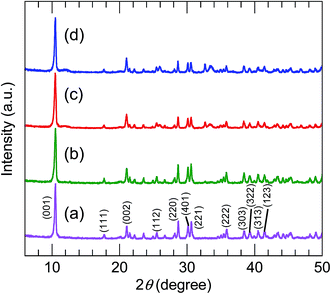 |
| | Fig. 2 XRD profiles of (a) undoped, (b) 10 at% Bi3+-doped, (c) 2 at% Eu3+-doped, and (d) 10 at% Bi3+,2 at% Eu3+-codoped precursors. | |
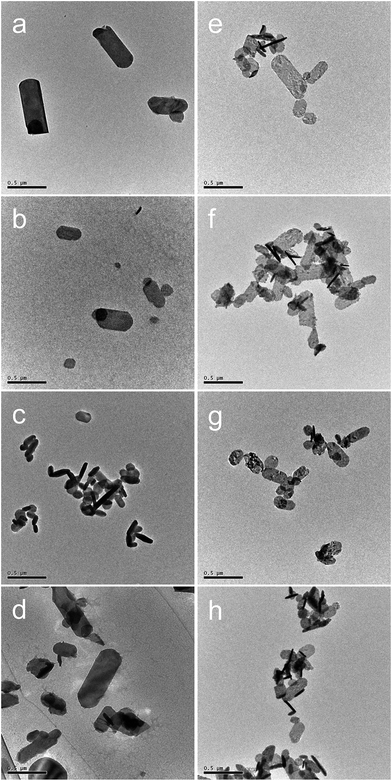 |
| | Fig. 3 TEM images of (a–d) precursors and (e–h) samples calcined at 800 °C for 2 h with different dopants: (a, e) undoped, (b, f) 10 at% Bi3+-doped, (c, g) 2 at% Eu3+-doped, and (d, h) 10 at% Bi3+,2 at% Eu3+-codoped. Scale bar: 0.5 μm. | |
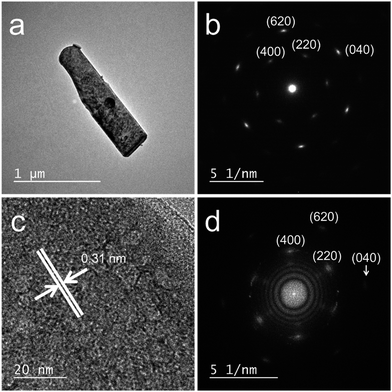 |
| | Fig. 4 (a) TEM image, (b) SAED pattern, (c) high-resolution TEM image, and (d) FFT image of a 10 at% Bi3+,2 at% Eu3+-codoped precursor nanosheet. | |
Table 1 shows the metallic compositions of the precursors as measured by XRF. The measured Eu contents of the Bi3+,Eu3+-codoped and Eu3+-doped precursors were larger than their nominal contents, while the measured Y contents of both precursors were smaller than their nominal contents. The measured Bi content of the Bi3+,Eu3+-codoped precursor, 8.4 at%, was smaller than the nominal content (10 at%), while that of the Bi3+-doped precursor, 14.3 at%, was larger than the nominal content (10 at%). In our previous research, in which metallic nitrates were used as starting materials, the Bi3+-doped and Bi3+,Eu3+-codoped precursors with nominal Bi contents of 10 at% had measured Bi contents of 2.8 and 3.4 at%, respectively,29 both smaller than those in this work. In that study, bismuth nitrate was dissolved in ethylene glycol, to allow Bi3+ to form a stable complex in solution and prevent Bi3+ ions from precipitating. In summary, the XRF results show that precursors with the desired Bi contents can be easily synthesized by our proposed method, in which metallic chlorides are used as starting materials. This method therefore enables research into the effect of the Bi content on the morphological characteristics and PL properties of nanosheets.
Table 1 Atomic compositions of precursors and calcined samples determined by XRF
| Dopant(s) |
Sample |
Y (at%) |
Bi (at%) |
Eu (at%) |
| Eu3+ |
Nominal |
98.0 |
0.0 |
2.0 |
| Precursor |
91.3 |
0.0 |
8.7 |
| Calcined |
94.4 |
0.0 |
5.6 |
| Bi3+ |
Nominal |
90.0 |
10.0 |
0.0 |
| Precursor |
85.7 |
14.3 |
0.0 |
| Calcined |
88.7 |
11.3 |
0.0 |
| Bi3+,Eu3+ |
Nominal |
88.0 |
10.0 |
2.0 |
| Precursor |
85.8 |
8.4 |
5.8 |
| Calcined |
86.2 |
9.0 |
4.8 |
The XRD patterns of the samples calcined at 800 °C (Fig. 5) were consistent with pure-phase cubic Y2O3. The high-precision XRD profiles (Fig. S2(B) and Table S2†) indicated a shift of the (222) reflection to the lower-angle side in the doped samples. This indicates an expansion of the d-spacing of the (222) facets caused by the substitution of Bi3+ and Eu3+ (with their larger ionic radii) for Y3+. The crystallite size of the nanosheets, calculated from the width of the (222) reflection peak using the Scherrer equation, was 19–20 nm. The TEM images of the samples calcined at 800 °C (panels (e)–(h) of Fig. 3) revealed that the elongated nanosheets remained unchanged after calcination, while the thickness of the nanosheets obtained by AFM (Fig. S3†) decreased from 40 nm to 25 nm. Panel (b) of Fig. 6 shows an SAED image of one Y2O3:Bi3+,Eu3+ nanosheet (panel (a) of Fig. 6), which also exhibits a spot pattern. This indicates that the nanosheets retained their single-crystal nature. The high-resolution TEM image of the selected nanosheet (panel (c) of Fig. 6) showed lattice fringes representing the (211) plane of cubic Y2O3, with a spacing of 0.43 nm. The FFT image in panel (d) of Fig. 6 also exhibits a spot pattern corresponding to cubic Y2O3.
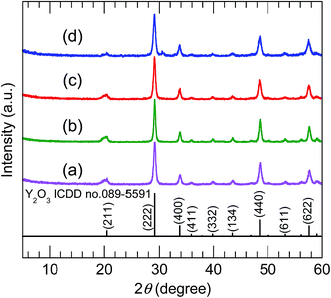 |
| | Fig. 5 XRD profiles of (a) undoped, (b) 10 at% Bi3+-doped, (c) 2 at% Eu3+-doped, and (d) 10 at% Bi3+,2 at% Eu3+-codoped calcined samples. | |
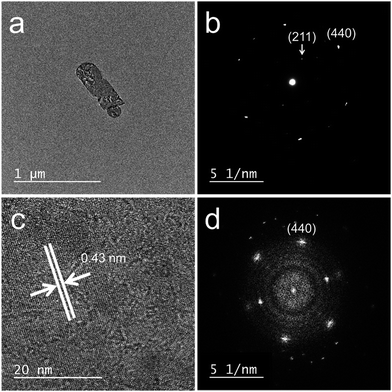 |
| | Fig. 6 (a) TEM image, (b) SAED pattern, (c) high-resolution TEM image, and (d) FFT image of a 10 at% Bi3+,2 at% Eu3+-codoped calcined nanosheet. | |
3.2 PL properties of samples calcined at 800 °C
Fig. 7 shows the PL and PLE spectra of the samples calcined at 800 °C. The Y2O3:Bi3+ nanosheets showed broad emission at 502 nm under excitation at 332 nm, arising from the transition between the 6s2 and 6s6p orbitals of Bi3+.2 For the Y2O3:Eu3+ nanosheets, sharp emission peaks corresponding to the 5D0 → 7FJ (J = 1–4) transitions of Eu3+ were observed at 593, 612, 652, and 710 nm, respectively, under excitation at 234 nm, arising from O2− → Eu3+ charge transfer.3 For the Y2O3:Bi3+,Eu3+ nanosheets, a strong 5D0 → 7F2 emission from Eu3+ was observed at 612 nm under 332 nm excitation. This arose from the energy transfer from excited Bi3+ to Eu3+.4 Y2O3 contains two distinct cation sites with different symmetries (S6 and C2). The 5D0 → 7F2 transition of Eu3+ is forbidden under inversion symmetry, so the 5D0 → 7F2 emission of the Y2O3:Bi3+,Eu3+ nanosheets must be predominantly attributed to Eu3+ ions at the C2 sites and at sites on the surface without inversion symmetry.
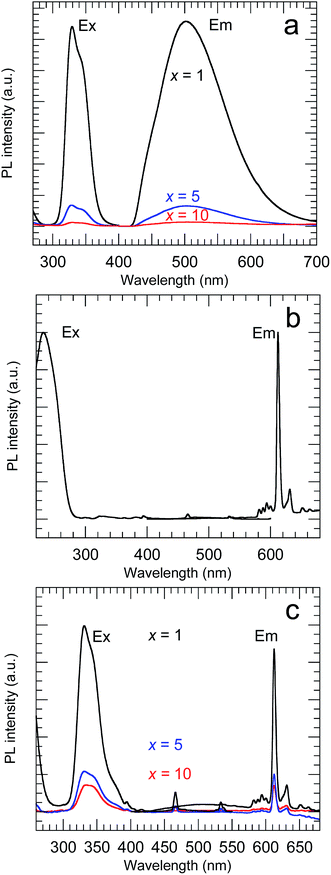 |
| | Fig. 7 PL and PLE spectra of (a) x at% Bi3+-doped, (b) 2 at% Eu3+-doped and (c) x at% Bi3+,2 at% Eu3+-codoped calcined samples. (a) λex = 332 nm and λem = 502 nm, (b) λex = 210 nm and λem = 612 nm, (c) λex = 332 nm and λem = 612 nm. | |
The PL QY of the calcined sample codoped with 10 at% Bi3+ and 2 at% Eu3+ was less than 1%. It is known that concentration quenching occurs when the Bi content exceeds a certain level. Therefore, a series of samples with lower concentrations of Bi (0.1–10 at%), each codoped with Eu at a fixed concentration of 2 at%, was synthesized. All of these samples had the same crystal structure, belonging to cubic Y2O3, and their Bi and Eu concentrations were found to be close to the nominal values (Fig. S4 and Table S3†). The samples with different Bi concentrations exhibited PL and PLE peaks with the same shapes but different intensities (Fig. S5†). Fig. 8 shows the variation in the PL QY of the calcined Bi3+,Eu3+-codoped samples as a function of the nominal Bi concentration.
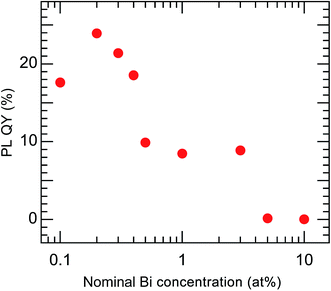 |
| | Fig. 8 PL QY of Bi3+,Eu3+-codoped calcined samples with varying nominal Bi concentrations. Eu3+ = 2 at%. λex = 332 nm and λem = 612 nm. | |
The highest PL QY was 23%, for the sample with a Bi concentration of 0.2 at%. The decay characteristics of the calcined samples also showed a dependence on the Bi3+ concentration, as shown in Fig. 9 and Table 2. The PL decay curves for the 612 nm emission from Eu3+ can be well fitted by eqn (2):
| |
I = A1![[thin space (1/6-em)]](https://www.rsc.org/images/entities/char_2009.gif) exp(−t/τ1) + A2 exp(−t/τ1) + A2![[thin space (1/6-em)]](https://www.rsc.org/images/entities/char_2009.gif) exp(−t/τ2) exp(−t/τ2)
| (2) |
where
I is the PL intensity at time
t,
τ1 and
τ2 are the short and long PL lifetimes, and
A1 and
A2 are constants. The two PL lifetime components imply two different Eu
3+ luminescence centers. As mentioned above, the most likely luminescent centers for the emission at 612 nm are Eu
3+ ions at the
C2 sites and the surface sites. Generally, the surface sites have shorter lifetimes than the lattice sites because of surface defects. Therefore,
τ1 can be assigned to the surface sites and
τ2 to the
C2 sites. The average lifetime
τ was calculated by
eqn (3):
| | |
τ = (A1τ12 + A2τ22)(A1τ1 + A2τ2)
| (3) |
τ was found to decrease with increasing Bi
3+ concentration, which confirmed that concentration quenching occurred with ≥0.2 at% Bi
3+.
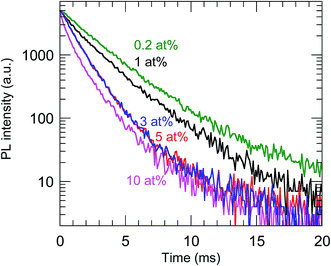 |
| | Fig. 9 PL decay curves of the calcined samples codoped with 0.2–10 at% Bi3+ and 2 at% Eu3+. λex = 365 nm and λem = 612 nm. | |
Table 2 PL lifetimes of the calcined samples codoped with 0.2–10 at% Bi3+ and 2 at% Eu3+ calculated from the decay curves
| Nominal Bi (at%) |
τ1 (ms) |
τ2 (ms) |
τ (ms) |
| 0.2 |
2.28 |
5.07 |
2.80 |
| 1.0 |
1.24 |
2.77 |
2.29 |
| 3.0 |
1.07 |
2.41 |
1.37 |
| 5.0 |
1.06 |
2.27 |
1.37 |
| 10 |
0.49 |
1.64 |
1.19 |
The time-evolution of the PL intensity of the 612 nm emission from the Y2O3:Bi3+,Eu3+ nanosheets under continuous excitation was measured to evaluate their photostability; the results are presented in Fig. 10. The initial PL intensity was highest for the calcined sample codoped with 0.2 at% Bi3+ and 2 at% Eu3+. For the samples with the low Bi contents, the PL intensity prominently increased soon after the excitation began. For example, with 0.2 at% Bi3+, the PL intensity increased to 120% of its initial value, and then remained constant. Such an increase in PL intensity under continuous excitation has, to the best of our knowledge, never been reported for Y2O3:Bi3+,Eu3+. This behavior may be attributable to the photooxidation of bismuth ions in the calcined samples. Bismuth has a variety of possible valence states, including Bi+ and Bi2+.33 If the Bi3+ ions were reduced to those species by PEI or methanol during the synthesis, the subsequent photooxidation of Bi+ or Bi2+ back to Bi3+ would increase the number of excitation centers. This may be the origin of the increased PL intensity of the samples with low Bi concentrations, such as 0.2 at%. In the samples with higher Bi concentrations, the increase in PL intensity following excitation was markedly smaller. Increasing the Bi3+ concentration would have shortened the distances between Bi3+ ions and increased the probability of energy transfer between them, a process that contributes to concentration quenching, thus suppressing the increase in PL intensity.
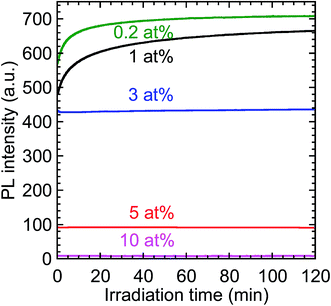 |
| | Fig. 10 Time-evolution of the PL intensity of the calcined samples codoped with 0.2–10 at% Bi3+ and 2 at% Eu3+ under continuous near-UV excitation. λex = 332 nm and λem = 612 nm. | |
4 Conclusions
We produced Y2O3:Bi3+,Eu3+ nanosheets through calcining solvothermally-synthesized LYH nanosheets. XRD and TEM analysis revealed that the LYH nanosheets were composed of crystallites with a uniform crystallographic orientation. Their sheet-like morphology and single-crystal nature remained after calcination, while the thickness of the nanosheets decreased from 40 nm to 25 nm. The PL and PLE spectra of the Y2O3:Bi3+,Eu3+ nanosheets exhibited red emission from Eu3+ following energy transfer from photoexcited Bi3+ to Eu3+. The PL QY of the Y2O3:Bi3+,Eu3+ nanosheets with fixed Eu3+ concentrations of 2 at% was dependent on the Bi content, with the highest QY being 23%, in the sample with a Bi concentration of 0.2 at%. The PL lifetimes of the calcined samples with Bi3+ concentrations of ≥0.2 at% decreased with increasing Bi concentration because of concentration quenching. However, for each sample, the PL intensity under continuous excitation increased over time. This may be attributable to the photooxidation of bismuth in low oxidation states following its reduction by PEI or methanol during the LYH synthesis.
Acknowledgements
This work was supported by Japan Society for the Promotion of Science KAKENHI Grant Number 15K04612.
References
- J. Liu, X. Zou, B. Xu, H. Luo, H. Lv, L. Han and X. Yu, CrystEngComm, 2012, 14, 3149–3155 RSC.
- A. Towata, M. Sivakumar, K. Yasui, T. Tuziuti, T. Kozuka and Y. Iida, J. Mater. Sci., 2008, 43, 1214–1219 CrossRef CAS.
- B. Lu, J. Li, T. Suzuki, M. Estili, W. Liu, X. Sun and Y. Sakka, J. Am. Ceram. Soc., 2015, 98, 1413–1422 CrossRef CAS.
- L. S. Chi, R. S. Liu and B. J. Lee, J. Electrochem. Soc., 2005, 152, J93–J98 CrossRef CAS.
- W. J. Park, S. G. Yoon and D. H. Yoon, J. Electroceram., 2006, 17, 41–44 CrossRef CAS.
- G. Ju, Y. Hu, L. Chen, X. Wang, Z. Mu, H. Wu and F. Kang, J. Electrochem. Soc., 2011, 158, J294–J299 CrossRef CAS.
- T.-S. Chan, C.-C. Kang, R.-S. Liu, L. Chen, X.-N. Liu, J.-J. Ding, J. Bao and C. Gao, J. Comb. Chem., 2007, 9, 343–346 CrossRef CAS PubMed.
- K. Ohno, Phosphors for cathode-ray tubes, Phosphor Handbook, CRC Press LLC, Boca Raton, 1999, pp. 489–498 Search PubMed.
- C. Strumpel, C. McCann, G. Beaucarne, G. Arkhipov, A. Slaoui, V. Svrcek and C. Canizo, Sol. Energy Mater. Sol. Cells, 2007, 91, 238–249 CrossRef.
- P. Chung, H. Chung and P. Holloway, J. Vac. Sci. Technol., A, 2007, 25, 61–66 CAS.
- N. Chander, A. F. Khan, P. S. Chandrasekhar, E. Thouti, S. K. Swami, V. Dutta and V. K. Komarala, Appl. Phys. Lett., 2014, 105, 033904 CrossRef.
- C. K. Huang, Y. C. Chen, W. B. Huang, T. M. Chen, K. W. Sun and W.-L. Chang, Prog. Photovoltaics. Res. Appl., 2013, 21, 1507–1513 CrossRef CAS.
- E. Klampaftis, D. Ross, K. R. McIntosh and B. S. Richards, Sol. Energy Mater. Sol. Cells, 2009, 93, 1182–1194 CrossRef CAS.
- B. M. Ende, L. Aartsa and A. Meijerink, Phys. Chem. Chem. Phys., 2009, 11, 11081–11095 RSC.
- Y. Iso, S. Takeshita and T. Isobe, J. Electrochem. Soc., 2012, 159, J72–J76 CrossRef CAS.
- S. Takeshita, H. Ogata, T. Isobe, T. Sawayama and S. Niikura, J. Electrochem. Soc., 2010, 157, J74–J80 CrossRef CAS.
- S. Takeshita, T. Watanabe, T. Isobe, T. Sawayama and S. Niikura, Opt. Mater., 2011, 33, 323–326 CrossRef CAS.
- H. Hara, S. Takeshita, T. Isobe, T. Sawayama and S. Niikura, Mater. Sci. Eng., B, 2013, 178, 311–315 CrossRef CAS.
- Q. Zhu, J.-G. Li, C. Zhi, R. Ma, T. Sasaki, J. X. Xu, C. H. Liu, X. D. Li, X. D. Sun and Y. Sakka, J. Mater. Chem., 2011, 21, 6903–6908 RSC.
- H. Zhu, Y. Ma, H. Yang, P. Zhu, J. Du, C. Ji and D. Hou, J. Solid State Chem., 2010, 150, 1208–1212 CrossRef CAS.
- A. P. Jadhav, C. W. Kim, H. G. Cha, A. U. Pawar, N. A. Jadhav, U. Pal and Y. S. Kang, J. Phys. Chem. C, 2009, 113, 13600–13604 CAS.
- Q. Zhu, J.-G. Li, R. Ma, T. Sasaki, X. Yang, X. Li, X. Sun and Y. Sakka, J. Solid State Chem., 2012, 192, 229–237 CrossRef CAS.
- Q. Zhu, J.-G. Li, C. Zhi, X. Li, X. Sun, Y. Sakka, D. Golberg and Y. Bando, Chem. Mater., 2010, 22, 4204–4213 CrossRef CAS.
- F. Geng, H. Xin, Y. Matsushita, R. Ma, M. Tanaka, F. Izumi, N. Iyi and T. Sasaki, Chem.–Eur. J., 2008, 14, 9255–9260 CrossRef CAS PubMed.
- X. Wu, J.-G. Li, Q. Zhu, W. Liu, J. Li, X. Li, X. Sun and Y. Sakka, J. Mater. Chem. C, 2015, 3, 3428–3437 RSC.
- L. Hu, R. Ma, T. C. Ozawa and T. Sasaki, Inorg. Chem., 2010, 49, 2960–2968 CrossRef CAS PubMed.
- L. Hu, R. Ma, T. C. Ozawa and T. Sasaki, Angew. Chem., Int. Ed., 2009, 48, 3846–3849 CrossRef CAS PubMed.
- Q. Zhu, J. G. Li, X. Li, X. Sun, Y. Qi, M. Zhu and Y. Sakka, Sci. Technol. Adv. Mater., 2014, 15, 14203 CrossRef PubMed.
- T. Matsunaga, S. Takeshita and T. Isobe, J. Lumin., 2015, 165, 62–67 CrossRef CAS.
- S. S. Lee, B. I. Lee, S. J. Kim, S. H. Byeon and J. K. Kang, Inorg. Chem., 2012, 51, 10222–10232 CrossRef CAS PubMed.
- J. Liang, R. Ma and T. Sasaki, Dalton Trans., 2014, 43, 10355–10364 RSC.
- A. D. Yapryntsev, A. E. Baranchikov, L. S. Skogareva, A. E. Goldt, I. P. Stolyarov, O. S. Ivanova, V. V. Kozik and V. K. Ivanov, CrystEngComm, 2015, 17, 2667–2674 RSC.
- R. Cao, M. Peng and J. Qiu, Opt. Express, 2012, 20, A977–A983 CrossRef PubMed.
Footnote |
| † Electronic supplementary information (ESI) available: TG-DTA thermograms of undoped, 10 at% Bi3+-doped, and 2 at% Eu3+-doped precursors (Fig. S1); high-precision (220) XRD peaks and (222) XRD peaks of undoped, 10 at% Bi3+-doped, 2 at% Eu3+-doped, and Bi3+,Eu3+-codoped LYH precursors and Y2O3 samples, respectively (Fig. S2); calculated d-spacings and crystallite sizes from Fig. S2 (Tables S1 and S2); AFM images of an LYH precursor nanosheet and a Y2O3 nanosheet, codoped with 10 at% Bi3+ and 2 at% Eu3+ (Fig. S3); XRD profiles, atomic compositions determined by XRF, and PL and PLE spectra of x at% Bi3+,2 at% Eu3+-codoped Y2O3 samples (Fig. S4, Table S3, and Fig. S5, respectively). See DOI: 10.1039/c7ra01114h |
|
| This journal is © The Royal Society of Chemistry 2017 |
Click here to see how this site uses Cookies. View our privacy policy here.  Open Access Article
 * and
Tetsuhiko Isobe*
![[thin space (1/6-em)]](https://www.rsc.org/images/entities/char_2009.gif) 000, 99%) was purchased from Sigma-Aldrich. All reagents were used without further purification.
000, 99%) was purchased from Sigma-Aldrich. All reagents were used without further purification.
![[thin space (1/6-em)]](https://www.rsc.org/images/entities/char_2009.gif) 000 × g (10
000 × g (10![[thin space (1/6-em)]](https://www.rsc.org/images/entities/char_2009.gif) 000 rpm using a rotor with a diameter of 10 cm). This cycle of washing and centrifugation was performed twice. The precipitate was then dried at 60 °C for 5 h to obtain a precursor codoped with Bi3+ and Eu3+. An undoped precursor, as well as precursors singly doped with either Bi3+ or Eu3+, were also prepared by the same procedure. The precursors were heated to 800 °C at a heating rate of 10 °C min−1 in an air flow of 300 mL min−1, and kept at that temperature for 2 h to obtain the calcined samples.
000 rpm using a rotor with a diameter of 10 cm). This cycle of washing and centrifugation was performed twice. The precipitate was then dried at 60 °C for 5 h to obtain a precursor codoped with Bi3+ and Eu3+. An undoped precursor, as well as precursors singly doped with either Bi3+ or Eu3+, were also prepared by the same procedure. The precursors were heated to 800 °C at a heating rate of 10 °C min−1 in an air flow of 300 mL min−1, and kept at that temperature for 2 h to obtain the calcined samples.


![[thin space (1/6-em)]](https://www.rsc.org/images/entities/char_2009.gif) exp(−t/τ1) + A2
exp(−t/τ1) + A2![[thin space (1/6-em)]](https://www.rsc.org/images/entities/char_2009.gif) exp(−t/τ2)
exp(−t/τ2)


