 Open Access Article
Creative Commons Attribution 3.0 Unported Licence
Co-delivery of carboplatin and paclitaxel via cross-linked multilamellar liposomes for ovarian cancer treatment†
Xiaoyang Zhang‡
a,
Yarong Liu‡a,
Yu Jeong Kimb,
John Maca,
Rachel Zhuangc and
Pin Wang *abc
*abc
aMork Family Department of Chemical Engineering and Materials Science, University of Southern California, 3710 McClintock Ave., RTH509, Los Angeles, CA 90089, USA. E-mail: pinwang@usc.edu; Fax: +1-213-740-8053; Tel: +1-213-740-0780
bDepartment of Pharmacology and Pharmaceutical Sciences, University of Southern California, Los Angeles, CA 90089, USA
cDepartment of Biomedical Engineering, University of Southern California, Los Angeles, CA 90089, USA
First published on 3rd April 2017
Abstract
Carboplatin (CPT) and paclitaxel (PTX) used in combination is one of the most effective treatments for ovarian cancer. However, the traditional combination methods used to co-administrate CPT and PTX showed limited clinical efficacy due to their distinct pharmacokinetics. Although much effort has been devoted to developing nanoparticles capable of encapsulating drugs with different lipophilicites, co-delivery of carboplatin with paclitaxel by a single nanoparticle has rarely been reported. Here, we encapsulated and delivered this drug combination to ovarian cancer cells at a controlled ratio by a previously reported crosslinked multilamellar liposome vesicle (cMLV). A 1![[thin space (1/6-em)]](https://www.rsc.org/images/entities/char_2009.gif) :
:![[thin space (1/6-em)]](https://www.rsc.org/images/entities/char_2009.gif) 1 CPT/PTX molar ratio for cMLVs (CPT/PTX) combination treatment was found to induce the strongest anti-tumor synergism and to target ALDH+ cancer stem cells (CSC) in vitro. Moreover, we demonstrated that this co-encapsulation strategy reduced systemic cytotoxicity and resulted in a stronger anti-tumor effect when compared to free drug combinations and individual drug-loaded cMLVs in an OVCAR8 ovarian cancer xenograft mouse model. Thus, this study suggests a potentially promising combination therapy for ovarian cancer in clinical practice.
1 CPT/PTX molar ratio for cMLVs (CPT/PTX) combination treatment was found to induce the strongest anti-tumor synergism and to target ALDH+ cancer stem cells (CSC) in vitro. Moreover, we demonstrated that this co-encapsulation strategy reduced systemic cytotoxicity and resulted in a stronger anti-tumor effect when compared to free drug combinations and individual drug-loaded cMLVs in an OVCAR8 ovarian cancer xenograft mouse model. Thus, this study suggests a potentially promising combination therapy for ovarian cancer in clinical practice.
Introduction
Ovarian cancer is the sixth most common cancer and the seventh most common cause of cancer deaths in women.1 Currently, chemotherapy based on platinum drugs (carboplatin or cisplatin) in combination with paclitaxel is a standard treatment for patients with ovarian cancer,2 because platinum drugs and paclitaxel trigger different apoptosis signaling pathways in ovarian cancer cells.3–5 Moreover, platinum drugs trigger cell apoptosis by crosslinking DNA,6 whereas paclitaxel does so by inducing cell cycle arrest at the G2/M phase via binding to the beta-tubulin subunit of microtubules. Recent work has proven that the co-administration of platinum drugs with paclitaxel results in a synergistic effect in cancer treatment due to their distinct mechanisms of action.7 In this study, carboplatin was co-administered with paclitaxel because of its lack of renal toxicity, unlike the widely used cisplatin.8 Furthermore, for a comparable level of treatment effectiveness, it has been determined that the combination of carboplatin and paclitaxel yields a more tolerable quality of life for patients than the combination of cisplatin and paclitaxel. Therefore, the combination of carboplatin and paclitaxel should be regarded as a very important regimen for treating patients with ovarian cancer9 and even platinum-sensitive, recurrent ovarian cancer.1However, the clinical results are hindered by the distinct pharmacokinetics and biodistributions of combined carboplatin and paclitaxel due to their different lipophilicities. Paclitaxel is highly hydrophobic and must be administered with a combination of dehydrated alcohol and Cremophor EL (polyoxyethylated castor oil) as an adjuvant, which can lead to serious side effects including neurotoxicity, nephrotoxicity and hypersensitivity reactions.10 Moreover, this administration method may hinder the accumulation of paclitaxel within tumors and compromise its in vivo efficacy due to its poor pharmacodynamic (cytochrome P450 metabolism) and pharmacokinetic profiles (t1/2 in human: 2.09 h).11 In contrast, carboplatin is eliminated and metabolized much slower in vivo because of its heavy metal backbone,12 which could lead to long-term. However, the biotransformations of carboplatin, which form in the bloodstream after hydrolysis and binding to plasma proteins in the plasm, are directly associated with its acute and chronic hematopoietic toxicity, hepatotoxicity, and neurotoxicity.13 Thus, a more effective paclitaxel/carboplatin combination therapy is needed to administer paclitaxel without any harmful organic solvents, improve its bioavailability, and increase its exposure to tumor cells, while simultaneously minimizing the acute and cumulative long-term chronic toxic side effects of carboplatin. This can be achieved by encapsulating both drugs in a nanoparticle drug delivery system that allows for the pharmacokinetic and pharmacodynamics behaviors of both drugs to be determined by the pharmacokinetics and pharmacodynamics of the nanoparticles.
Over the past few decades, significant effort has been devoted to developing nanotechnology for drug delivery since it allows for targeted drug delivery to tissues of interest and therefore, a significant decrease in toxic, off-target side effects.14–17 A variety of nanocarriers have been developed for the delivery of either paclitaxel or carboplatin.18–20 However, encapsulating these two drugs, which have distinct physiochemical properties, into a single nanocarrier remains challenging. Even though a few studies of the co-delivery of cisplatin with paclitaxel have been published recently,21–23 research on the co-delivery of carboplatin with paclitaxel has rarely been reported.
In this study, we investigated whether the cMLVs reported in our previous studies24,25 could achieve the synergistic combinatorial delivery of hydrophobic paclitaxel and hydrophilic carboplatin. Both paclitaxel and carboplatin achieved a high level of encapsulation efficiency and a controlled release profile in cMLVs. The flow cytometry and cell cytotoxicity results determined a synergistic drug ratio, which was further used in ovarian cancer mouse models. Furthermore, in vivo studies revealed that the co-delivery of paclitaxel and carboplatin via cMLVs could induce a potent antitumor effect while decreasing the systemic toxicity and out-performing free drug combination and single drug-loaded cMLVs. These results further demonstrate the potential of cMLVs as a novel drug delivery system for the co-localized delivery of drug combinations in cancer therapy.
Experimental
Cell lines, reagents and mice
OVCAR8 and NCI/ADR-RES cell lines were kindly provided as gifts by Dr Nouri Neamati (University of Southern California, School of Pharmacy, and Los Angeles, CA) and maintained in RPMI-1640 supplemented with 10% fetal bovine serum (FBS) and 2 mM of L-glutamine in a 5% CO2 environment.All lipids were obtained from NOF Corporation (Japan): 1,2-dioleoyl-sn-glycero-3-phosphocholine (DOPC), 1,2-dioleoyl-sn-glycero-3-phospho-(10-rac-glycerol) (DOPG), and 1,2-dioleoyl-sn-glycero-3-phosphoethanolamine-N-[4-(p-maleimidophenyl) butyramide (maleimide-headgroup lipid, MPB-PE). Carboplatin and paclitaxel were purchased from Sigma-Aldrich (St. Louis, MO).
BALB/c and athymic mice (Charles River Laboratories) were used for in vivo toxicity and anti-tumor studies. Mice were held under specific pathogen-reduced conditions in the Animal Facility of the University of Southern California (Los Angeles, CA, USA). All experiments were performed in accordance with the guidelines set by the National Institute of Health and were approved by the Institutional Animal Care and Use Committee of the University of Southern California.
Preparation of cMLVs
Liposomes were prepared based on the conventional dehydration–rehydration method. All lipids were combined in chloroform, at a molar lipid ratio of DOPC–DOPG–MPB = 4![[thin space (1/6-em)]](https://www.rsc.org/images/entities/char_2009.gif) :
:![[thin space (1/6-em)]](https://www.rsc.org/images/entities/char_2009.gif) 1
1![[thin space (1/6-em)]](https://www.rsc.org/images/entities/char_2009.gif) :
:![[thin space (1/6-em)]](https://www.rsc.org/images/entities/char_2009.gif) 5, and the chloroform in the lipid mixture was evaporated under argon gas. The lipid mixture was further dried under vacuum overnight to form dried thin lipid films. In order to prepare cMLVs (CPT), cMLVs (PTX) and cMLVs (CPT + PTX), paclitaxel was mixed with the lipid mixture in organic solvent before formation of the dried thin lipid films. The resultant dried film was hydrated in 10 mM bis–tris propane at pH 7.0 with carboplatin by vigorous vortexing every 10 min for 1 h. Four cycles of 15 s sonication were then applied (Misonix Microson XL2000, Farmingdale, NY) on ice at 1 min intervals for each cycle. To induce divalent-triggered vesicle fusion, MgCl2 was added at a final concentration of 10 mM. The resulting multilamellar vesicles were further cross-linked by addition of dithiothreitol (DTT, Sigma-Aldrich), at a final concentration of 1.5 mM for 1 h at 37 °C. The resulting vesicles were collected by centrifugation at 14
5, and the chloroform in the lipid mixture was evaporated under argon gas. The lipid mixture was further dried under vacuum overnight to form dried thin lipid films. In order to prepare cMLVs (CPT), cMLVs (PTX) and cMLVs (CPT + PTX), paclitaxel was mixed with the lipid mixture in organic solvent before formation of the dried thin lipid films. The resultant dried film was hydrated in 10 mM bis–tris propane at pH 7.0 with carboplatin by vigorous vortexing every 10 min for 1 h. Four cycles of 15 s sonication were then applied (Misonix Microson XL2000, Farmingdale, NY) on ice at 1 min intervals for each cycle. To induce divalent-triggered vesicle fusion, MgCl2 was added at a final concentration of 10 mM. The resulting multilamellar vesicles were further cross-linked by addition of dithiothreitol (DTT, Sigma-Aldrich), at a final concentration of 1.5 mM for 1 h at 37 °C. The resulting vesicles were collected by centrifugation at 14![[thin space (1/6-em)]](https://www.rsc.org/images/entities/char_2009.gif) 000g for 4 min and then washed twice with phosphate-buffered saline (PBS). For pegylation of cMLVs, the particles were incubated with 1 μmol of 2 kDa PEG-SH (Laysan Bio Inc. Arab, AL) for 1 h at 37 °C. The particles were then centrifuged and washed twice with PBS. The final products were stored in PBS at 4 °C.
000g for 4 min and then washed twice with phosphate-buffered saline (PBS). For pegylation of cMLVs, the particles were incubated with 1 μmol of 2 kDa PEG-SH (Laysan Bio Inc. Arab, AL) for 1 h at 37 °C. The particles were then centrifuged and washed twice with PBS. The final products were stored in PBS at 4 °C.
Characterization of cMLVs
The hydrodynamic size of cMLVs was measured by dynamic light scattering (Wyatt Technology, Santa Barbara, CA). The particles were suspended in filtered water, vortexed and sonicated prior to analysis.In vitro encapsulation and release profiles
Concentrations of CPT and PTX were then measured by C-18 reverse-phase high-performance liquid chromatography (RP-HPLC) (Beckman Coulter, Brea, CA) at 227 nm. To study the encapsulation capacity of cMLVs corresponding to CPT, cMLVs (CPT) and cMLVs (CPT + PTX) were collected and washed twice with PBS, followed by lipid extraction of vesicles with 1% Triton X-100 treatment. To determine the encapsulation capacity of cMLVs with respect to PTX, the cMLVs (PTX) and cMLVs (CPT + PTX) suspensions were diluted by adding water and acetonitrile for a total volume of 0.5 mL. Extraction of paclitaxel was accomplished by adding 5 mL of tert-butyl methyl ether and vortex-mixing the sample for 1 min. The mixtures were centrifuged, and the organic layer was transferred into a glass tube and evaporated to dryness under argon. Buffer A (95% water, 5% acetonitrile) was used to rehydrate the glass tube. To test CPT and PTX concentration, 1 mL of the solution was injected into a C18 column, and CPT and PTX were detected at 227 nm after different retention times (flow rate 1 mL min−1). To obtain the release behavior of CPT and PTX from cMLVs, the releasing media was removed from cMLVs incubated in 10% FBS-containing media at 37 °C and replaced with fresh media daily. The concentration of CPT and PTX in the removed media was quantified by HPLC.In vitro cytotoxicity and data analysis
To evaluate the cytotoxicity, the viability of cell treated by drug-loaded cMLVs was assessed using the Cell Proliferation Kit II (XTT assay) from Roche Applied Science according to the manufacturer's instruction.The OVCAR8 and NCI/ADR-RES cells in 100 μL of 10% FBS-containing media were seeded in the well (5 × 10³ cells per well) of a 96-well plate and incubated at 37 °C for 6 h. The cells were then exposed to a series of concentrations of free drugs and drug-loaded cMLVs, at different molar ratios of combined drugs for 48 h. 50 μL of XTT labeling mixture (Roche Applied Science) was then added. After incubation at 37 °C for 4 h, the absorbance of the solution was measured at 570 nm using a microplate reader (Molecular Devices) to determine the OD value. The data was given as mean ± standard deviation (SD) based on 3 independent measurements. The cell viability was calculated by subtracting absorbance values obtained from media-only wells from drug-treated wells and then normalizing to the control cells without drugs.26 The cell viability was calculated as follows: cell viability = OD treated/OD control × 100%, where OD treated was obtained from the cells treated by a particular agent, and OD control was obtained from the cells without any treatments. The fraction of cells affected (fa) at each drug concentration was subsequently determined for each well. The data was analyzed by nonlinear regression to get the IC50 value. The median-effect method assesses the drug–drug interaction by a term called the “combination index” (CI), which is based on the concentration–response relationship. CI was calculated by the equation: CI = D1/Dm1+D2/Dm2,20 where D1 and D2 are the doses of drug 1 and drug 2 that in combination produce some specified effect (e.g., 50% inhibition of cells), and Dm1 and Dm2 are the drug doses that have the same effect when administered singly. The CI values lower than, equal to, and higher than 1 denote synergism, additivity, and antagonism, respectively.
Flow cytometric analysis
FACS analysis was performed MACS Quant analyzer (Miltenyi Biotec Inc., San Diego, CA). OVCAR8 and NCI/ADR-RES cells were seeded into 6-well plates at 6 × 10⁶ cells per well. When cells reached about 70% confluence, they were incubated with PBS control, cMLVs (10 μM CPT), cMLVs (10 μM PTX), cMLVs (8 μM CPT + 2 μM PTX), cMLVs (5 μM CPT + 5 μM PTX) and cMLVs (2 μM CPT + 8 μM PTX) for 24 h. For ALDH staining, OVCAR8 and NCI/ADR-RES were harvested, and an aldefluor kit was used according to the manufacturer's instructions (Stem Cell Technologies, Vancouver, Canada). For analysis of autofluorescent subpopulations, OVCAR8 and NCI/RES-ADR cells were harvested and detected using SORP LSR II (BD Biosciences, San Jose, CA). Autofluorescent cells are excited with a 488 nm blue laser and best selected as the intersection with filters 525/50 and 575/26. A proper distance between gates for autofluorescent and non-autofluorescent cells is required.27Evaluation of the acute toxicity
Six-week-old female BALB/c mice were randomized into 5 groups (n = 3) based on body weight. All the mice were administered with PBS, CPT + PTX (10 mg + 20 mg kg−1 and 15 mg + 30 mg kg−1) and cMLVs (CPT + PTX) (10 mg + 20 mg kg−1 and 15 mg + 30 mg kg−1) through intravenous injection once. After the injection, the body weight and physical states of the mice were monitored every day. On day 7 after injection, animals were euthanized via CO2 overdose, livers were harvested and fixed in 4% paraformaldehyde. Then livers and kidneys were frozen and cut into sections and stained with hematoxylin and eosin (H&E) for pathology analysis.In vivo antitumor activity
Athymic mice were inoculated subcutaneously with 5 × 10⁵ OVCAR-8 cells in logarithmic growth phase from cell culture. Tumor volume was calculated according to the formula tumor volume (in millimeters cubed) = D × d2/2, where D and d are the longest and shortest diameters, respectively. The tumors were allowed to grow for 2 month to a volume of ∼100 mm3 before treatment. The mice were injected intravenously through the tail vein with PBS, cMLVs (1.8 mg kg−1 CPT), cMLVs (4 mg kg−1 PTX), cMLVs (1.8 mg kg−1 CPT + 4 mg kg−1 PTX) every 3 days for four rounds (four mice per group). Tumor growth and body weight were monitored until the end of the experiment. The length and width of the tumor masses were measured with a fine caliper every 3 days after injection.Immunohistochemistry of tumors and confocal imaging
OVCAR8 ovarian tumors were harvested, fixed, frozen, and sectioned. Frozen sections were treated using the In Situ Cell Death Detection kit (Roche, Indianapolis, Indiana) as recommended by the manufacturers. Fluorescence images were taken using a Yokogawa confocal scanner system (Solamere Technology Group, Salt Lake City, UT) with a Nikon Eclipse Ti-E microscope. Illumination powers at 405, 491, 561, and 640 nm solid-state laser lines were provided by an AOTF (acousto-optical tunable filter)-controlled laser-merge system with 50 mW for each laser.Statistics
Data is presented as mean ± standard error (SEM). Statistical analyses to compare two groups and multiple groups were performed by student's t-test and one-way analysis of variance (ANOVA) respectively.Results and discussions
Drug encapsulation and release from cMLVs
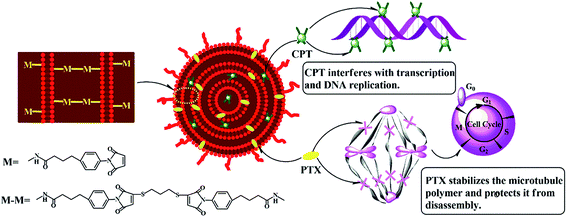
As shown in Scheme 1, the hydrophilic drug, carboplatin and hydrophobic drug, paclitaxel were encapsulated into the aqueous core and lipid membranes of cMLVs respectively. As a result, cMLVs could encapsulate binary therapeutic drugs with very different chemo-physical properties and mechanisms of action into a single nanocarrier, so as to synergistically enhance the efficacy of treatment. Furthermore, cMLVs' dispersion could be stabilized by PEG-coating and neutral zeta potential (Table S1†) which minimizes the interactions between the cMLVs and blood components.As shown in Table 1, the single drug encapsulation capacity for CPT and PTX were 13.2 w/w% and 29.3 w/w% respectively. Interestingly, the binary drug-loaded cMLVs showed similar encapsulation capacities compared to their single drug-loaded formulation. Moreover, Table 1 shows that there is no significant difference in size between single drug-loaded cMLVs and binary drug-loaded cMLVs. These results could be explained by the fact that different compartments of cMLVs were occupied by CPT and PTX. Therefore, we have confirmed that loading multiple drugs into cMLVs has no effect on the encapsulation capacity of the individual drugs. In addition, sustained release behaviors were obtained from cMLV for both CPT and PTX (Fig. S1†).
| Formulation | Encapsulation capacity (w/w%) | Diameter (nm) | PDI | |
|---|---|---|---|---|
| CPT | PTX | |||
| cMLVs (CPT) | 13.2 ± 0.3 | — | 206 ± 9.68 | 0.10 |
| cMLVs (PTX) | — | 29.3 ± 0.7 | 212 ± 8.13 | 0.08 |
| cMLVs (CPT + PTX) | 12.8 ± 0.2 | 28.7 ± 0.5 | 225 ± 10.97 | 0.11 |
In vitro cytotoxicity of drug-loaded cMLVs
The cytotoxicity of the free drugs and their cMLV formulations was determined in human ovarian carcinoma OVCAR8 cells with an XTT assay. Because previous studies have reported that the drug combination could have a positive effect on overcoming multi-drug resistance in cancer cells,5,28 this study also reports the apoptotic effects of each treatment regimen on drug resistant, NCI/ADR RES cells. All the calculated IC50 values are summarized in Table 2. As shown in Table 2 and Fig. 1A and B, the single drug PTX (IC50, 5.85 μM, 9.86 μM) is more potent at inducing apoptosis than the single drug CPT (IC50, 21.09 μM, 79.36 μM) against OVCAR8 and NCI/ADR-RES cells. Afterwards, the anticancer efficacies of the free CPT + PTX drug combination and cMLVs (CPT + PTX) were evaluated. Both CPT + PTX (Fig. 1A and C) and cMLVs (CPT + PTX) (Fig. 1B and D) exhibited an enhancement of combination potency. The IC50s of free CPT alone and free PTX alone against OVCAR8 were 21.09 μM and 5.85 μM respectively, while the IC50s of CPT (1.52 μM) and PTX (1.52 μM) in free CPT + PTX combination were both reduced. Moreover, in contrast to the IC50s of cMLVs (CPT) (16.54 μM) and cMLVs (PTX) (2.69 μM) against OVCAR8, the IC50s of CPT and PTX in the cMLVs (CPT + PTX) formulation were reduced even more significantly. These data suggest synergistic cytotoxicity in free CPT + PTX combination against OVCAR8 cells, and the synergistic effect is more evident when the component drugs are encapsulated into one nanocarrier due to the nanocarrier's ability to ensure that both of the component drugs are delivered into the cell at a desired ratio.25 A similar synergistic effect was also observed for NCI/ADR-RES cells. Importantly, as shown in Fig. 1, the CPT + PTX combination delivery via cMLVs exhibits improved potency compared to the free CPT + PTX combination against OVCAR8 and NCI/ADR-RES cells. The enhanced synergism of cMLVs (CPT + PTX) is attributed to the cMLVs' morphology since their rate of endocytosis is often more efficient than the rate of passive diffusion for small molecular drugs.29 Additionally, it has been determined that the drug unloaded cMLVs do not exhibit any cytotoxicity to both OVCAR8 and NCI/ADR-RES (Fig. S2†).| Formulation CPT/PTX (molar ratio) | OVCAR8 | NCI/ADR-RES | ||
|---|---|---|---|---|
| IC50 (μM) | CI50 | IC50 (μM) | CI50 | |
| CPT | 21.09 | — | 79.36 | — |
| PTX | 5.85 | — | 9.86 | — |
| CPT + PTX | 1.52/1.52 | 0.33 | 7.13/7.13 | 0.81 |
| cMLVs (CPT) | 16.54 | — | 18.88 | — |
| cMLVs (PTX) | 2.69 | — | 8.44 | — |
| cMLVs (4CPT + PTX) | 0.92/0.23 | 0.14 | 6.05/1.51 | 0.49 |
| cMLVs (CPT + PTX) | 0.29/0.29 | 0.13 | 1.65/1.65 | 0.28 |
| cMLVs (CPT + 4PTX) | 0.16/0.63 | 0.24 | 0.93/3.73 | 0.50 |
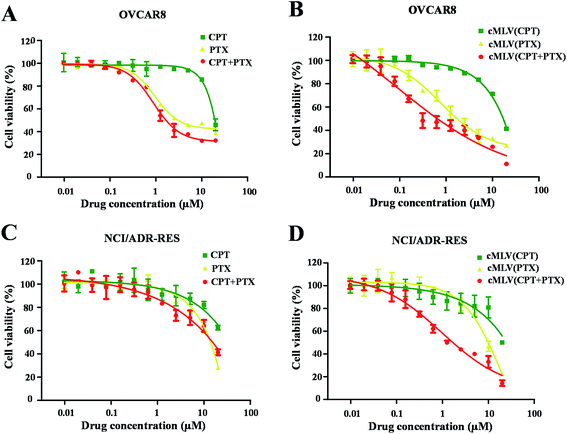 | ||
| Fig. 1 In vitro cytotoxicity profiles of CPT/PTX and cMLVs (CPT/PTX) against OVCAR8 (A and B) and NCI/ADR-RES (C and D) cells. | ||
It has been widely reported that the dose ratio of the drug combination plays a very important role in the therapy's combination effect, synergy, additivity, and antagonism.30 In order to determine the optimal ratio that can induce the strongest synergy, the cytotoxicity of cMLV-encapsulated CPT and PTX combinations at three different molar ratios (CPT![[thin space (1/6-em)]](https://www.rsc.org/images/entities/char_2009.gif) :
:![[thin space (1/6-em)]](https://www.rsc.org/images/entities/char_2009.gif) PTX, 1
PTX, 1![[thin space (1/6-em)]](https://www.rsc.org/images/entities/char_2009.gif) :
:![[thin space (1/6-em)]](https://www.rsc.org/images/entities/char_2009.gif) 4, 1
4, 1![[thin space (1/6-em)]](https://www.rsc.org/images/entities/char_2009.gif) :
:![[thin space (1/6-em)]](https://www.rsc.org/images/entities/char_2009.gif) 1, 4
1, 4![[thin space (1/6-em)]](https://www.rsc.org/images/entities/char_2009.gif) :
:![[thin space (1/6-em)]](https://www.rsc.org/images/entities/char_2009.gif) 1) were assessed in OVCAR8 and NCI/ADR-RES cells. Table 2 displays the IC50 of the binary drugs-loaded cMLVs at the three different molar ratios. As shown in Fig. 2, the cytotoxicity of cMLVs (CPT/PTX) with CPT/PTX ratios at 1
1) were assessed in OVCAR8 and NCI/ADR-RES cells. Table 2 displays the IC50 of the binary drugs-loaded cMLVs at the three different molar ratios. As shown in Fig. 2, the cytotoxicity of cMLVs (CPT/PTX) with CPT/PTX ratios at 1![[thin space (1/6-em)]](https://www.rsc.org/images/entities/char_2009.gif) :
:![[thin space (1/6-em)]](https://www.rsc.org/images/entities/char_2009.gif) 4 and 1
4 and 1![[thin space (1/6-em)]](https://www.rsc.org/images/entities/char_2009.gif) :
:![[thin space (1/6-em)]](https://www.rsc.org/images/entities/char_2009.gif) 1 were significantly stronger than that of the 4
1 were significantly stronger than that of the 4![[thin space (1/6-em)]](https://www.rsc.org/images/entities/char_2009.gif) :
:![[thin space (1/6-em)]](https://www.rsc.org/images/entities/char_2009.gif) 1 molar ratio in both OVCAR8 and NCI/ADR-RES cells. This result is in accordance with a previous study,23 in which paclitaxel has a stronger cytotoxicity than a platinum-based drug against ovarian carcinoma cells.
1 molar ratio in both OVCAR8 and NCI/ADR-RES cells. This result is in accordance with a previous study,23 in which paclitaxel has a stronger cytotoxicity than a platinum-based drug against ovarian carcinoma cells.
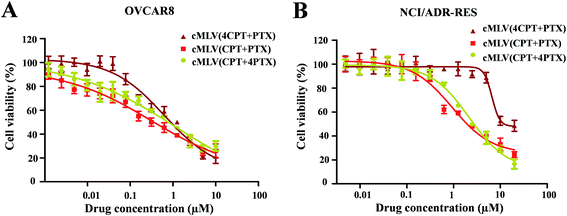 | ||
| Fig. 2 In vitro cytotoxicity profiles of cMLVs (CPT/PTX) with various CPT/PTX ratios against OVCAR8 (A) and NCI/ADR-RES (B) cells. | ||
To further study the synergy in cMLVs (CPT/PTX), we determined its combination index (CI). CI values lower than, equal to, and higher than 1 indicate synergism, additivity, and antagonism, respectively. As shown in Table 2, at 50% cell killing effect (CI50), synergistic effects were observed in both OVCAR8 and NCI/ADR-RES cancer cells treated with cMLVs (CPT/PTX) with three different molar ratios. However, the strongest synergistic cytotoxicity was observed at a 1![[thin space (1/6-em)]](https://www.rsc.org/images/entities/char_2009.gif) :
:![[thin space (1/6-em)]](https://www.rsc.org/images/entities/char_2009.gif) 1 molar ratio of CPT/PTX in the co-loading cMLVs formulation showing the lowest CI50 values of 0.13 and 0.28 on OVCAR8 and NCI/ADR-RES cells respectively.
1 molar ratio of CPT/PTX in the co-loading cMLVs formulation showing the lowest CI50 values of 0.13 and 0.28 on OVCAR8 and NCI/ADR-RES cells respectively.
It has been reported that ovarian cancer stem cells (CSCs) associates with recurrence in early-stage ovarian cancer.31 In addition, aldehyde dehydrogenase activity (ALDH+) is a known CSC biomarker for all human ovarian cancers.32 This prompted us to investigate the ability of drug-loaded cMLVs to eliminate CSCs in OVCAR8 and NCI/ADR-RES cell lines. FACS analyses showed that untreated OVCAR8 and NCI/ADR-RES cell lines contained 37.6% and 57.3% ALDH+ cells, respectively (Fig. 3). Ovarian cancer cells treated by cMLVs (CPT) reduced the population of ALDH+ cells significantly in OVCAR8 (13.2%) and NCI/ADR-RES (24.7%), whereas treatment of cMLVs (PTX) did not show a strong ability to alter ALDH+ population (32.4% and 44.8%, in OVCAR8 and NCI/ADR-RES cells respectively) (Fig. 3). The stronger cytotoxicity of CPT against CSCs could be explained by the different mechanisms of action of PTX and CPT. PTX is an M-phase specific antitumor drug and acts on highly proliferative cells. However, it has been reported that the cancer stem cells exhibit a quiescent slow-cycling phenotype.33,34 Thus, PTX is not able to kill the cancer stem cells efficiently. This is also the reason why cancer stem cells can induce resistance to conventional chemotherapies that are dependent on cell cycle inhibition.35 In contrast, cisplatin is a cell cycle independent antitumor drug that covalently binds to DNA and leads to efficient elimination of CSCs. The combination treatments using cMLVs with different ratios of CPT/PTX also showed different effectiveness at inhibiting the growth of ALDH+ populations in OVCAR8 and NCI/ADR-RES cells. As shown in Fig. 3, the ability of cMLVs (CPT/PTX) at molar ratios of CPT/PTX of 4![[thin space (1/6-em)]](https://www.rsc.org/images/entities/char_2009.gif) :
:![[thin space (1/6-em)]](https://www.rsc.org/images/entities/char_2009.gif) 1 and 1
1 and 1![[thin space (1/6-em)]](https://www.rsc.org/images/entities/char_2009.gif) :
:![[thin space (1/6-em)]](https://www.rsc.org/images/entities/char_2009.gif) 1 to eliminate ALDH+ cells was significantly stronger than that of cMLVs (CPT/PTX) prepared at 1
1 to eliminate ALDH+ cells was significantly stronger than that of cMLVs (CPT/PTX) prepared at 1![[thin space (1/6-em)]](https://www.rsc.org/images/entities/char_2009.gif) :
:![[thin space (1/6-em)]](https://www.rsc.org/images/entities/char_2009.gif) 4 molar ratio of CPT/PTX, in both OVCAR8 and NCI/ADR-RES cells. However, in vitro cytotoxicity assays showed that cMLVs (CPT/PTX) at CPT/PTX ratios of 1
4 molar ratio of CPT/PTX, in both OVCAR8 and NCI/ADR-RES cells. However, in vitro cytotoxicity assays showed that cMLVs (CPT/PTX) at CPT/PTX ratios of 1![[thin space (1/6-em)]](https://www.rsc.org/images/entities/char_2009.gif) :
:![[thin space (1/6-em)]](https://www.rsc.org/images/entities/char_2009.gif) 4 and 1
4 and 1![[thin space (1/6-em)]](https://www.rsc.org/images/entities/char_2009.gif) :
:![[thin space (1/6-em)]](https://www.rsc.org/images/entities/char_2009.gif) 1 displayed stronger cytotoxicity in OVCAR8 and NCI/ADR-RES cell lines. Taken together, these results indicate that 1
1 displayed stronger cytotoxicity in OVCAR8 and NCI/ADR-RES cell lines. Taken together, these results indicate that 1![[thin space (1/6-em)]](https://www.rsc.org/images/entities/char_2009.gif) :
:![[thin space (1/6-em)]](https://www.rsc.org/images/entities/char_2009.gif) 1 is the desired molar ratio for cMLVs (CPT/PTX) combination treatment to target the bulk and ALDH+ CSCs population. Hence, all the CPT and PTX loaded cMLVs were prepared at 1
1 is the desired molar ratio for cMLVs (CPT/PTX) combination treatment to target the bulk and ALDH+ CSCs population. Hence, all the CPT and PTX loaded cMLVs were prepared at 1![[thin space (1/6-em)]](https://www.rsc.org/images/entities/char_2009.gif) :
:![[thin space (1/6-em)]](https://www.rsc.org/images/entities/char_2009.gif) 1 molar ratio of CPT/PTX in the following studies.
1 molar ratio of CPT/PTX in the following studies.
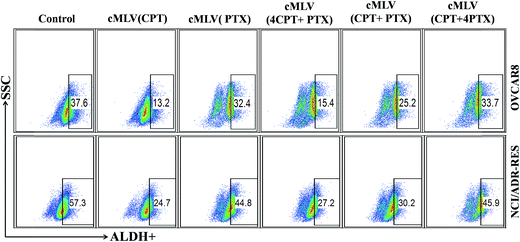 | ||
| Fig. 3 ALDH+ cells in unsorted OVCAR8 and NCI/ADR-RES cell lines determined by FACS analyses using ALDH activity assay. | ||
In vivo toxicity
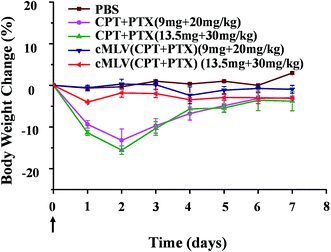
To determine whether cMLVs could reduce systemic toxicity, the acute toxicity of the combination therapeutics was studied. According to previously published data, the maximum tolerated dose of free PTX for cancer treatments was set at 20 mg kg−1 in mice models.36 Thus, we tested the acute toxicity of the free drug combination (CPT + PTX) and cMLVs (CPT + PTX) with a PTX dosage of 20 mg kg−1 and 30 mg kg−1. These treatments were injected into BALB/c mice intravenously through the tail vein. The weights and overall behavior of the mice were monitored for 7 days after the single injection.On day 2, as shown in Fig. 4, the groups treated with the free drug combinations at 20 and 30 mg kg−1 of PTX dosage experienced a loss of 13.2 and 15.5% of their body weight respectively. In contrast, the two cMLVs (CPT + PTX) administration groups showed a much smaller body weight loss (2–4%). It was noted that all mice receiving the free drug combination at all dose levels showed convulsions over 2 minutes after injection, whereas no convulsions were observed with all dose levels of nanotherapeutics. There was no difference in the general behavior between mice in the cMLVs (CPT + PTX) groups and mice in the PBS group in the following days, but the mice treated with free drug combinations were significantly less active.
Light microscopic examination of H&E stained liver sections from sacrificed animals showed that liver had no morphological changes after the treatment with cMLVs (CPT + PTX) compared with the control group, while obstruction of sinusoids in livers were observed from all animals treated with the free drug combination (Fig. 5). The reduced systemic toxicity of cMLVs (CPT + PTX) could be attributed to its macromolecular size and slow drug release rate.
In vivo anticancer efficacy of drug-loaded cMLVs
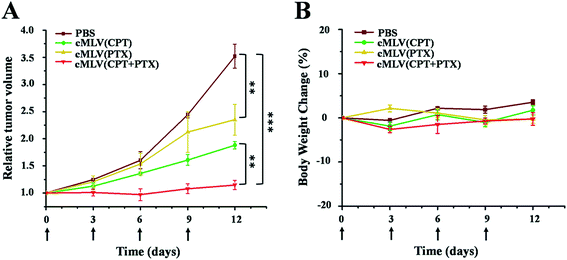
We evaluated the efficacy of our cMLVs (CPT + PTX) combination therapy using OVCAR8 xenograft nude mice. When tumors were about 100 mm3 in size, the mice were randomly divided into 4 groups and were given four injections of drug-loaded cMLVs intravenously on days 0, 3, 6, and 9, where day 0 is the day of the first injection. The tumor volume and body weight were then monitored every three days for 12 days. The treatments for the 4 groups were as follows: (a) PBS control, (b) cMLVs (CPT) (1.8 mg kg−1), (c) cMLVs (PTX) (4.0 mg kg−1) and (d) cMLVs (CPT + PTX) (1.8 mg + 4.0 mg kg−1). No weight change was observed in all treatment groups for the duration of the experiment, denoting the absence of systemic toxicity from the cMLVs nanotherapeutics.Meanwhile, in terms of tumor inhibition, mild tumor inhibitory effects (p < 0.01) were exhibited by cMLVs (CPT) (1.8 mg CPT per kg) and cMLVs (PTX) (4.0 mg PTX per kg) compared to the control group (Fig. 6). However, no differences in tumor growth inhibition (p = 0.09) were seen between cMLVs (CPT) (1.8 mg CPT per kg) and cMLVs (PTX) (4.0 mg PTX per kg). More importantly, cMLVs (CPT + PTX) (1.8 mg CPT + 4.0 mg PTX per kg) displayed stronger tumor inhibitory effects (p < 0.01) than both cMLVs (CPT) (1.8 mg CPT per kg) and cMLVs (PTX) (4.0 mg PTX per kg). On day 12, the relative tumor volume median for cMLVs (CPT + PTX) (1.8 mg CPT + 4.0 mg PTX per kg) was 1.1. Comparatively, the relative tumor volume median for mice treated with cMLVs (CPT) (1.8 mg CPT per kg), cMLVs (PTX) (4.0 mg PTX per kg) and PBS were 2.0, 1.9 and 3.5, respectively. The superior tumor inhibition of cMLVs (CPT + PTX) further confirms the synergistic effects between CPT and PTX.
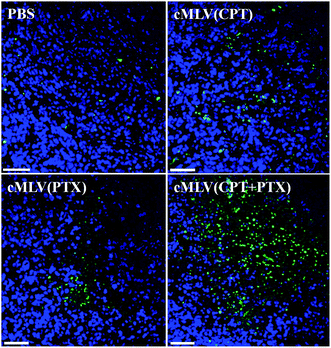
A TUNEL assay was then conducted to observe the number of apoptotic cells in OVCAR8 tumors treated with CPT and PTX and CPT + PTX in cMLV formulations for 4 rounds, in order to further investigate whether the synergistic effects could also be induced by the in vivo co-delivery of CPT and PTX via cMLVs. As shown in Fig. 7, OVCAR8 tumors treated with cMLVs (CPT) and cMLVs (PTX) induced a moderate amount of cell apoptosis compared to the controls. Additionally, cMLVs (CPT + PTX) promoted a more remarkable tumor cell apoptosis than both cMLVs (CPT) and cMLVs (PTX). These results are consistent with results of the inhibitory effect on tumor growth (Fig. 6).
Conclusions
In this study, we have utilized a cross-linked multilamellar liposome for the effective co-delivery of CPT and PTX as an ovarian cancer combination therapy. These multi-compartment and cross-linked nanostructures enable the highly encapsulation efficacy for both CPT and PTX. When combined at the optimal drug-loading ratio, the different mechanisms of action of CPT and PTX allow for synergistic, cytotoxic effects against ovarian cancer cells. In vivo studies showed that the binary drug combination therapy administrated via cMLVs displayed a safe and effective inhibition toward OVCAR8 tumor growth. Overall, this CPT and PTX co-delivery system has potential for use in a clinical setting as an ovarian cancer treatment.Acknowledgements
We thank the USC NanoBiophysics Core Facility. This work was supported by National Institutes of Health grants (R01AI068978, R01CA170820 and P01CA132681), a translational acceleration grant from the Joint Center for Translational Medicine, the National Cancer Institute (P30CA014089), and a grant from the Ming Hsieh Institute for Research on Engineering Medicine for Cancer.References
- E. Pujade-Lauraine, U. Wagner, E. Aavall-Lundqvist, V. Gebski, M. Heywood, P. A. Vasey, B. Volgger, I. Vergote, S. Pignata, A. Ferrero, J. Sehouli, A. Lortholary, G. Kristensen, C. Jackisch, F. Joly, C. Brown, N. Le Fur and A. du Bois, J. Clin. Oncol., 2010, 28, 3323–3329 CrossRef CAS PubMed.
- T. Ohta, M. Isobe, T. Takahashi, M. Saitoh-Sekiguchi, T. Motoyama and H. Kurachi, Anticancer Res., 2009, 29, 4639–4647 CAS.
- M. Villedieu, E. Deslandes, M. Duval, J. Héron, P. Gauduchon and L. Poulain, Gynecol. Oncol., 2006, 101, 507–519 CrossRef CAS PubMed.
- H. Xiao, P. Verdier-Pinard, N. Fernandez-Fuentes, B. Burd, R. Angeletti, A. Fiser, S. B. Horwitz and G. A. Orr, Proc. Natl. Acad. Sci. U. S. A., 2006, 103, 10166–10173 CrossRef CAS PubMed.
- M. Villedieu, M. Briand, M. Duval, J. Heron, P. Gauduchon and L. Poulain, Gynecol. Oncol., 2007, 105, 373–384 CrossRef CAS PubMed.
- A. Basu and S. Krishnamurthy, J. Nucleic Acids, 2010, 2010, 201367 Search PubMed.
- S. S. Ramalingam, M. L. Maitland, P. Frankel, A. E. Argiris, M. Koczywas, B. Gitlitz, S. Thomas, I. Espinoza-Delgado, E. E. Vokes, D. R. Gandara and C. P. Belani, J. Clin. Oncol., 2010, 28, 56–62 CrossRef CAS PubMed.
- G. P. Stathopoulos and T. Boulikas, J. Drug Delivery, 2012, 2012, 581363 CAS.
- N. Katsumata, M. Yasuda, F. Takahashi, S. Isonishi, T. Jobo, D. Aoki, H. Tsuda, T. Sugiyama, S. Kodama and E. Kimura, Lancet, 2009, 374, 1331–1338 CrossRef CAS.
- P. Ma and R. J. Mumper, J. Nanomed. Nanotechnol., 2013, 4, 1000164–1000198 Search PubMed.
- J. Vasantha, G. Kannan, T. Goud, T. Palani, R. Vanitha, R. Anitha and J. Priya, J. Young Pharm., 2011, 3, 322–328 CrossRef CAS PubMed.
- v. d. Vijgh and J. F. Wim, Clin. Pharmacokinet., 1991, 21, 242–261 CrossRef PubMed.
- M. Sooriyaarachchi, A. Narendran and J. Gailer, Metallomics, 2011, 3, 49–55 RSC.
- A. Z. Wilczewska, K. Niemirowicz, K. H. Markiewicz and H. Car, Pharmacol. Rep., 2012, 64, 1020–1037 CrossRef CAS PubMed.
- Y. Liu, J. Rohrs and P. Wang, Curr. Drug Metab., 2014, 15, 818–828 CrossRef CAS PubMed.
- Y. Liu, M. Ji, M. K. Wong, K. I. Joo and P. Wang, BioMed Res. Int., 2013, 2013, 378380–378390 Search PubMed.
- M. Zhao, Y. Liu, R. S. Hsieh, N. Wang, W. Tai, K. Joo, P. Wang, Z. Gu and Y. Tang, J. Am. Chem. Soc., 2014, 136, 15319–15325 CrossRef CAS PubMed.
- F. Danhier, N. Lecouturier, B. Vroman, C. Jérôme, J. Marchand-Brynaert, O. Feron and V. Préat, J. Controlled Release, 2009, 133, 11–17 CrossRef CAS PubMed.
- T. Sadhukha and S. Prabha, AAPS PharmSciTech, 2014, 15, 1029–1038 CrossRef CAS PubMed.
- B. K. Nanjwade, J. Singh, K. A. Parikh and F. Manvi, Int. J. Pharm., 2010, 385, 176–180 CrossRef CAS PubMed.
- H. Xiao, H. Song, Q. Yang, H. Cai, R. Qi, L. Yan, S. Liu, Y. Zheng, Y. Huang and T. Liu, Biomaterials, 2012, 33, 6507–6519 CrossRef CAS PubMed.
- S. S. Desale, S. M. Cohen, Y. Zhao, A. V. Kabanov and T. K. Bronich, J. Controlled Release, 2013, 171, 339–348 CrossRef CAS PubMed.
- L. Cai, G. Xu, C. Shi, D. Guo, X. Wang and J. Luo, Biomaterials, 2015, 37, 456–468 CrossRef CAS PubMed.
- K. Joo, L. Xiao, S. Liu, Y. Liu, C. Lee, P. S. Conti, M. K. Wong, Z. Li and P. Wang, Biomaterials, 2013, 34, 3098–3109 CrossRef CAS PubMed.
- Y. Liu, J. Fang, Y. Kim, M. K. Wong and P. Wang, Mol. Pharmaceutics, 2014, 11, 1651–1661 CrossRef CAS PubMed.
- Y. P. Zhang, Q. H. Kong, Y. Huang, G. L. Wang and K. J. Chang, Asian Pac J Cancer Prev., 2015, 16, 2251–2256 CrossRef PubMed.
- Y. Kim, Y. Liu, S. Li, J. Rohrs, R. Zhang, X. Zhang and P. Wang, Mol. Pharmaceutics, 2015, 12, 2811–2822 CrossRef CAS PubMed.
- Y. Liu, J. Fang, K. Joo, M. K. Wong and P. Wang, PLoS One, 2014, 9, e110611 Search PubMed.
- E. K. Rowinsky, M. R. Gilbert, W. P. McGuire, D. A. Noe, L. B. Grochow, A. A. Forastiere, D. S. Ettinger, B. G. Lubejko, B. Clark and S. E. Sartorius, J. Clin. Oncol., 1991, 9, 1692–1703 CrossRef CAS PubMed.
- L. D. Mayer, T. O. Harasym, P. G. Tardi, N. L. Harasym, C. R. Shew, S. A. Johnstone, E. C. Ramsay, M. B. Bally and A. S. Janoff, Mol. Cancer Ther., 2006, 5, 1854–1863 CrossRef CAS PubMed.
- J. M. Whitworth, A. I. Londoño-Joshi, J. C. Sellers, P. J. Oliver, D. D. Muccio, V. R. Atigadda, J. M. Straughn and D. J. Buchsbaum, Gynecol. Oncol., 2012, 125, 226–230 CrossRef CAS PubMed.
- S. Liu, C. Liu, X. Min, Y. Ji, N. Wang, D. Liu, J. Cai and K. Li, PLoS One, 2014, 8, e81050 Search PubMed.
- A. Zeuner, F. Francescangeli, P. Contavalli, G. Zapparelli, T. Apuzzo, A. Eramo, M. Baiocchi, M. De Angelis, M. Biffoni and G. Sette, Cell Death Differ., 2014, 21, 1877–1888 CrossRef CAS PubMed.
- N. Moore and S. Lyle, J. Oncol., 2011, 2011, 396076 Search PubMed.
- T. H. Kim, D. H. Suh, M. K. Kim and Y. S. Song, BioMed Res. Int., 2014, 2014, 132702 Search PubMed.
- J. Lu, Y. Huang, W. Zhao, R. T. Marquez, X. Meng, J. Li, X. Gao, R. Venkataramanan, Z. Wang and S. Li, Biomaterials, 2013, 34, 1591–1600 CrossRef CAS PubMed.
Footnotes |
| † Electronic supplementary information (ESI) available. See DOI: 10.1039/c7ra01100h |
| ‡ These authors contributed equally to this work. |
| This journal is © The Royal Society of Chemistry 2017 |

