
 Open Access Article
 This Open Access Article is licensed under a Creative Commons Attribution-Non Commercial 3.0 Unported Licence
Identification of the structural determinants for efficient glucose transport via segment swapping between two fungal glucose transporters†
Weixin Zhang,
Yanli Cao,
Guanjun Chen and
Weifeng Liu *
*
State Key Laboratory of Microbial Technology, School of Life Science, Shandong University, No. 27 Shanda South Road, Jinan 250100, Shandong, P. R. China. E-mail: weifliu@sdu.edu.cn; Fax: +86 531 88565610; Tel: +86 531 88364324
First published on 10th May 2017
Abstract
Glucose transporters mediate the intracellular uptake of glucose and play important roles in glucose metabolism and signaling. Our understanding of the structural basis for a variety of glucose transporters is, however, still limited. In this study, we presented that the glucose transporter Hgt-1, obtained from the filamentous fungus Neurospora crassa, exhibited much higher glucose transport activity than the other sugar transporter Stp1, obtained from Trichoderma reesei, although they shared high sequence identity of 75.9%. To identify the structural determinants for differential glucose transport capability displayed by Stp1 and Hgt-1, segment swapping was performed by replacing specific sequence regions of Stp1 with the corresponding sequences of Hgt-1. Investigation of the glucose transport capability of the resulting chimeric transporters revealed that replacement of a N- or a C-terminal segment of Stp1, located on the intracellular side, with that of Hgt-1 can apparently improve its transport capability. The combined swapping of these two segments further enhanced the transport capability of Stp1 to a level almost comparable to that of Hgt-1. However, deletion of the C-terminal 32 residues abolished the transport capability of Stp1, whereas deletion of the C-terminal 16 residues apparently improved its transport capability. These results provide insight into the roles of intracellular N- and C-termini of glucose transporters in glucose transport.
Introduction
Membrane proteins are present in all living cells and play an essential role in mediating the transport of solutes in and out of the cell and in sensing and transducing signals across the membranes.1,2 Among these proteins, glucose transporters that mediate the intracellular uptake of glucose, the primary source of carbon and energy for most living organisms, play important roles in glucose metabolism and glucose signalling3 and have been extensively studied in mammals and baker's yeast, Saccharomyces cerevisiae.3–7 Mammalian glucose transporters consist of glucose transport facilitators (GLUTs), sodium-coupled glucose transporters (SGLTs), and the recently identified SWEETs (sugars will eventually be exported transporters).8,9 A total of fourteen members of the GLUT family have been identified with the individual GLUT isoforms exhibiting different substrate specificities, kinetic properties, and gene expression profiles.4 In S. cerevisiae, 20 glucose (hexose) transporters (HXT1 to HXT17, GAL2, SNF3, and RGT2) have been identified, among which SNF3 and RGT2 act as glucose sensors.6GLUTs and their homologues belong to the major facilitator superfamily (MFS), which represents an ancient and the largest secondary transporter superfamily found in all kingdoms of life.10 Despite weak sequence similarity and distinct substrate specificity, MFS members share a common structural fold known as the MFS fold. A canonical MFS fold comprises two halves: the amino- and carboxyl-terminal domains, each containing six consecutive transmembrane helices.11,12 The proposed model for transport by MFS proteins is an alternating access in which the substrate-binding site is alternatively exposed to either side of the membrane.11,12 More structural details relevant to glucose transport have been revealed by the resolved crystal structures of human GLUT1 and GLUT3,13,14 two mammalian GLUT5 homologs,15 and two bacterial homologs XylE and GlcPse;16,17 all these contain a unique intracellular helical (ICH) domain, which undergoes prominent conformational changes during the transport of glucose and is thus considered to play an important role in the function of the glucose transporters.9 Recently, unguided molecular dynamics simulations initiated from an outward-open crystal structure of a SemiSWEET transporter captured outward-open to inward-open transitions, providing an atomic-level description of the process by which an alternating-access transporter carries a substrate across the cell membrane.18 Despite the revelation of these structural characteristics, our understanding of most other glucose transporters, especially those less well characterized, still largely derives from modelling studies. These types of modelling studies usually fail to accurately predict the helix and amino acid side chain orientation and residue–residue interactions due to low sequence identities among the membrane proteins. Systematic mutational analyses of these glucose transporters are, therefore, still necessary for a better understanding of their structure–function relationships.
We have previously reported that the sugar transporter Stp1 isolated from the cellulolytic filamentous fungus Trichoderma reesei possesses low glucose transport activity in S. cerevisiae EBY.VW4000-based assays.19 In the present study, we found that the sugar transporter Hgt-1, which shares high sequence identity of 75.9% with Stp1 obtained from other cellulolytic fungus Neurospora crassa, exhibited much higher glucose transport activity compared to Stp1. Segment swapped chimeras were then constructed by replacing specific sequence regions of Stp1 with those of Hgt-1, and their glucose transport capability was analyzed to identify the relevant structural determinants for efficient glucose transport.
Experimental
Strains, media, and cultivation conditions
The stp1 and hgt-1 genes were amplified from T. reesei TU-6 (ATCC MYA-256) and N. crassa (FGSC 2489), respectively. S. cerevisiae EBY.VW4000 (ref. 20) cells were routinely cultivated at 30 °C in a YPM medium (10 g l−1 yeast extract, 20 g l−1 peptone, and 10 g l−1 maltose). For transformant selection, yeast synthetic complete (SC) medium (6.7 g l−1 yeast nitrogen base without amino acids, 1.7 g l−1 drop-out mix) plus 10 g l−1 maltose was used. Uracil was omitted for plasmid selection. For routine plasmid construction and amplification, Escherichia coli DH5α (Novagen, USA) was grown in a Luria–Bertani medium with the addition of 100 μg ml−1 ampicillin as required.Yeast transformation and plasmid isolation
The respective constructs were used to transform yeast strains by the PEG/LiAc method of Gietz et al.22 Transformants were selected on an SC medium containing 10 g l−1 maltose. Plasmid isolation from the yeast cells was performed using the E.Z.N.A.® yeast plasmid kit (Omega). The isolated plasmids were amplified via E. coli transformation and then subjected to DNA sequencing.Yeast growth assay
Transformants were grown in a liquid SC medium with 10 g l−1 maltose under selective conditions, harvested during logarithmic growth, washed, adjusted to the same cell density, and transferred to the medium with 10 g l−1 glucose or 10 g l−1 cellobiose as the sole carbon source. The growth curve was determined by measuring the optical density at 600 nm using a 96-well UV-visible spectrophotometer and obtained as the mean of three independent experiments obtained from five respective transformants. For growth analysis on cellobiose, the indicated chimeras were transformed into the VW4000 strain harbouring an intracellular β-glucosidase GH1-1,19 and the cell density was obtained on 1% cellobiose.2-NBDG assay
The 2-NBDG uptake assay was performed as previously described with some modifications.19 Briefly, yeast cells expressing Hgt-1, Stp1 or its variants were grown on the SC media containing maltose to logarithmic growth, washed, and re-suspended with 200 μl 25 mM phosphate buffer (pH 5.2) at the optical density of 2.0 at 600 nm. Then, fluorescent derivative of D-glucose, 2-[N-(7-nitrobenz-2-oxa1,3-diazol-4-yl)amino]-2-deoxy-D-glucose (2-NBDG) (Life Technologies), was added at the final concentration of 200 μM, and the cells were incubated at 30 °C. Yeast cells obtained at the indicated time points were washed three to five times with ice-cold phosphate buffer before being re-suspended in the same volume of phosphate buffer and were analysed using a fluorescence spectrofluorometer.Fluorometric analysis
The yeast cells expressing Hgt-1 or Stp1 fused at its C-terminus with green fluorescence protein (GFP) were grown to logarithmic phase in maltose medium, obtained, washed, and re-suspended in 25 mM phosphate buffer at pH 5.2. The fluorescence of the yeast cells was detected using a Nikon Eclipse 80i fluorescence microscope. To quantify the fluorescence intensity for GFP or 2-NBDG, yeast cells were transferred to a black microtitre plate, and the fluorescence intensity was measured using a 96-well spectrofluorometer at the excitation wavelength of 485 nm and emission wavelength of 535 nm. An equal aliquot of each sample was also diluted for OD600 determination to calculate the relative fluorescence.Results
Stp1 and Hgt-1 sharing high sequence identity possess significantly different glucose transport capability
We previously reported that the sugar transporter Stp1, isolated from the filamentous fungus T. reesei, was capable of transporting glucose in the S. cerevisiae EBY.VW4000-based assays.19 Blast analysis against the US National Center for Biotechnology Information (NCBI) protein sequence database identified the sugar transporter Hgt-1 (NCU10021)23 from the filamentous fungus N. crassa, which shares sequence identity of 75.9% with Stp1 (Fig. 1). To test the glucose-transport capability of Hgt-1, we expressed its coding gene without introns in the S. cerevisiae EBY.VW4000,20 which exhibited strictly deficient growth on glucose, and compared its glucose-transport capability with that of Stp1 by measuring the growth rate of EBY.VW4000 cells expressing the two sugar transporters with glucose as the sole carbon source. As shown in Fig. 2A, EBY.VW4000 cells expressing Hgt-1 exhibited a much faster growth on glucose with a maximum growth rate of 0.060 ± 0.005 h−1 compared to that (0.016 ± 0.004 h−1) of WT Stp1, indicating that Hgt-1 possesses much higher glucose-transport activity to support the growth, relative to that of Stp1. To further verify the relative transport activity of Stp1 and Hgt-1, we employed a fluorescent glucose analogue, 2-NBDG, to test their transport capability. Yeast cells expressing Stp1 or Hgt-1 were incubated with 2-NBDG at 30 °C, and the uptake of 2-NBDG after incubation for different time periods was evaluated by quantifying the intracellular fluorescence intensity (Fig. 2B). However, no significant difference was observed in the 2-NBDG uptake between the Stp1-expressing and the control cells after incubation for 15 min; the uptake by Hgt-1-expressing cells was readily detected even after five min incubation, and the intracellular accumulation of 2-NBDG continuously increased with incubation, confirming that Hgt-1 possesses much higher glucose transport capability than Stp1.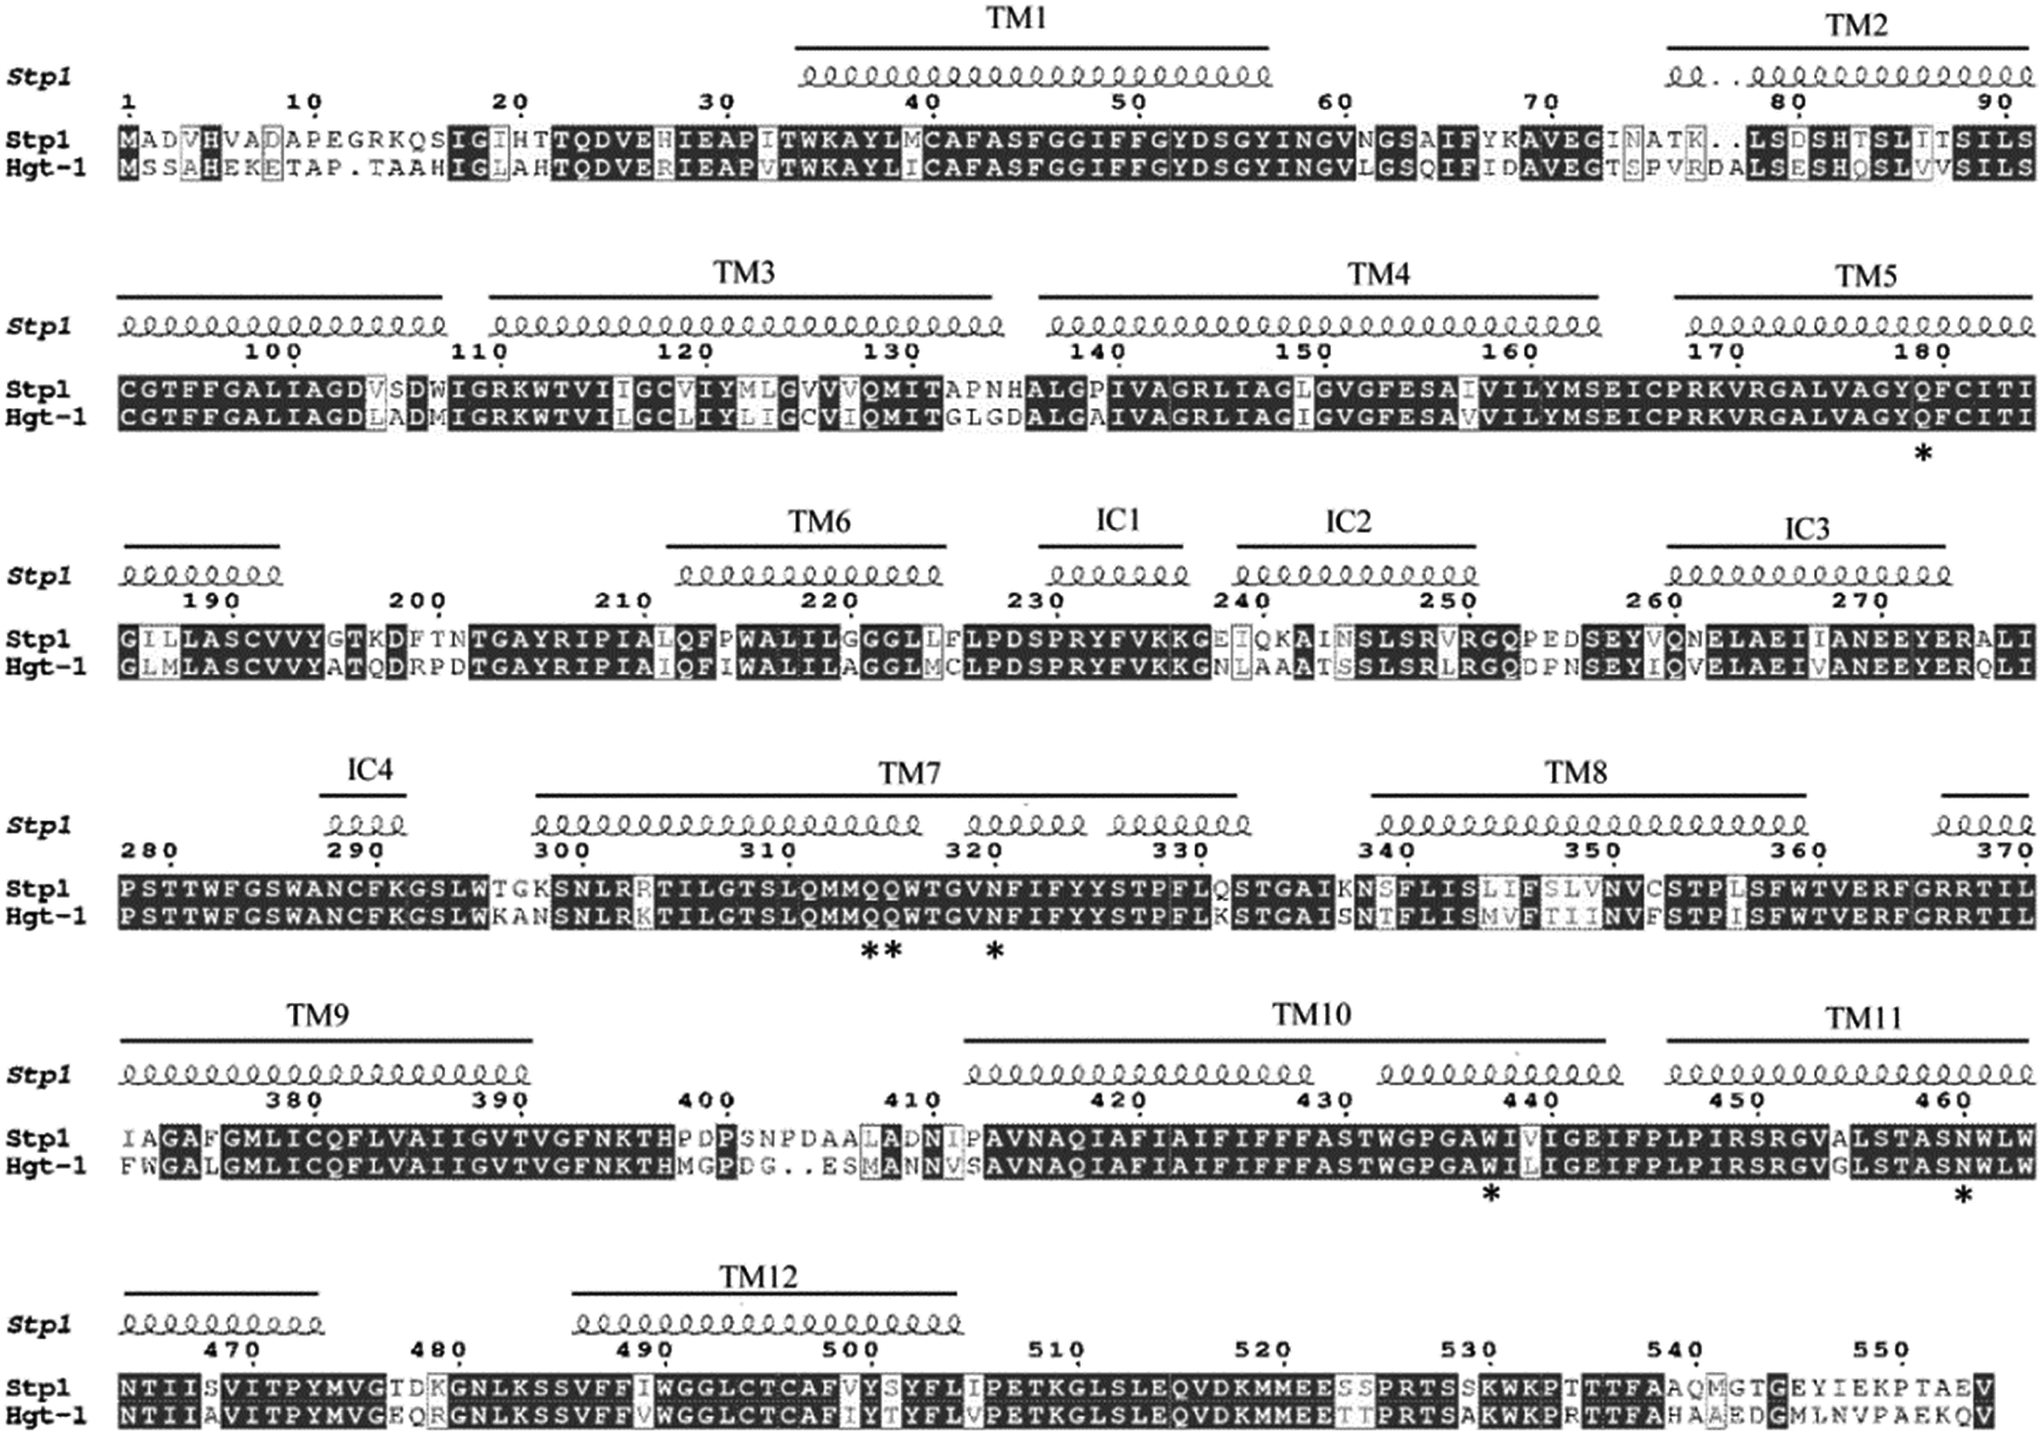 | ||
| Fig. 1 The sequence alignment between the two glucose transporters Stp1 obtained from Trichoderma reesei and Hgt-1 obtained from Neurospora crassa and analysis of their secondary structures. The secondary structure of Stp1 was predicted based on the modelled structure of Stp1, with the crystal structure of human GLUT1 (PDB no. 4PYP) as the template. The residues hydrogen-bonded to D-glucose identified in GLUT1 are invariant in Stp1 and Hgt-1, which are indicated by star. The result has been presented using ESPript.24 | ||
 | ||
| Fig. 2 Analyses of glucose transport capabilities of Hgt-1 and Stp1 based on yeast cell assays. (A) Glucose-mediated growth of yeast cells expressing the glucose transporters Stp1 and Hgt-1. (B) Fluorometric analysis result of 2-NBDG uptake by Hgt-1 and Stp1 obtained by measuring the fluorescence intensity of the yeast transformants incubated with 2-NBDG for the indicated time periods. Values in all the panels are the mean of three to five biological replicates. (C) Cellular localization of Hgt-1 illustrated by fluorescence microscopic analysis of EBY.VW4000 yeast cells expressing the Hgt-1 fused with C-terminal GFP. Panels from left to right: fluorescent image of GFP-fused Hgt-1 and phase-contrast image of yeast cells. The membrane-targeted localization of Stp1 has been previously verified.19 (D) Analysis of fluorescence intensity of yeast cells expressing WT Stp1 and Hgt-1 with a GFP fused at their C-termini. An equal aliquot was diluted for OD600 determination to calculate the relative fluorescence for each sample per OD. | ||
Both Stp1 and Hgt-1 belong to the major facilitator superfamily (MFS), members of which contain a typical MFS fold of 12 transmembrane α-helices.11 The secondary structure of Stp1 was predicted according to the previously generated modelled structure of Stp1 (ref. 19) (Fig. 1). As illustrated in Fig. 1, besides the 12 transmembrane helices (TM), the N- and C-terminal halves, each with six transmembrane helices, were connected via an intracellular helical bundle comprising four short helices named IC1, IC2, IC3, and IC4. The N-terminus (residues M1-T33) and the C-terminus (residues I505-V554) are both located on the intracellular side. Due to the high sequence identity between Stp1 and Hgt-1, Hgt-1 was predicted to possess an overall structure similar to that of Stp1. The residues hydrogen-bonded to D-glucose, which were all located in TMs as identified in XylE and GLUTs, were also invariant in Stp1 and Hgt-1 (ref. 16) (Fig. 1).
Replacement of the N- and C-termini of Stp1 with the corresponding sequences of Hgt-1 significantly facilitated the glucose transport by Stp1
To identity the sequence regions that account for the differential transport activity between Stp1 and Hgt-1, full-scope segment swapping was performed by replacing certain sequences of Stp1 with the corresponding sequences of Hgt-1. A schematic of the resulting chimeras is shown in Fig. 3. These chimeras were expressed in EBY.VW4000 cells, and their glucose-transport activities were evaluated by testing their ability to support the growth of yeast cells with glucose as the sole carbon source. As shown in Fig. 4A and Table 1, all chimeras are capable of supporting the growth of EBY.VW4000 cells on glucose, except for the chimera S331-375 wherein the segment replacement leads to abrogated growth on glucose. Specifically, yeast cells expressing the chimeras S61-160, S161-237, S238-303, S398-412, and S439-505 exhibited similar or moderately improved growth as compared to WT Stp1 (0.016 ± 0.004 h−1), and cells expressing the chimera S1-60 displayed significantly accelerated growth with a maximum growth rate of up to 0.045 ± 0.003 h−1. Considering that the swapped N-terminal 60-aa segment contains several identical residues found in both Stp1 and Hgt-1, chimeras S1-39, S1-32, S1-27, S1-21, and S1-20 with progressively shortened N-terminal regions of Hgt-1 were subsequently constructed to further pin down the sequence that contributed to the significantly enhanced transport capability of S1-60 (Fig. 3). The respective expression of the chimeras S1-39, S1-32, S1-27, and S1-21 enabled EBY.VW4000 cells to grow on glucose at an almost identical growth rate as of those expressing the chimera S1-60, whereas expression of S1-20 retarded the yeast growth (Fig. 4B and S1†). These results indicate that swapping of the N-terminal 21 residues, out of which 17 residues are different from those in Hgt-1, can fully account for the significantly enhanced glucose-transport activity for the chimera S1-60. | ||
| Fig. 3 The schematic of the segment-swapped chimeras between Stp1 and Hgt-1 in this study. Stp1 was coloured light grey and Hgt-1 was coloured dark grey. The chimeras were constructed by replacing the specific regions of Stp1 by the corresponding sequences of Hgt-1. | ||
 | ||
| Fig. 4 Analyses of glucose transport capabilities of the respective segment-swapped chimeras. (A–C) Growth curves of yeast cells expressing WT Stp1 and the respective chimeras, as indicated on 1% glucose. (D) Fluorometric analysis of the 2-NBDG uptake by yeast cells expressing WT Stp1 and the respective chimeras after incubation with 2-NBDG for different time periods. | ||
| Protein name | Growth rate (h−1) | Protein name | Growth rate (h−1) |
|---|---|---|---|
| a Expression of the variant did not support the growth of the yeast EBY.VW4000 cells on glucose. | |||
| Stp1 | 0.016 ± 0.004 | S331-375 | —a |
| Hgt-1 | 0.060 ± 0.005 | S398-412 | 0.020 ± 0.004 |
| S1-60 | 0.045 ± 0.003 | S439-505 | 0.020 ± 0.003 |
| S1-39 | 0.044 ± 0.001 | S523-554 | 0.036 ± 0.002 |
| S1-32 | 0.045 ± 0.001 | S539-554 | 0.034 ± 0.002 |
| S1-27 | 0.045 ± 0.001 | S523-538 | 0.017 ± 0.004 |
| S1-21 | 0.046 ± 0.001 | S1-21 plus S523-554 | 0.055 ± 0.003 |
| S1-20 | 0.036 ± 0.002 | TrunN21 | 0.020 ± 0.005 |
| S61-160 | 0.021 ± 0.004 | TrunC16 | 0.043 ± 0.002 |
| S161-237 | 0.025 ± 0.002 | TrunC32 | —a |
| S238-303 | 0.025 ± 0.002 | ||
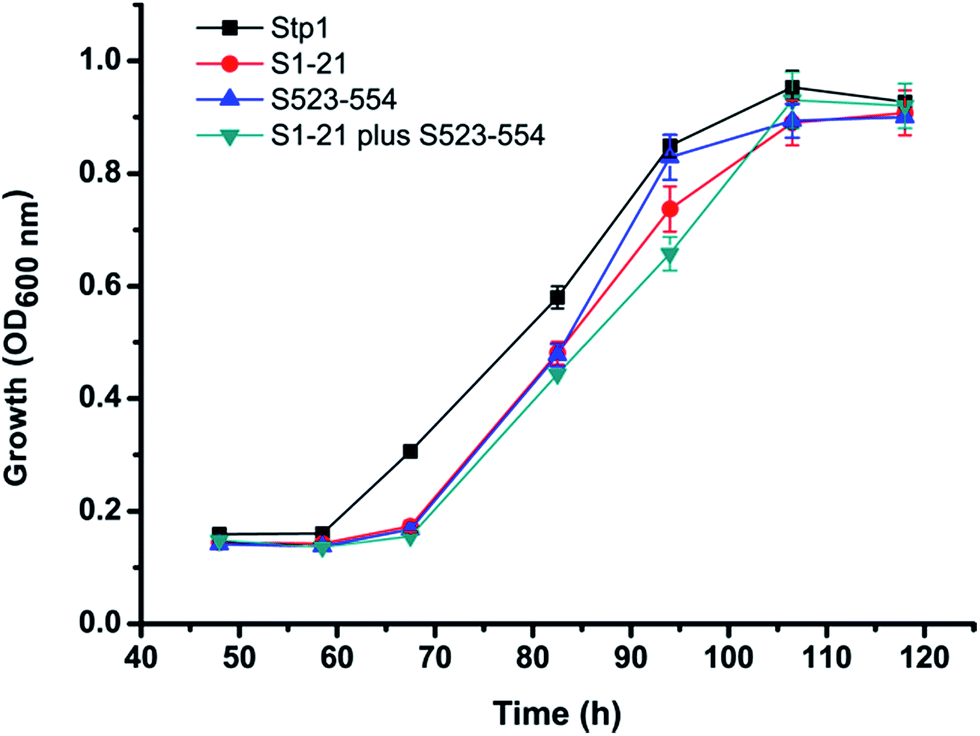
Besides S1-60, the chimera S523-554, in which the C-terminal sequence containing the last 32 residues of Stp1 was replaced with the corresponding sequence of Hgt-1, also exhibited remarkably promoted glucose transport capability with the growth rate of up to 0.036 ± 0.002 h−1. The sequence alignment between Stp1 and Hgt-1 reveals that 18 out of 32 residues in this segment are different from those in Hgt-1, most of which (14 residues) are found in the last 16 residues (A539 to V554 in Stp1) (Fig. 1). Moreover, two other chimeras, S539-554 and S523-538, were, therefore, further constructed and tested for their respective contribution to the elevated glucose transport capability in the chimera S523-V554 (Fig. 4C and Table 1). The result showed that the chimera S523-538, in which the swapped segment contained four residues (Ser 523, Ser 524, Ser 529, and Thr 534) different from those in Hgt-1 (Thr 522, Thr 523, Ala 528, and Arg 533) exhibited similar glucose transport capability to that of WT Stp1, and the chimera S539-554 enabled the yeast cells to grow at a much faster rate as compared to WT Stp1, with the maximum growth rate up to 0.034 ± 0.002 h−1 (Fig. 4C and Table 1). These results indicated that the enhanced glucose transport capability in the chimera S523-V554 mainly resulted from the swapping of the segment A539-V554 containing the last 16 residues.
Based on the abovementioned results, we further constructed the chimera S1-21 plus S523-554, in which both the N-terminal segment M1-T21 and the C-terminal segment S523-V554 of Stp1 were replaced with the corresponding segments of Hgt-1, and compared its glucose transport activity with that of Hgt-1. As shown in Fig. 4B, combination of these two segments of Hgt-1 resulted in a significant promotion of the transport capability of Stp1, with the yeast growth rate on glucose being elevated up to 0.055 ± 0.003 h−1, which is almost the same as that of Hgt-1 (0.060 ± 0.005 h−1). The significantly improved growth supporting capability of these chimeras was further confirmed to be connected to their transport activity, as determined by the 2-NBDG uptake assay (Fig. 4D). Although the chimeras S1-21 and S523-554 already exhibited a significant enhancement in the 2-NBDG uptake compared to Stp1, the combined swapping of these two fragments in the S1-21 plus S523-554 chimera resulted in a transport activity almost similar to that of Hgt-1. Overall, these results indicate that the N- and C-terminal segments displaying low sequence identity between the two transporters Stp1 and Hgt-1 are the main determinant for their differential glucose transport activities.
Truncation of C-terminal 16 residues in Stp1 improved its glucose transport activity
Considering that replacement of the N-terminal 21 residues or C-terminal 32 or 16 residues of Stp1 with the corresponding sequences of Hgt-1 significantly promoted its transport activity, we then constructed truncated Stp1 variants to test the effect of the deletion of the relevant N- and C-terminal residues of Stp1 on its glucose transport activity. As shown in Fig. 5, compared with TrunN21, whose glucose transport activity was hardly affected by the deletion of the N-terminal 21 residues in Stp1, the two C-terminally truncated mutants TrunC16 and TrunC32, in which the C-terminal 16 residues and 32 residues of Stp1 were deleted, respectively, displayed quite different transport activities as indicated by their capability to support yeast cell growth on glucose as well as to take up 2-NBDG. However, deletion of the C-terminal 32 residues led to nearly abrogated transport capability for glucose, whereas the absence of the C-terminal 16 residues obviously facilitated glucose transport, with the maximum growth rate and 2-NBDG uptake being remarkably increased.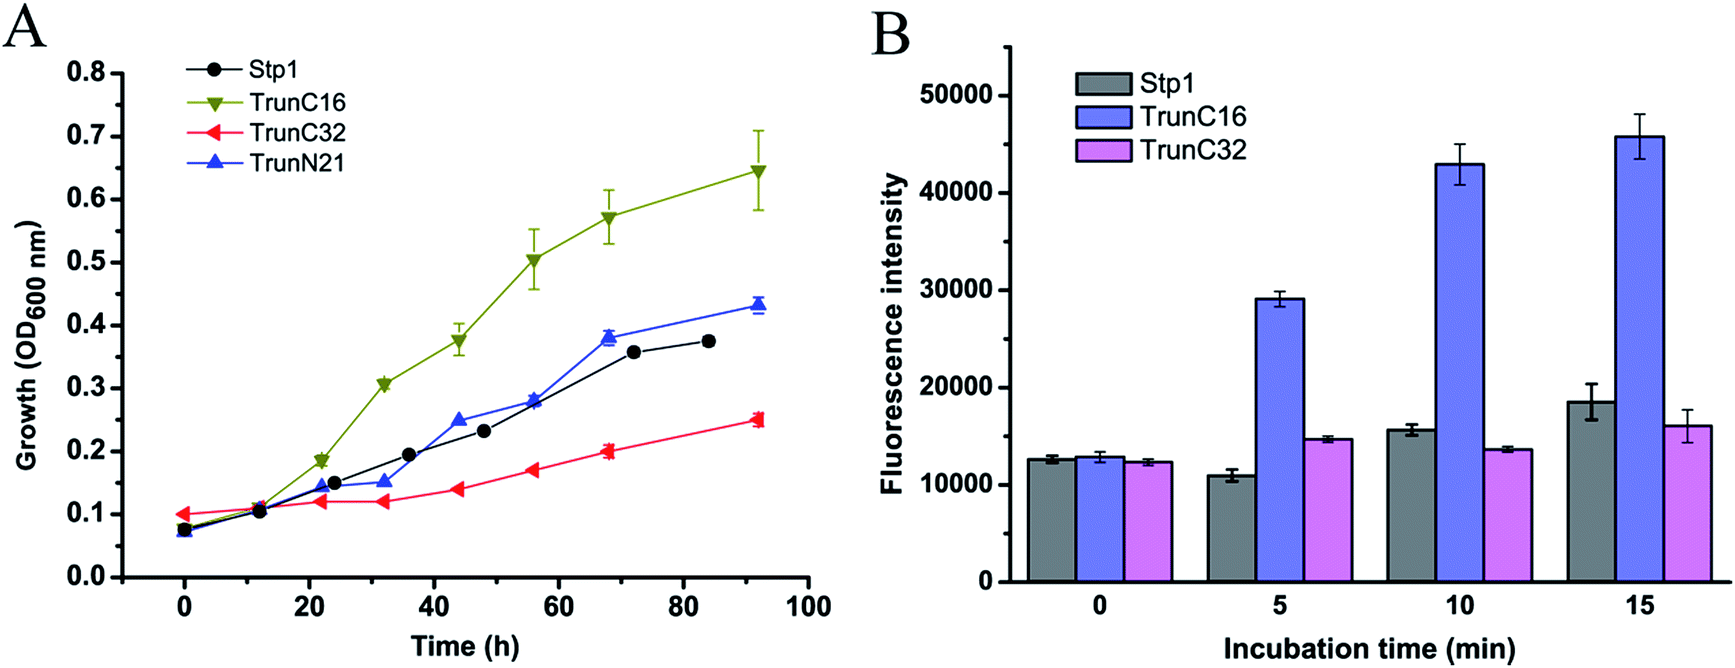 | ||
| Fig. 5 Analyses of glucose transport capabilities of the N- or C-terminally truncated Stp1 variants. (A) Growth curves of yeast cells expressing Stp1 variants on 1% glucose. (B) Fluorometric analysis of the 2-NBDG uptake by yeast cells expressing the indicated variants after incubation with 2-NBDG for different time periods. | ||
Discussion
Although there has been extensive research on eukaryotic glucose transporters, especially those from mammals and the baker's yeast S. cerevisiae, structural and functional studies on filamentous fungal glucose transporters is quite limited. In the present study, we found that the glucose transporter Hgt-1, obtained from the filamentous cellulolytic fungus N. crassa, shares high sequence identity of 75.9% to Stp1, a glucose transporter previously identified from another cellulolytic fungus T. reesei.19 Both transporters also displayed evolutionary conservation with S. cerevisiae glucose transporters.19 We, therefore, used S. cerevisiae EBY.VW4000, exhibited strictly deficient growth on glucose, which has been widely used for the study of eukaryotic glucose transporters to test their glucose transport activity. The result indicating that EBY.VW4000 expressing Hgt-1 or Stp1 restores its growth on glucose corroborates its usefulness as a host to functionally characterize the eukaryotic glucose transporters. Moreover, we found that Hgt-1 exhibited much higher glucose transport capability than Stp1, by comparing the EBY.VW4000-based growth rate on glucose and the uptake of 2-NBDG. The observed differential transport capability is not due to the different expression levels in yeast cells since almost the same levels of Hgt-1 as those of Stp1 were targeted to the cell membrane,19 as demonstrated by the very similar fluorescence intensities when both proteins were tagged with a C-terminal green fluorescence protein (GFP) and expressed in yeast cells (Fig. 2C and D).Homologous segment swapping is a strategy that is usually employed to study the structure–function relationship of proteins and engineer proteins for combined advantages.25 This approach offers the potential to identify regions that are responsible for the differences in the properties (such as substrate specificity and substrate binding affinity) of membrane transporter paralogues,26–28 which are not easy to handle due to their high hydrophobicity. By employing a segment swapping approach, we found that the respective swapping of the N-terminal segment of 21 residues and the C-terminal segment of 32 residues, both of which are located on the intracellular side, significantly improved the transport capability of Stp1. The combined swapping of these two segments further enhanced the transport capability of Stp1 to an almost similarly high level to that of Hgt-1. Our previous study showed that in addition to transporting glucose, Stp1 also displayed weak transport activity for cellobiose, as demonstrated by the growth of yeast cells expressing Stp1 on cellobiose.29 The abovementioned chimeras displaying enhanced glucose transport capability, however, exhibited very similar cellobiose transport capability as that of WT Stp1 (Fig. 6), implicating the specific roles of the cytoplasmic N- and C-termini in determining the differential glucose transport capabilities between Stp1 and Hgt-1.
 | ||
| Fig. 6 Cellobiose-mediated growth of EBY.VW4000 cells expressing Stp1 and the chimeras S1-21, S523-554, and S1-21 plus S523-554, respectively. Strains also express the intracellular β-glucosidase GH1-1 (NCU00130). Growth was measured with 1% cellobiose as the sole carbon source. | ||
The elucidation of the crystal structures of many MFS transporters, especially that of the human glucose transporter GLUT1 and GLUT3, as well as its prokaryotic homologue XylE, has provided more detailed insights into the molecular structure and mechanism of glucose transport.13,14,16 Moreover, it is clear that the substrate pathway of MFS transporters is formed by a compact bundle of transmembrane helices, a unique structure of MFS sugar transporters is the intracellular helical bundle (ICH), which are deduced to experience a large conformational change during the transport cycle.9,13 In our study, we found that the replacement of the transmembrane helices or the ICH domain of Stp1 with the corresponding sequences of Hgt-1 did not result in a remarkable promotion in its glucose transport capability. However, replacement of the N- and C-termini on the intracellular side significantly enhanced the transport capability. This enhancement is again not due to the elevated protein expression levels since the chimeras exhibited very similar cellobiose transport capabilities to that of WT Stp1, as abovementioned. On the other hand, note that yeast cells expressing the chimera S539-554 exhibited slightly retarded growth compared with those expressing the chimera S523-V554. Although swapping of only the segment S523-A538, containing four different residues between Stp1 and Hgt-1, has no effect on the transport activity, the segment may partially contribute to the enhanced transport activity in the chimera S523-554 probably via synergistic action with the residues in the segment A539-V554. No structural information about the N-terminus of Stp1 or Hgt-1 could be derived from the resolved crystal structure of GLUT1 or XylE due to their much longer termini than those of GLUT1 and XylE (Fig. 7), and the mechanism by which they contribute to glucose transport mediated by Hgt-1 is not clear at present. In contrast, although the C-terminal segment of GLUT1 in its elucidated structure is invisible,13 structural analysis of XylE in full-length revealed that its C-terminal segment forms an intracellular helix and interacts with the cytosolic portion of TMs through polar interactions.16 Our C-terminal truncation data showed that although the absence of the C-terminal 32 residues in Stp1 almost abolished its transport activity, the absence of the last 16 residues at the C-terminus apparently enhanced its glucose transport activity, suggesting a somewhat inhibitory role of this segment during glucose transport. We speculated that residue–residue interactions exist between the intracellular N- and C-termini and the intracellular domain of TMs, modulation of which has a profound influence on the glucose transport process during the conformational change of the transporter.
 | ||
| Fig. 7 Partial sequence alignments of the N-terminal sequences from Stp1, Hgt-1, E. coli XylE (EcXylE), and human GLUT1. The result has been presented using ESPript. | ||
Conclusions
In summary, we found that the glucose transporter Hgt-1 exhibited significantly higher glucose transport capability than Stp1, the glucose transporter we previously characterized, as indicated by the yeast-growth assay, although they share high sequence identity of 75%. We performed full-length segment swapping to identify the structural determinants for differential transport activity between Hgt-1 and Stp1; it was found that the N- and C-terminal segments located on the intracellular side mainly accounted for the high transport capability of Hgt-1, as demonstrated herein that combined swapping of these two segments further enhanced the transport capability of Stp1 to a level almost comparable to that of Hgt-1. Moreover, the deletion of the C-terminal 32 residues abolished Stp1 transport capability, whereas the deletion of the C-terminal 16 residues apparently improved its transport capability. Our results provide insight into the roles of intracellular N- and C- termini of glucose transporters in glucose transport.Acknowledgements
This work was supported by grants received from the National Natural Science Foundation of China (31300059, 31470162, 31270116). We thank Prof. Dr Eckhard Boles of Goethe University Frankfurt for kindly providing the EBY.VW4000 strain.References
- F. Cymer, G. von Heijne and S. H. White, J. Mol. Biol., 2015, 427, 999–1022 CrossRef CAS PubMed.
- Y. Gu, H. Li, H. Dong, Y. Zeng, Z. Zhang, N. G. Paterson, P. J. Stansfeld, Z. Wang, Y. Zhang, W. Wang and C. Dong, Nature, 2016, 531, 64–69 CrossRef CAS PubMed.
- B. Thorens and M. Mueckler, Am. J. Physiol., 2010, 298, E141–E145 CAS.
- M. Mueckler and B. Thorens, Mol. Aspects Med., 2013, 34, 121–138 CrossRef CAS PubMed.
- M. A. Herman and B. B. Kahn, J. Clin. Invest., 2006, 116, 1767–1775 CrossRef CAS PubMed.
- S. Ozcan and M. Johnston, Microbiol. Mol. Biol. Rev., 1999, 63, 554–569 CAS.
- A. Maier, B. Volker, E. Boles and G. F. Fuhrmann, FEMS Yeast Res., 2002, 2, 539–550 CAS.
- A. Scheepers, H. G. Joost and A. Schurmann, JPEN, J. Parenter. Enteral Nutr., 2004, 28, 364–371 CrossRef CAS PubMed.
- D. Deng and N. Yan, Protein Sci., 2016, 25, 546–558 CrossRef CAS PubMed.
- S. S. Pao, I. T. Paulsen and M. H. Saier Jr, Microbiol. Mol. Biol. Rev., 1998, 62, 1–34 CAS.
- I. Smirnova, V. Kasho and H. R. Kaback, Biochemistry, 2011, 50, 9684–9693 CrossRef CAS PubMed.
- J. Abramson, I. Smirnova, V. Kasho, G. Verner, H. R. Kaback and S. Iwata, Science, 2003, 301, 610–615 CrossRef CAS PubMed.
- D. Deng, C. Xu, P. Sun, J. Wu, C. Yan, M. Hu and N. Yan, Nature, 2014, 510, 121–125 CrossRef CAS PubMed.
- D. Deng, P. Sun, C. Yan, M. Ke, X. Jiang, L. Xiong, W. Ren, K. Hirata, M. Yamamoto, S. Fan and N. Yan, Nature, 2015, 526, 391–396 CrossRef CAS PubMed.
- N. Nomura, G. Verdon, H. J. Kang, T. Shimamura, Y. Nomura, Y. Sonoda, S. A. Hussien, A. A. Qureshi, M. Coincon, Y. Sato, H. Abe, Y. Nakada-Nakura, T. Hino, T. Arakawa, O. Kusano-Arai, H. Iwanari, T. Murata, T. Kobayashi, T. Hamakubo, M. Kasahara, S. Iwata and D. Drew, Nature, 2015, 526, 397–401 CrossRef CAS PubMed.
- L. Sun, X. Zeng, C. Yan, X. Sun, X. Gong, Y. Rao and N. Yan, Nature, 2012, 490, 361–366 CrossRef CAS PubMed.
- C. V. Iancu, J. Zamoon, S. B. Woo, A. Aleshin and J. Y. Choe, Proc. Natl. Acad. Sci. U. S. A., 2013, 110, 17862–17867 CrossRef CAS PubMed.
- N. R. Latorraca, N. M. Fastman, A. J. Venkatakrishnan, W. B. Frommer, R. O. Dror and L. Feng, Cell, 2017, 169, 96–107 CrossRef CAS PubMed e112.
- W. Zhang, Y. Cao, J. Gong, X. Bao, G. Chen and W. Liu, Sci. Rep., 2015, 5, 13829 CrossRef PubMed.
- R. Wieczorke, S. Krampe, T. Weierstall, K. Freidel, C. P. Hollenberg and E. Boles, FEBS Lett., 1999, 464, 123–128 CrossRef CAS PubMed.
- K. L. Heckman and L. R. Pease, Nat. Protoc., 2007, 2, 924–932 CrossRef CAS PubMed.
- D. Gietz, A. St Jean, R. A. Woods and R. H. Schiestl, Nucleic Acids Res., 1992, 20, 1425 CrossRef CAS PubMed.
- X. Xie, H. H. Wilkinson, A. Correa, Z. A. Lewis, D. Bell-Pedersen and D. J. Ebbole, Fungal Genet. Biol., 2004, 41, 1104–1119 CrossRef CAS PubMed.
- X. Robert and P. Gouet, Nucleic Acids Res., 2014, 42, W320–W324 CrossRef CAS PubMed.
- Y. Cui, W. Cui, Z. Liu, L. Zhou, M. Kobayashi and Z. Zhou, Biochem. Biophys. Res. Commun., 2014, 450, 401–408 CrossRef CAS PubMed.
- A. Will and W. Tanner, FEBS Lett., 1996, 381, 127–130 CrossRef CAS PubMed.
- T. Kasahara and M. Kasahara, Biochem. J., 2003, 372, 247–252 CrossRef CAS PubMed.
- M. Kasahara and M. Maeda, J. Biol. Chem., 1998, 273, 29106–29112 CrossRef CAS PubMed.
- W. Zhang, Y. Kou, J. Xu, Y. Cao, G. Zhao, J. Shao, H. Wang, Z. Wang, X. Bao, G. Chen and W. Liu, J. Biol. Chem., 2013, 288, 32861–32872 CrossRef CAS PubMed.
Footnote |
| † Electronic supplementary information (ESI) available. See DOI: 10.1039/c7ra01095h |
| This journal is © The Royal Society of Chemistry 2017 |