DOI:
10.1039/C7RA01074E
(Paper)
RSC Adv., 2017,
7, 12827-12834
A novel fluorescent sensor based on sulfur and nitrogen co-doped carbon dots with excellent stability for selective detection of doxycycline in raw milk†
Received
24th January 2017
, Accepted 17th February 2017
First published on 23rd February 2017
Abstract
Casein was employed for the first time as a green carbon source to prepare water-soluble sulfur and nitrogen co-doped carbon dots (S,N-CDs). The as-synthesized S,N-CDs were characterized by transmission electron microscopy, X-ray photoelectron spectroscopy, UV-Vis absorption spectroscopy, and fluorescence spectroscopy. Results showed that the as-prepared S,N-CDs had excellent stabilities under various external conditions, such as high ionic strength, different pH levels, UV light irradiation, and long storage duration. More importantly, we found that doxycycline (Dox) could result in an effective fluorescence quenching of S,N-CDs via a static quenching process. Thus, a sensitive and selective sensing system for Dox detection was developed. The linear range was 1.0 × 10⁻⁷ M to 1.0 × 10⁻⁴ M, and the detection limit was 25 nm. Furthermore, the proposed sensing system successfully detected Dox in raw milk samples. This research will demonstrate the feasibility and potential applications of carbon nanomaterials in food and medical monitoring fields.
Introduction
Doxycycline (Dox), a tetracycline (Tet) antibiotic, is extensively used to treat many infections, such as chronic prostatitis, respiratory tract infections, sinusitis, and sexually transmitted diseases.1,2 Dox is also applied in agriculture, forestry, animal husbandry, and aquaculture as a fertilizer or animal food supplement because of its extensive antibacterial ability.3 However, Dox overuse may lead to serious environmental and food contamination, resulting in considerable risk to human health.4 Dox residues mainly exist in our daily food products, such as milk and honey.5,6 In worst-case scenarios, long-term and repeated intake of Dox affects the growth and formation of teeth. Therefore, the detection of Dox residues is important. In the past years, many analytical methods have been used to detect Dox, such as high-performance liquid chromatography,7–9 electroluminescent molecularly imprinted polymer membranes,10 spectrofluorimetry,11 electrochemistry,12 immunosorbent assay,13 liquid chromatography-ultraviolet, and liquid chromatography-mass spectrometry.14 However, these methods require complicated sample pretreatment, expensive apparatus, and costly operation, limiting practical Dox detection in many fields. Thus, it is necessary to develop an alternative method for Dox detection with high sensitivity, selectivity, and convenience.
In recent years, considerable effort has been devoted to explore fluorescent probes with high selectivity and sensitivity for rapid analytical detection. Several carbonaceous nanomaterials, such as carbon nanotubes, graphene, fullerene and carbon quantum dots (CDs), have attracted extensive research interest.15–18 In comparison, CDs and functionalized CDs nanomaterials have exhibited great promise in designing fluorescent sensors and tuning fluorescence, due to low toxicity, low cost, low photobleaching, good aqueous solubility and excellent biocompatibility.19 For instance, Yang et al. realized the detection of tetracycline antibiotics by using fluorescent carbon nanoparticles prepared from a mixture of L-cysteine, diphosphorus pentoxide, and water.20 Subsequently, Yang et al. reported that CDs derived from rose flowers also successfully detected tetracycline antibiotics.21 However, Yang's results demonstrated that not only Dox can induce fluorescence quenching of the as-synthesized nitrogen-doped CDs but also other antibiotics, such as tetracycline (Tet), oxytetracycline, aureomycin, or chlortetracycline, can induce a similar response, implying the lack of specific selectivity. Thus, nitrogen-doped CDs are not conducive to the accurate analysis of a single component in complex samples.
In this study, casein, a protein derived from mammalian milk, was employed as a green carbon source for S,N-CDs preparation. The as-obtained S,N-CDs exhibited excellent stabilities in aqueous solution under an extensive pH range (2 to 11) and high ionic strength. More importantly, the as-synthesized S,N-CDs probes exhibited excellent selectivity for distinguishing Dox from other tetracycline antibiotics.
Experimental section
Materials and reagents
Dox, Tet, oxytetracycline dihydrate (Oxy), and chloramphenicol (Chl) were acquired from Aladdin Reagents Company (Shanghai, China). Casein, concentrated sulfuric acid, metal salts (Pb(NO3)2, Cu(NO3)2, HgCl2, NiSO4, BaCl2), isoniazid, L-glutamic acid, dopamine, vitamin B6, and tryptophan were purchased from Beijing Chemical Reagents Factory (Beijing, China). All chemicals were analytical reagent grade and used without further purification. Ultrapure water was used throughout all experiments.
Synthesis of fluorescent S,N-CDs
S,N-CDs were prepared as follows: 1 g of casein was transferred to a 250 mL one-neck flask, then, 40 mL of concentrated sulfuric acid (98%) was added. The mixture was vigorously stirred and reacted at 100 °C for 2 h and diluted with 100 mL deionized water. Then, the pH was adjusted to 7.0 with NaOH solution. Afterward, 300 mL of ethanol was added to the mixture. The mixture was allowed to precipitate overnight. The supernatant was collected and centrifuged at 10![[thin space (1/6-em)]](https://www.rsc.org/images/entities/char_2009.gif) 000 rpm for 10 min to remove large carbon residues. The bulk of water and ethanol was removed by rotary evaporation. Further purification was performed with a dialysis membrane (molecular weight cut off = 1000) for 48 h in the dark. Finally, a dark brown solution was obtained and stored at 4 °C for further characterization and use.
000 rpm for 10 min to remove large carbon residues. The bulk of water and ethanol was removed by rotary evaporation. Further purification was performed with a dialysis membrane (molecular weight cut off = 1000) for 48 h in the dark. Finally, a dark brown solution was obtained and stored at 4 °C for further characterization and use.
Characterization
Transmission electron microscopy images were taken with a JEOL JEM-2100 transmission electron microscope operating at an accelerated voltage of 200 kV. X-ray photoelectron spectra were obtained with a PHI-5400 electron spectrometer. UV-Vis absorption spectra were recorded with a Perkin-Elmer Lambda 35 UV-Vis spectrometer. Fluorescence measurements were conducted with a Cary Eclipse Fluorescence Spectrophotometer (Varian, Palo Alto, CA, USA) with a conventional 1 cm × 1 cm quartz cell. Excitation and emission slit widths were both set at 10 nm.
Quantum yield measurements
Quantum yield of the as-synthesized S,N-CDs was measured according to the procedure described previously.22 The reference standard was quinine sulfate in 0.1 M H2SO4 (Φstd = 0.54 at 350 nm). Quantum yield values were calculated according to the following equation:| |
 | (1) |
where Φ is the quantum yield, I is the measured integrated emission intensity, A is the absorbance, and η is the solvent refractive index. The subscripts “std” and “x” refer to the reference standard and the tested substance, respectively.
General procedure for Dox detection
In a typical experiment, Dox solutions of different concentrations were added to 5 mL centrifuge tubes containing 100 μL of 2.85 mg mL−1 S,N-CDs solution and diluted to 3 mL with 0.01 M PBS buffer (pH 7.4). The resulting mixtures were incubated for 5 min at room temperature and transferred into quartz cuvettes to obtain the corresponding fluorescence spectra.
Dox detection in raw milk
Raw milk samples were obtained from a local supermarket. Sample pretreatment was performed according to the protocol described by Le et al.23 In a typical experiment, 4 mL of raw milk was placed in a 50 mL beaker and diluted with 10 mL water. Then, 2 mL of 10% trichloroacetic acid was added to the diluted milk. The mixture was sonicated at 20 °C for 15 min and centrifuged at 13000 rpm for 10 min to remove deposits. Supernatants were neutralized with 30% NaOH solution and centrifuged at 20 °C for 10 min to remove deposits. Detection was performed with the final supernatant in accordance with the procedure described in Section 2.4. For the recovery experiments, raw milk was spiked with Dox, pretreated, and detected in accordance with the previously presented procedure.
Results and discussion
Characterization and properties of S,N-CDs
Doped CDs are well-known nanomaterials because of their enhanced physical and chemical properties. However, some synthesis methods are complicated, time-consuming, expensive, or environmentally unfriendly, which not only restrict the mass production of CDs nanomaterials but also limit their extensive application in many fields. Thus, developing a simple, environmentally friendly, and low-cost synthesis approach for doped CDs is necessary. We need select a low-cost and green carbon source containing nitrogen and sulfur as the starting materials to avoid the complicated steps in introducing nitrogen and sulfur into CDs nanomaterials. Casein, a protein derived from mammalian milk, supplies various amino acids and carbohydrates ingredient, which entirely meet the above demand as green carbon sources. As shown in Scheme 1, the synthesis of S,N-CDs was conducted by acidic oxidation of casein in concentrated sulfuric acid. Actually, amino acids and carbohydrates served as the real carbon sources in the preparation process of S,N-CDs.
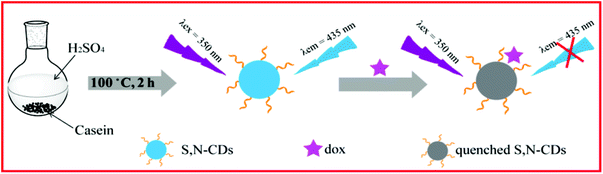 |
| | Scheme 1 Illustration of synthesis of S,N-CDs from casein and the principle of Dox detection. | |
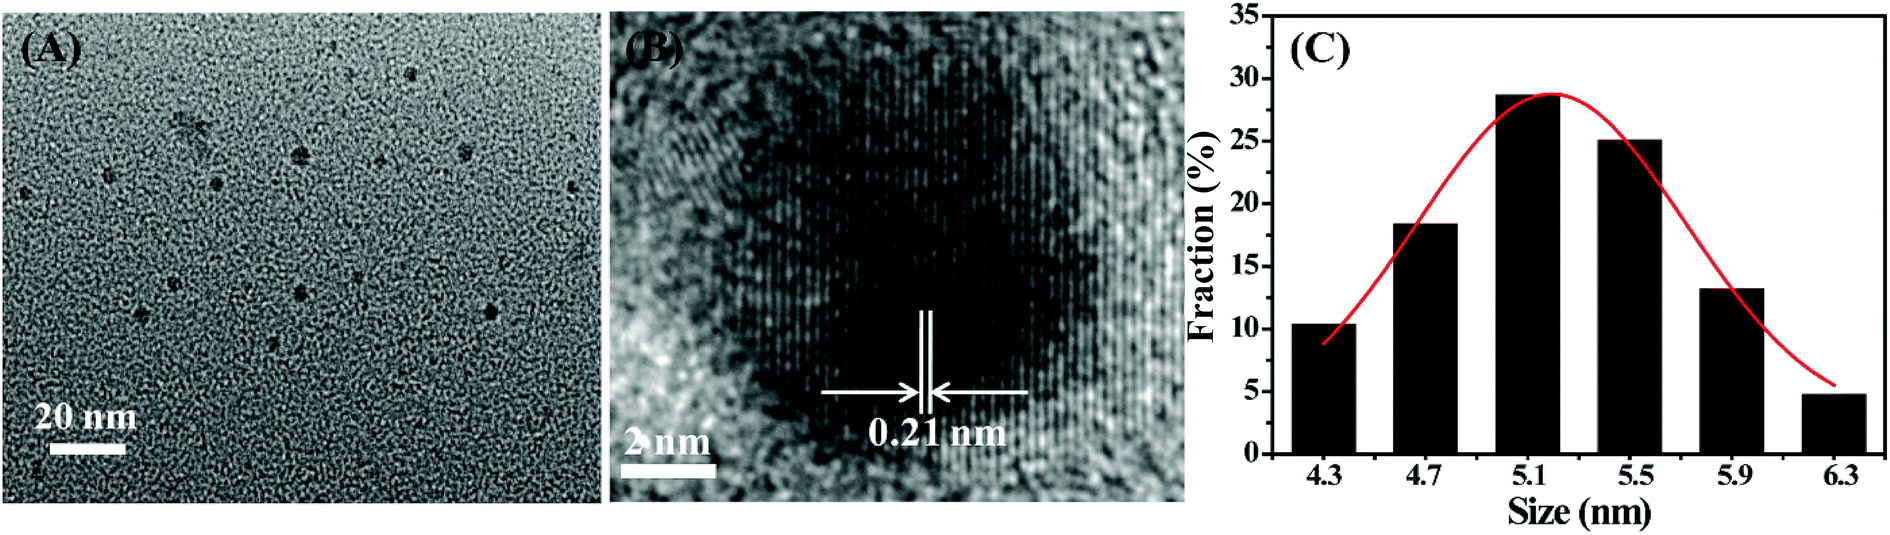
Fig. 1 depicts the morphology and size distribution of the as-synthesized S,N-CDs. S,N-CDs are monodispersed quasi-spherical particles and have a relatively narrow size distribution range of 4.3 nm to 6.3 nm and an average diameter of 5.3 nm. The high-resolution TEM (HRTEM) images (Fig. 1B) exhibit a well-resolved lattice fringe with a lattice spacing of 0.21 nm which can be attributed to the (110) facet of graphite.24 As shown in Fig. 1C, the size distribution of S,N-CDs conforms to a Gaussian distribution. The width at half maximum of the fitted Gaussian curve was calculated as 1.23 nm, further implying that the as-synthesized S,N-CDs possess a narrow size distribution.
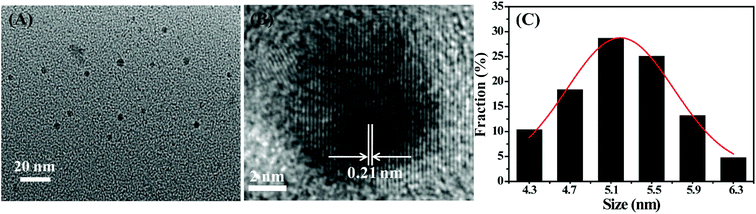 |
| | Fig. 1 TEM (A) and HRTEM (B) image of S,N-CDs. (C) Size distribution of S,N-CDs. | |
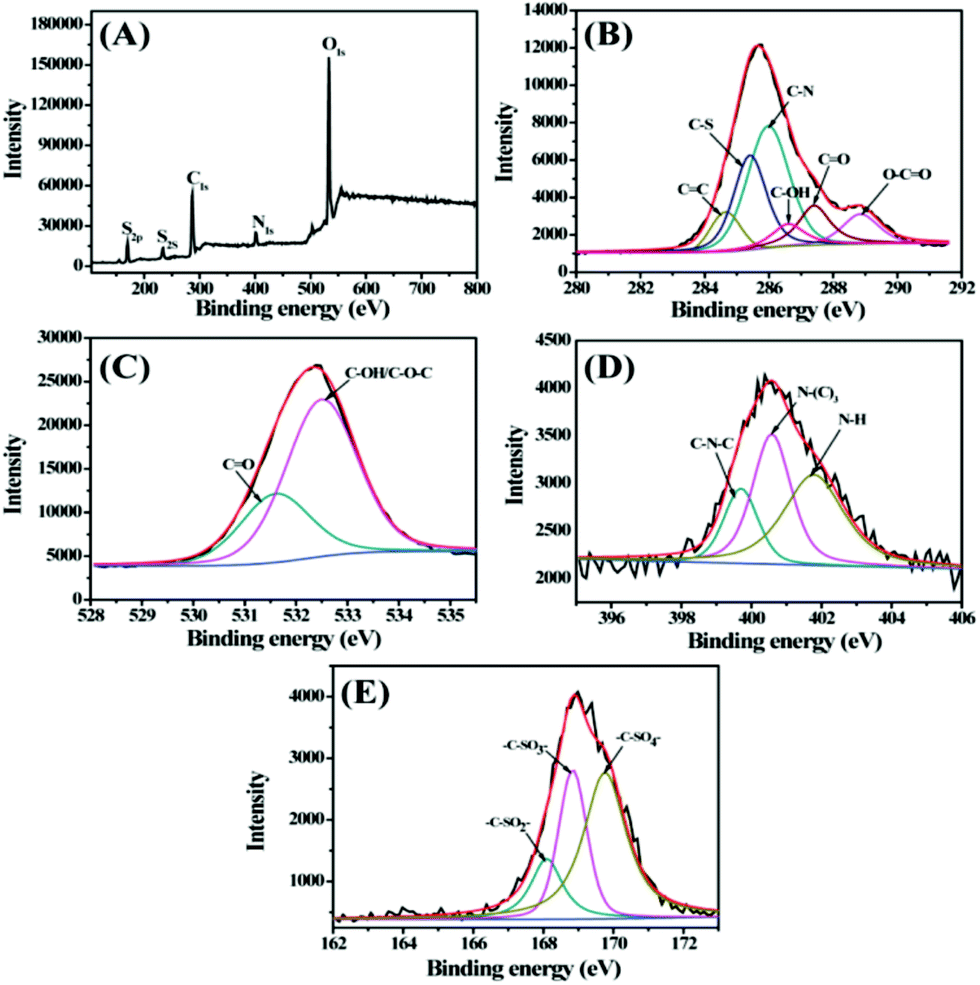
X-ray photoelectron spectroscopy was further performed to investigate the components of the as-synthesized S,N-CDs. As shown in Fig. 2A, two prominent peaks of C 1s (approximately 286 eV) and O 1s (approximately 532 eV) were accompanied by three small peaks of N1s (approximately 400 eV), S2s (approximately 234 eV), and S2p (approximately 169 eV) in the survey spectrum, indicating that the as-synthesized S,N-CDs mainly contained C, N, O, and S atoms. The high-resolution spectrum of C1s (Fig. 2B) was deconvoluted into six peaks at 284.6, 285.4, 286.0, 286.6, 287.4, and 288.9 eV, corresponding to the C–C/C![[double bond, length as m-dash]](https://www.rsc.org/images/entities/char_e001.gif) C, C–S, C–N, C–OH, CO, and O–CO peaks, respectively.25–27 In the high-resolution spectrum of O1s (Fig. 2C), the two main peaks corresponded to the CO and C–OH/C–O–C groups located at approximately 531.6 and 532.5 eV.26,28 The N1s spectrum exhibited three peaks at 399.7, 400.6, and 401.8 eV, which are ascribed to the C–N–C, N–(C)3, and N–H groups, respectively.29,30 The high-resolution spectrum of S2p in Fig. 2E shows three peaks at 168.1, 168.8, and 169.8 eV, which are associated with –C–SOx– (x = 2, 3, 4) species, such as sulfate or sulfonate.31 The sulfur on the S,N-CDs may come from casein or the thermal dehydration of sulfuric acid.32
C, C–S, C–N, C–OH, CO, and O–CO peaks, respectively.25–27 In the high-resolution spectrum of O1s (Fig. 2C), the two main peaks corresponded to the CO and C–OH/C–O–C groups located at approximately 531.6 and 532.5 eV.26,28 The N1s spectrum exhibited three peaks at 399.7, 400.6, and 401.8 eV, which are ascribed to the C–N–C, N–(C)3, and N–H groups, respectively.29,30 The high-resolution spectrum of S2p in Fig. 2E shows three peaks at 168.1, 168.8, and 169.8 eV, which are associated with –C–SOx– (x = 2, 3, 4) species, such as sulfate or sulfonate.31 The sulfur on the S,N-CDs may come from casein or the thermal dehydration of sulfuric acid.32
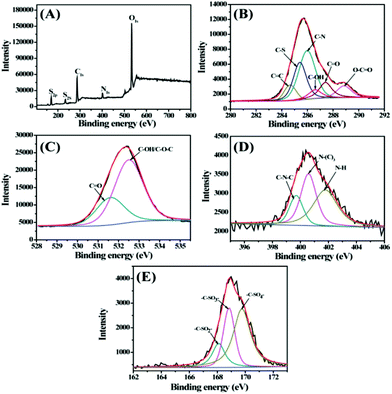 |
| | Fig. 2 (A) XPS survey spectra of S,N-CDs. High-resolution C 1s (B), O 1s (C), N 1s (D) and S 2p (E) peaks of the S,N-CDs. | |
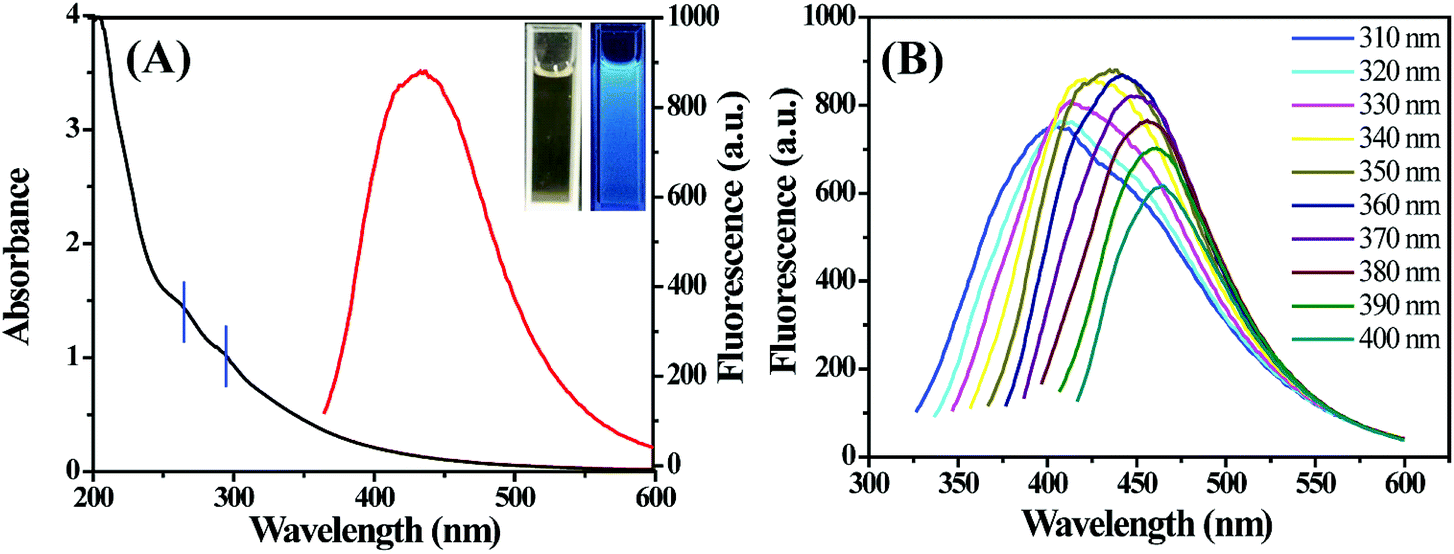
The as-prepared S,N-CDs aqueous solution was bright yellow and transparent under visible light, but emitted strong blue fluorescence under UV light (365 nm). The corresponding UV-Vis absorption and fluorescence spectra are shown in Fig. 3A. The UV-Vis spectrum of S,N-CDs showed two slight absorption peaks centered at 263 and 295 nm, which was attributed to the π–π* transition of CC and n–π* transition of CO, respectively.33 In the fluorescence spectrum of S,N-CDs, the optimal excitation and emission wavelengths were located at 350 and 435 nm, respectively. Moreover, the emission wavelength of S,N-CDs was red shifted from 400 nm to 465 nm as the excitation wavelength moved from 310 nm to 400 nm (Fig. 3B). This excitation-dependent fluorescence behavior is attributed to diverse surface states and different particle sizes,34 which will be useful in multicolor imaging applications. With quinine sulfate as the reference standard, the fluorescence quantum yield of S,N-CDs was estimated as 7.69%.
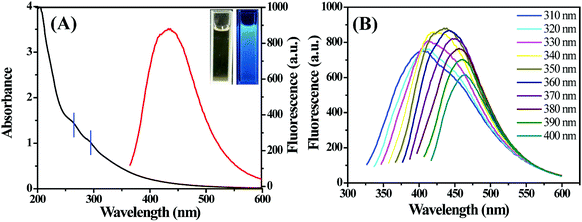 |
| | Fig. 3 (A) UV-Vis absorption (black line) and fluorescence (red line) spectra of S,N-CD solution (95 μg mL−1). Inset is the corresponding photographs taken under sunlight (left) and 365 nm UV light (right). (B) Fluorescence spectra of S,N-CDs at λex 310–400 nm, respectively. | |
Stability of S,N-CDs
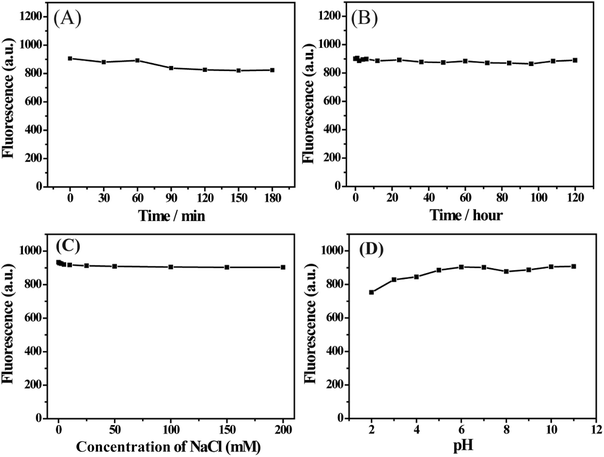
When the as-prepared S,N-CDs are used for practical applications, the materials must be stable in the ambient environment. The effects of UV lamp irradiation and storage time on the fluorescence intensity of S,N-CDs were explored. Fluorescence intensity did not significantly decrease after 3 h under UV light irradiation (Fig. 4A) or after five days of storage (Fig. 4B), implying excellent photostability and storage stability of the S,N-CDs. As shown in Fig. 4C, fluorescence intensity remained constant with the increase in ionic strength. This characteristic is important because it is necessary for S,N-CDs to remain stable under physiological conditions during practical applications. Moreover, we also investigated the effect of pH on the stability of S,N-CDs. As shown in Fig. 4D, the as-synthesized material presented a strong and stable fluorescence activity in the pH range of 2 to 11, and S,N-CDs still exhibited stable fluorescence even under extreme pH conditions. These results indicate that the as-synthesized S,N-CDs are highly stable.
 |
| | Fig. 4 Stability performance of S,N-CDs. Effect of UV lamp irradiation (A), storage time (B), ionic strength (C) and pH (D) on the fluorescence intensity of S,N-CDs. | |
Dox sensing and the fluorescence quenching mechanism
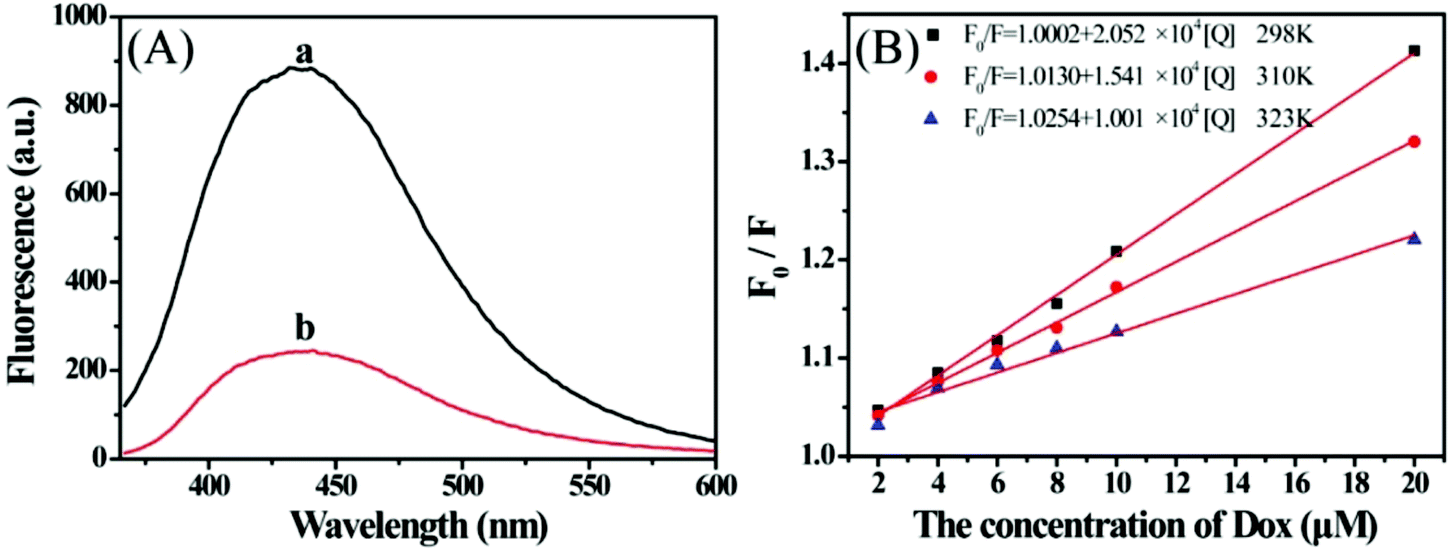
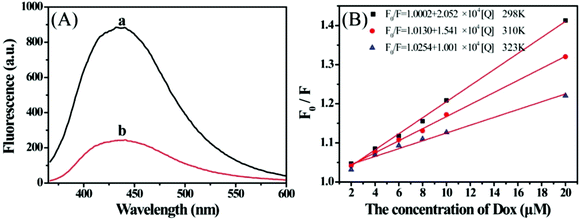
Fig. 5A depicts the fluorescence spectra of S,N-CDs in the absence and presence of Dox. S,N-CDs exhibited a strong fluorescence peak at 435 nm (Fig. 5, curve a). By contrast, Dox caused an obvious decrease in fluorescence intensity, implying that Dox effectively quenched S,N-CDs fluorescence. On the basis of the obvious fluorescence quenching, we constructed a sensitive fluorescence sensor for Dox detection. Scheme 1 presents the possible sensing principle for Dox detection.
 |
| | Fig. 5 (A) Fluorescence spectra of S,N-CDs in the absence (a) and presence (b) of Dox. (B) Stern–Volmer plots for S,N-CDs/Dox system at (■) 298 K, (●) 310 K and (▲) 323 K. | |
We investigated the corresponding quenching constants at different temperatures by using the Stern–Volmer equation to understand the detailed quenching mechanism between S,N-CDs and Dox:35
| | |
F0/F = 1 + KSV[Q] = 1 + Kqτ0[Q],
| (2) |
where
F and
F0 are the fluorescence intensities of S,N-CDs at 435 nm in the presence and absence of Dox, respectively,
KSV is the Stern–Volmer quenching constant,
Kq is the bimolecular reaction rate constant, [Q] is the Dox concentration, and
τ0 is the S,N-CDs lifetime in the absence of any quencher. In this research,
τ0 of S,N-CDs was estimated as 4.8249 ns.
Fig. 5B depicts the Stern–Volmer plots for the S,N-CDs/Dox system at different temperatures. The corresponding Stern–Volmer constants at different temperatures are shown in
Table 1.
KSV decreased with the increase in temperature, indicating that the fluorescence quenching process followed a static quenching mechanism.
35
Table 1 Stern–Volmer quenching constants at different temperatures (pH = 7.4)
| T (K) |
KSV (L mol−1) |
Kq (L mol−1 s−1) |
R |
| 298 |
2.052 × 10⁴ |
4.253 × 10¹² |
0.9989 |
| 310 |
1.541 × 10⁴ |
3.194 × 10¹² |
0.9991 |
| 323 |
1.001 × 10⁴ |
2.075 × 10¹² |
0.9905 |
Analytical detection of Dox by S,N-CDs
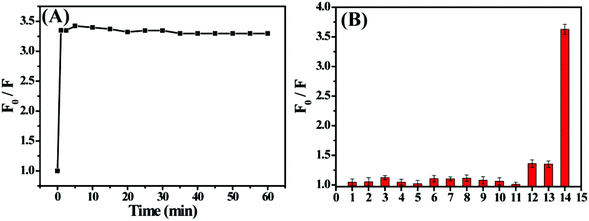
The effect of reaction time on the fluorescence quenching of S,N-CDs in the presence of Dox was further investigated to determine the optimal response time of the fluorescence sensor. As shown in Fig. 6A, the fluorescence intensity of S,N-CDs decreased rapidly after incubation for 1 min and became almost constant. We selected 5 min as the optimum reaction time in subsequent experiments to obtain stable and accurate experimental results.
 |
| | Fig. 6 (A) Effect of reaction time on fluorescence quenching of the S,N-CDs/Dox system. (B) Fluorescence intensity ratios (F0/F) of S,N-CDs in the presence of different targets (1–14: isoniazid, L-glutamic acid, dopamine, vitamin B6, tryptophan, Pb2+, Cu2+, Hg2+, Ni2+, Ba2+, Chl, Tet, Oxy and Dox). | |
The selectivity of S,N-CDs toward different targets was also investigated. As depicted in Fig. 6B, Dox had a significant quenching effect on the fluorescence of S,N-CDs, whereas Tet and Oxy only had slight effects. By contrast, no significant decrease in fluorescence was observed in the presence of other target molecules, such as isoniazid, dopamine, tryptophan, vitamin B6, L-glutamic acid, Pb2+, Cu2+, Hg2+, Ni2+, Ba2+ and Chl. These results indicate that the proposed assay method possesses outstanding selectivity and specificity for Dox detection. It is well known that the three antibiotics (Dox, Oxy and Tet) have a similar chemical structure (Fig. 1S†), however, they demonstrated a different fluorescence quenching ability towards S,N-CDs. A possible explanation may be ascribed to the molecular structure of tetracycline antibiotics. According to the reported literature,36,37 at pH = 7.4, the OH groups (the enolic site at C3, the phenolic proton at C10, or the dimethylammonium group) would be deprotonated, tetracycline antibiotics exhibited negative charges, and also bring about a “twisted” conformation. In this “twisted” conformation, Cl, C2, C3, Camide, and C4 lie above the plane of the BCD rings, and the dimethylammonium group projects away from the rest of the molecule,36,37 which would bring about larger steric hindrance to impede the interaction between the right part of the tetracycline antibiotics and the proper recognition sites of S,N-CDs. In addition, the OH group on C6 can be deprotonated for Tet and Oxy, it would cause strong electrostatic repulsion and decrease the chances of the interactions between S,N-CDs and Tet or Oxy. However, it was noted there is not OH group on C6 in the structure of Dox. Thus, it provides more the chances for the interactions between S,N-CDs and Dox, leading to the excellent selectivity ability for Dox.
Fig. 7 shows the fluorescence quenching spectra of S,N-CDs in the presence of various Dox concentrations. The fluorescence intensity of S,N-CDs at 435 nm gradually decreased with the increase in Dox concentrations in the range of 0 M to 2.0 × 10⁻⁴ M. The inset presents the relationship between relative fluorescence ratio (F0/F) and Dox concentration. Strong linear responses between ln(F0/F) and Dox concentration were obtained in the range of 1.0 × 10⁻⁷ M to 1.0 × 10⁻⁴ M (Fig. 7B). The corresponding linear regression equation is ln(F0/F) = 0.01568 × C (μM) + 0.01883 (r = 0.9995). The detection limit was 25 nM (S/N = 3), which is comparable with the results reported in previous studies (Table 2).
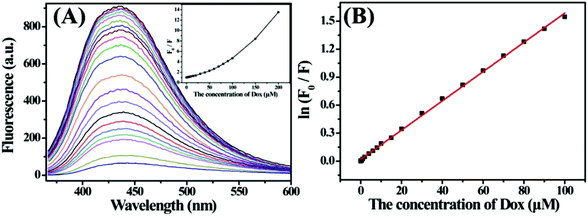 |
| | Fig. 7 (A) Fluorescence spectra of S,N-CDs (95 μg mL−1) in the presence of different concentration of Dox in 0.01 M PBS buffer (pH = 7.4). Inset is the relationship between F0/F and the concentration of Dox. (B) The linear plot between ln(F0/F) and the concentration of Dox. | |
Table 2 Comparison of different methods for Dox detection
| Method |
Line range |
Detection limit |
Ref. |
| Fluorescence (CdTe QDs) |
1.9 × 10⁻⁶ to 6.1 × 10⁻⁵ |
1.1 × 10⁻⁷ |
38 |
| Optical fiber sensor |
4.05 × 10⁻⁷ to 2.03 × 10⁻⁴ |
2.0 × 10⁻⁷ |
39 |
| Electrochemistry |
5 × 10⁻⁵ to 5 × 10⁻⁴ |
4.35 × 10⁻⁵ |
12 |
| Micellar electrokinetic capillary chromatography |
1.04 × 10⁻⁵ to 1.90 × 10⁻⁴ |
2.0 × 10⁻⁶ |
40 |
| Flow injection/pulsed amperometric |
1 × 10⁻⁶ to 1 × 10⁻⁴ |
1 × 10⁻⁶ |
41 |
| HPLC-DAD/LC-ESI-MS |
— |
6 × 10⁻⁶ |
42 |
| Spectrofluorimetric |
4.2 × 10⁻⁶ to 6.2 × 10⁻⁵ |
— |
43 |
| Magnetic separation/UV-Vis |
4.2 × 10⁻⁶ to 5.2 × 10⁻⁴ |
— |
44 |
| Chemically modified electrode |
1.99 × 10⁻⁵ to 3.19 × 10⁻³ |
1.33 × 10⁻⁵ |
45 |
| Solid-phase fluorescence |
3 × 10⁻⁷ to 3 × 10⁻⁵ |
1.1 × 10⁻⁷ |
46 |
| Bioassay |
— |
4.6 × 10⁻⁸ |
47 |
| Voltammetry/amperometric method |
1.0 × 10⁻⁶ to 1.0 × 10⁻⁴ |
4.4 × 10⁻⁷ |
48 |
| Fluorescence (S,N-CDs) |
1.0 × 10⁻⁷ to 1.0 × 10⁻⁴ |
2.5 × 10⁻⁸ |
This work |
Dox detection in food samples
We used the proposed method to detect Dox in raw milk to investigate the applicability of the as-synthesized S,N-CDs for Dox detection in real food samples. Raw milk was spiked with known quantities of Dox. Afterward, mixed samples were pretreated and analyzed according to the protocol described in Sections 2.5 and 2.6. As shown in Table 3, the recovery rates ranged from 96.3% to 101.3%, whereas the relative standard deviations ranged from 1.42% to 3.15%, implying that the proposed detection method has good reliability and excellent accuracy. Moreover, the entire experimental process, including the sample pretreatment procedure and analysis stage, only required 1 h, indicating that our method can be used for rapid Dox detection in raw milk samples.
Table 3 Application of the proposed method for the determination of Dox in raw milk samples spiked with different concentrations of Dox (n = 3)
| Sample |
Added Dox (μM) |
Measured Dox (μM) |
Recovery (%) |
RSD (%) |
| Raw milk |
0 |
Not detected |
— |
— |
| 3.27 |
3.31 |
101.3 |
1.42 |
| 5.00 |
4.89 |
97.7 |
2.91 |
| 32.68 |
31.48 |
96.3 |
3.15 |
Conclusion
In summary, S,N-CDs with excellent stabilities were synthesized by carbonization of casein in concentrated sulfuric acid. The as-prepared S,N-CDs emitted bright blue fluorescence and exhibited monodispersed quasi-spherical morphology with a size distribution of 4.3 nm to 6.3 nm. Without further chemical modifications, the as-synthesized S,N-CDs were successfully utilized to develop a sensitive and selective sensing system for Dox detection in raw milk samples. This research may extend the potential application of CDs nanomaterials in food and medical monitoring fields because of their low-cost and simpler synthesis procedure and their extraordinary selectivity and sensitivity.
Acknowledgements
This work was supported by the National Natural Science Foundation of China (21301111), the Natural Science Foundation of Shanxi Province of China (2015011017, 2015021049), and Scientific and Technological Innovation Programs of Higher Education Institutions in Shanxi (2015181), the Industrial Science and Technology Project of Datong City (2015019), Research Project Supported by Shanxi Scholarship Council of China (2016-105).
Notes and references
- P. J. Ramesh, K. Basavaiah and N. Rajendraprasad, Acta Pharm., 2010, 60, 445–454 CrossRef CAS PubMed.
- M. Augenbraun, L. Bachmann, T. Wallace, L. Dubouchet, W. McCormack and E. W. Hook, Sex. Transm. Dis., 1998, 25, 1–4 CrossRef CAS PubMed.
- B. A. Cunha, C. M. Sibley and A. M. Ristuccia, Ther. Drug Monit., 1982, 4, 115–135 CrossRef CAS PubMed.
- S. G. Bryant, S. Fisher and R. M. Kluge, Pharmacotherapy, 1987, 7, 125–129 CrossRef CAS PubMed.
- S. Croubels, C. Vanpeteghem and W. Baeyens, Analyst, 1994, 119, 2713–2716 RSC.
- M. Jeon and I. R. Paeng, Anal. Chim. Acta, 2008, 626, 180–185 CrossRef CAS PubMed.
- E. Angelakis, N. Armstrong, C. Nappez, M. Richez, E. Chabriere and D. Raoult, J. Infect., 2015, 71, 511–517 CrossRef PubMed.
- S. M. Sunarić, M. S. Denić, Z. Z. Bojanić and V. V. Bojanić, J. Chromatogr. B: Anal. Technol. Biomed. Life Sci., 2013, 939, 17–22 CrossRef PubMed.
- H. T. Lu, Y. Jiang, H. B. Li, F. Chen and M. H. Wong, Chromatographia, 2004, 60, 259–264 CAS.
- S. Li, J. Li, Q. Lin and X. Wei, Analyst, 2015, 140, 4702–4707 RSC.
- C. Q. Jiang and N. Zhang, J. Pharm. Biomed. Anal., 2004, 35, 1301–1306 CrossRef CAS PubMed.
- B. Gürler, S. P. Özkorucuklu and E. Kır, J. Pharm. Biomed. Anal., 2013, 84, 263–268 CrossRef PubMed.
- J. Adrian, F. Fernandez, F. Sanchez-Baeza and M. P. Marco, J. Agric. Food Chem., 2012, 60, 3837–3846 CrossRef CAS PubMed.
- A. Gajda, A. Posyniak, J. Zmudzki and G. Tomczyk, J. Chromatogr. B: Anal. Technol. Biomed. Life Sci., 2013, 928, 113–120 CrossRef CAS PubMed.
- C. Jiang, A. Saha, C. Xiang, C. C. Young, J. M. Tour, M. Pasquali and A. A. Marti, ACS Nano, 2013, 7, 4503–4510 CrossRef CAS PubMed.
- K. Han, P. Miao, H. Tong, T. Liu, W. Cheng, X. Zhu and Y. Tang, Appl. Phys. Lett., 2014, 104, 053101 CrossRef.
- C. Jiang, A. Saha, C. C. Young, D. P. Hashim, C. E. Ramirez, P. M. Ajayan, M. Pasquali and A. A. Marti, ACS Nano, 2014, 8, 9107–9112 CrossRef CAS PubMed.
- A. Saha, C. Jiang and A. A. Marti, Carbon, 2014, 79, 1–18 CrossRef CAS.
- Y. Dong, R. Wang, W. Tian, Y. Chi and G. Chen, RSC Adv., 2014, 4, 3701–3705 CAS.
- X. Yang, Y. Luo, S. Zhu, Y. Feng, Y. Zhuo and Y. Dou, Biosens. Bioelectron., 2014, 56, 6–11 CrossRef CAS PubMed.
- Y. Feng, D. Zhong, H. Miao and X. Yang, Talanta, 2015, 140, 128–133 CrossRef CAS PubMed.
- N. Dhenadhayalan and K. C. Lin, Sci. Rep., 2015, 5, 10012 CrossRef CAS PubMed.
- T. Le, Z. Zhao, W. Wei and D. Bi, Food Chem., 2012, 134, 2442–2446 CrossRef CAS PubMed.
- Y. Dong, R. Wang, H. Li, J. Shao, Y. Chi, X. Lin and G. Cheng, Carbon, 2012, 50, 2810–2815 CrossRef CAS.
- C. Mattevi, G. Eda, S. Agnoli, S. Miller, K. A. Mkhoyan, O. Celik, D. Mastrogiovanni, G. Granozzi, E. Garfunkel and M. Chhowalla, Adv. Funct. Mater., 2009, 19, 2577–2583 CrossRef CAS.
- S. Liu, J. Tian, L. Wang, Y. Zhang, X. Qin, Y. Luo, A. M. Asiri, A. O. Al-Youbi and X. Sun, Adv. Mater., 2012, 24, 2037–2041 CrossRef CAS PubMed.
- J. P. Paraknowitsch, Y. J. Zhang, B. Wienert and A. Thomas, Chem. Commun., 2013, 49, 1208–1210 RSC.
- W. Lu, X. Qin, S. Liu, G. Chang, Y. Zhang, Y. Luo, A. M. Asiri, A. O. Al-Youbi and X. Sun, Anal. Chem., 2012, 84, 5351–5357 CrossRef CAS PubMed.
- Z. Qian, J. Ma, X. Shan, H. Feng, L. Shao and J. Chen, Chem.–Eur. J., 2014, 20, 2254–2263 CrossRef CAS PubMed.
- X. Chen, Q. Jin, L. Wu, C. Tung and X. Tang, Angew. Chem., Int. Ed., 2014, 53, 12542–12547 CAS.
- D. Sun, R. Ban, P. H. Zhang, G. H. Wu, J. R. Zhang and J. J. Zhu, Carbon, 2013, 64, 424–434 CrossRef CAS.
- S. Chandra, P. Patra, S. H. Pathan, S. Roy, S. Mitra, A. Layek, R. Bhar, P. Pramanik and A. Goswami, J. Mater. Chem. B, 2013, 1, 2375–2382 RSC.
- Q. Mei and Z. Zhang, Angew. Chem., Int. Ed., 2012, 51, 5602–5606 CrossRef CAS PubMed.
- X. Li, H. Wang, Y. Shimizu, A. Pyatenko, K. Kawaguchi and N. Koshizaki, Chem. Commun., 2011, 47, 932–934 RSC.
- H. Xu, X. Yang, G. Li, C. Zhao and X. Liao, J. Agric. Food Chem., 2015, 63, 6707–6714 CrossRef CAS PubMed.
- F. C. machado, C. Demicheli, A. Garnier-Suillerot and H. Beraldo, J. Inorg. Biochem., 1995, 60, 163–173 CrossRef CAS PubMed.
- W. Chen and C. Huang, Environ. Sci. Technol., 2009, 43, 401–407 CrossRef CAS PubMed.
- J. Tashkhourian, G. Absalan, M. Jafari and S. Zare, Spectrochim. Acta, Part A, 2016, 152, 119–125 CrossRef CAS PubMed.
- W. Liu, Y. Wang, J. Tang, G. Shen and R. Yu, Analyst, 1998, 123, 365–369 RSC.
- R. Injac, J. Kac, S. Kreft and B. Strukelj, Anal. Bioanal. Chem., 2007, 387, 695–701 CrossRef CAS PubMed.
- T. Charoenraks, S. Palaharn, K. Grudpan, W. Siangproh and O. Chailapakul, Talanta, 2004, 64, 1247–1252 CrossRef CAS PubMed.
- J. Fiori, G. Grassigli, P. Filippi, R. Gotti and V. Cavrini, J. Pharm. Biomed. Anal., 2005, 37, 979–985 CrossRef CAS PubMed.
- H. M. Lotfy, M. A. Hegazy, S. Mowaka and E. H. Mohamed, Spectrochim. Acta, Part A, 2016, 153, 321–332 CrossRef CAS PubMed.
- M. Ghaemi and G. Absalan, J. Iran. Chem. Soc., 2015, 12, 1–7 CrossRef CAS.
- Y. M. Issa, H. M. Abdel-Fattah and N. B. Abdel-Moniem, Int. J. Electrochem. Sci., 2013, 8, 9578–9592 CAS.
- I. I. Parashchenko, T. D. Smirnova, S. N. Shtykov, V. I. Kochubei and N. N. Zhukova, J. Anal. Chem., 2013, 68, 112–116 CrossRef CAS.
- W. Kleibeuker, X. Zhou, M. Centlivre, N. Legrand, M. Page, N. Almond, B. Berkhout and A. T. Das, Hum. Gene Ther., 2009, 20, 524–530 CrossRef CAS PubMed.
- D. Vega, L. Agüí, A. González-Cortés, P. Yáñez-Sedeño and J. M. Pingarrón, Anal. Bioanal. Chem., 2007, 389, 951–958 CrossRef CAS PubMed.
Footnote |
| † Electronic supplementary information (ESI) available. See DOI: 10.1039/c7ra01074e |
|
| This journal is © The Royal Society of Chemistry 2017 |
Click here to see how this site uses Cookies. View our privacy policy here. 
 Open Access Article
 This Open Access Article is licensed under a
  *b,
Feng Feng*ab and
Chuan Dong*a
*b,
Feng Feng*ab and
Chuan Dong*a