DOI:
10.1039/C7RA01058C
(Paper)
RSC Adv., 2017,
7, 23896-23906
Equilibrium, kinetic and thermodynamic studies of acid soluble lignin adsorption from rice straw hydrolysate by a self-synthesized macro/mesoporous resin
Received
24th January 2017
, Accepted 24th April 2017
First published on 3rd May 2017
Abstract
A self-synthesized HQ-8 resin was prepared using a O/W suspension polymerization technique and employed as a potential adsorbent for the removal of acid soluble lignin (ASL) from rice straw hydrolysate (RSH). The structure and morphology of the HQ-8 resin before and after the adsorption of ASL were characterized by Fourier transform infrared spectroscopy (FT-IR), scanning electron microscopy (SEM) and nitrogen adsorption–desorption isotherms. A series of adsorption conditions such as pH value, adsorbent dose, initial concentration, and temperature were systematically investigated to obtain the optimum process parameters. Within the studied range of ASL concentrations, the adsorption equilibrium was found to follow the Freundlich isotherm model well, with R2 > 0.988. The rate of ASL adsorption onto the HQ-8 resin was very quick, and equilibrium was reached within 50 min of contact. Furthermore, the maximum adsorption capacity of ASL on the HQ-8 resin was 64.61 mg g−1 at 298 K at an initial solution pH of 1. The regression results revealed that the ASL adsorption kinetics was represented accurately by a pseudo-second-order model. The efficiency of the HQ-8 resin for the spontaneous and exothermic adsorption of ASL is attributed to the hydrophobic interaction between the cross-linked benzene ring of the HQ-8 resin and the aromatic ring of ASL. In addition, the activation energy of ASL adsorption onto the HQ-8 resin was 35.99 kJ mol−1. In summary, the present adsorption studies of ASL from RSH revealed the potential of a self-synthesized HQ-8 resin to be applied as an alternative adsorbent for lignocellulose hydrolysate detoxification.
1. Introduction
Growing concerns over environmental pollution and the depletion of fossil resources have spurred global interest in searching for an alternative source of energy from a renewable source to produce fuels and high value-added chemicals.1,2 In recent years, lignocellulose agricultural waste has become a potential carbon source to generate biofuels, because it possesses characteristics of abundance, low cost and high sugar content, and it also does not compete with human food resources.3–5 In China, rice straw is one of the most abundant agricultural wastes and is often abandoned in fields or burned, resulting in a huge waste of resources and serious environmental pollution.6 A better approach to deal with rice straw is to convert them into biofuels by pretreatment, hydrolysis and fermentation techniques.
To date, several hydrolysis methods in terms of chemical hydrolysis, dilute acid hydrolysis, concentrated acid hydrolysis, enzymatic hydrolysis, as well as ionic liquid were applied to convert lignocellulose materials to simple sugars.7 Among these methods, dilute acid hydrolysis is the most commonly applied method for producing sugars from lignocellulose in industrial application due to it has lower cost and faster hydrolysis rate than enzyme hydrolysis.8 However, dilute acid hydrolysis of lignocellulose materials not only produces fermentable reducing sugars but also generates a series of toxic compounds, such as lignin degradation products, and compounds derived from lignocellulose structure, which are toxic to the fermentation microorganisms and strongly interfere with fermentation efficiency.9–11 Compared with other inhibitors, acid soluble lignin (ASL) mostly as phenolic compounds of low molar mass has stronger toxic effect on microorganisms and remains in the hydrolysate.12–14 Furthermore, rice straws possess high lignin content,15 therefore, rice straw hydrolysate need to be detoxificated to remove ASL before fermentation.
Recently, different detoxification methods and technologies have been used for removal of ASL from actual biomass hydrolysate, including overliming,16 bio-flocculants,17 electrochemical18 and adsorption.19–21 Among these methods, adsorption has received major concern due to the significant advantages such as low cost, environmentally friendly, high efficiency and energy-saving. Generally, activated carbon, anion-exchange resin and adsorption resin are commonly adsorbents have been used for remove of phenolic compounds from aqueous solution or actual biomass hydrolysate.19–21 However, detoxification biomass hydrolysate by activated carbon for industrial scale application is limited due to its relatively expensive, low selectivity and difficult regeneration and reuse. Although ion-exchange adsorption is regarded as an effective method for phenolic compounds removal, the most prominent shortcoming is that it is inevitable to use a large amount of acid and alkali in the pretreatment and desorption processes, which increases the cost of separation and produces significant amounts of acid and alkali wastewaters.
Adsorption resins have drawn considerable attention for potential application in separation due to its unique structure and extraordinary adsorption properties.22 Until present time, only one published work has specifically focused on ASL removal from biomass hydrolysate using adsorption resin.19 However, the adsorption equilibrium and kinetics of ASL were not investigated. In this work, a novel macro/mesoporous adsorption resin was developed and used to remove ASL from rice straw hydrolysate. The structure and morphology of HQ-8 resin before and after the adsorption of ASL was characterized by Fourier transform infrared (FT-IR) spectroscopy, scanning electron microscopy (SEM) and nitrogen adsorption–desorption isotherms. The adsorption conditions such as pH value, adsorbent dose, initial concentration and temperature were investigated in detail. The adsorption isotherms, kinetics and thermodynamics of ASL onto HQ-8 resin were also discussed systematically.
2. Material and methods
2.1. Materials
Styrene (St), benzoyl peroxide (BPO), poly vinyl alcohol (PVA) (87–89% hydrolyzed, average Mw 124–186 kg mol−1), toluene, methylene blue and liquid paraffin were purchased from Sinopharm Chemical Reagent Co., Ltd., China. Divinyl benzene (63% mixture of isomers remaining ethyl vinyl benzene) was purchased from ZiAn Chemical Co., Ltd., Jinan, China. All materials used in the present study without further purification.
Rice straw was collected from local farmer (Huaian, China). The crude composition of rice straw has been reported to be moisture: 15–18%; cellulose: 41%; hemicellulose: 30%; lignin: 16%; ashes: 10–13%. The rice straw hydrolysate was kindly supplied by Zhongke New Energy Technology Co., Ltd., Huaian, China.
2.2. Methods
2.2.1 Synthesis of HQ-8 resin. HQ-8 resin was synthesized by O/W suspension polymerization technique. Aqueous solution (240 g) containing 0.6 g PVA (0.25 wt%) and few drops 1% methylene blue was transferred into a three-necked round-bottomed flask equipped with a thermometer, a mechanical stirrer, and a reflux condenser, and then was heated to 323 K. Organic solution containing 0.4 g BPO, 40 g monomers (mSt![[thin space (1/6-em)]](https://www.rsc.org/images/entities/char_2009.gif) :
:![[thin space (1/6-em)]](https://www.rsc.org/images/entities/char_2009.gif) mDVB = 1
mDVB = 1![[thin space (1/6-em)]](https://www.rsc.org/images/entities/char_2009.gif) :
:![[thin space (1/6-em)]](https://www.rsc.org/images/entities/char_2009.gif) 1), and 40 g pore-forming agent (mtoluene
1), and 40 g pore-forming agent (mtoluene![[thin space (1/6-em)]](https://www.rsc.org/images/entities/char_2009.gif) :
:![[thin space (1/6-em)]](https://www.rsc.org/images/entities/char_2009.gif) mliquid paraffin = 1
mliquid paraffin = 1![[thin space (1/6-em)]](https://www.rsc.org/images/entities/char_2009.gif) :
:![[thin space (1/6-em)]](https://www.rsc.org/images/entities/char_2009.gif) 1) was added into the flask, and then nitrogen was bubbled through the mixture for 10 min. The mixture was stirred to form a suspension of oil beads with a suitable size in an aqueous solution and then gradually heated to 353 K within 3 h. The reaction was maintained stirred at 353 K for approximately 5 h. After copolymerization, the copolymer beads were filtered out and washed with a large amount of hot water three times, then packed in a fixed-bed column and eluted with anhydrous ethanol until the eluant is transparent when mixed with water. The resins were extracted with ethanol for 24 h in a Soxhlet to remove pore-forming agent and residual monomers, and then were washed with de-ionized water and anhydrous ethanol three times, respectively, to ensure complete removal of impurities. Finally, the resins were dried under vacuum at 333 K for 10 h.
1) was added into the flask, and then nitrogen was bubbled through the mixture for 10 min. The mixture was stirred to form a suspension of oil beads with a suitable size in an aqueous solution and then gradually heated to 353 K within 3 h. The reaction was maintained stirred at 353 K for approximately 5 h. After copolymerization, the copolymer beads were filtered out and washed with a large amount of hot water three times, then packed in a fixed-bed column and eluted with anhydrous ethanol until the eluant is transparent when mixed with water. The resins were extracted with ethanol for 24 h in a Soxhlet to remove pore-forming agent and residual monomers, and then were washed with de-ionized water and anhydrous ethanol three times, respectively, to ensure complete removal of impurities. Finally, the resins were dried under vacuum at 333 K for 10 h.
2.2.2 Characterization. The shape and surface morphology of HQ-8 resin before and after the adsorption of ASL was observed by a Hitachi SU70 scanning electron microscope (Hitachi, Japan) operated at 2.0 kV and 10 μA. The specific surface area, pore diameter distribution and pore volume of HQ-8 resin were determined by nitrogen adsorption–desorption isotherms at 77 K using an ASIQMO002-2 analyzer (Quantachrome, USA). Prior to the measurement, the adsorbent (∼80 mg) was outgassed at 363 K for 15 h to remove the adsorbed gases and other impurities. The Fourier transform infrared (FT-IR) spectroscopy of the resin was collected on a TENSOR27 (Germany) Fourier transformed infrared instrument using KBr disks.
2.2.3 Effect of initial solution pH on ASL uptake. The effect of solution pH on the adsorption of ASL onto HQ-8 resin was investigated by equilibrating the adsorption mixture with the resin and rice straw hydrolysate at different pH values between 1 and 7. Static adsorption test was performed using 100 mL Erlenmeyer flasks containing 1.0 g of resin and 50 mL hydrolysate. The conical flasks were then shaken at 160 rpm in a thermostatic shaker for 3 h at 298 K. After equilibrium, the liquid phase was sampled with a syringe equipped with the Whatman Spartan 30/0.45 RC syringe filter (0.45 μm) to remove suspended solids. The residual ASL concentration was determined by a UV spectrophotometer, and the adsorption capacity of ASL onto the resin was calculated using the following equation:23,24| |
 | (1) |
2.2.4 Effect of adsorbent dose on the extent of removal of ASL. Different adsorbent doses (0.5, 1.0, 1.5, 2.0, 2.5, 3.0, and 5.0 g) of HQ-8 resin were added into 50 mL hydrolysate in which the concentration of ASL and pH was kept original without any adjustment. The adsorption procedures were the same as described for the effect of pH on ASL uptake.
2.2.5 Adsorption isotherms. 50 mL hydrolysate with different concentrations of ASL (0.83–4.10 g L−1) was contacted with 1.0 g dry resin in 100 mL conical flasks. The flasks were continually shaken in a thermostatic shaker (160 rpm) for 3 h at temperatures of 288, 298, 308 and 318 K, respectively. After equilibrium was reached, the concentrations of ASL in hydrolysate were analyzed by a UV spectrophotometer. The adsorption uptakes of ASL onto the resin were calculated using eqn (1).
2.2.6 Adsorption kinetics. The adsorption kinetics curves of ASL on the HQ-8 resin were performed to evaluate the influence of contact time, at different initial ASL concentrations (0.83, 2.06, and 4.10 g L−1) at various temperatures (288, 298, 318, and 338 K). In the kinetic experiments, 500 mL hydrolysate was contacted with 10 g dry resin in a three-necked flask. Then, the flask was continually shaken in a thermostat water bath with agitation at 160 rpm. Subsequently, the concentration of ASL in the adsorption solution was determined by a UV spectrophotometer at different times until the adsorption equilibrium reached. The amount of ASL on HQ-8 resin at any contact time, t, was calculated as:25| |
 | (2) |
2.2.7 Reusability evaluation. The regeneration and reusability experiments of HQ-8 resin for ASL was performed using 100 mL Erlenmeyer flasks containing 1.0 g of ASL-loaded resin and 50 mL 95% ethanol in a thermostatic shaker (160 rpm) for 3 h at room temperature. The resins were then filtered and washed with deionized water, allowed to dry and subsequently applied for another adsorption process. The adsorption and desorption procedure was repeated several times.
2.2.8 Analytical methods. The concentrations of ASL in the rice straw hydrolysate were analyzed using the National Renewable Energy Laboratory (NREL) analytical procedures.26 The sugar concentrations (D-xylose, L-arabinose and D-glucose) in the rice straw hydrolysate were measured by high performance liquid chromatography (HPLC) as previously described.27All the adsorption experiments in this study were carried out at least three times to ensure repeatability.
3. Results and discussion
3.1. Characterization
A FT-IR spectrum was performed to characterize the structure of the HQ-8 resin. For the spectrum of the unloaded resin HQ-8 (Fig. 1(a)), the adsorption peaks appearing at 3082 cm−1, 3057 cm−1 and 3038 cm−1 were due to the asymmetric and symmetric stretching vibration of C–H bond of the benzene ring. The adsorption peaks at 1604 cm−1 and 1488 cm−1 were further evidenced presence benzene ring. The asymmetric and symmetric stretching vibration of CH2 (CH3) is confirmed by the presence of peaks at 2920 cm−1 and 2854 cm−1. In addition, the presence of C![[double bond, length as m-dash]](https://www.rsc.org/images/entities/char_e001.gif) C group is identified by the presence of peaks at 1604 cm−1, 1498 cm−1 and 1446 cm−1. The IR spectrum of the HQ-8 resin after loading with ASL (Fig. 1(b)) displays a new strong band at 3442 cm−1 is attributed to the presence of –OH due to the fact that the ASL in the hydrolysates largely as phenolic compounds of low molar mass.
C group is identified by the presence of peaks at 1604 cm−1, 1498 cm−1 and 1446 cm−1. The IR spectrum of the HQ-8 resin after loading with ASL (Fig. 1(b)) displays a new strong band at 3442 cm−1 is attributed to the presence of –OH due to the fact that the ASL in the hydrolysates largely as phenolic compounds of low molar mass.
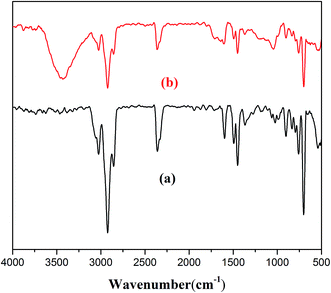 |
| | Fig. 1 FT-IR spectrum of (a) HQ-8 resin (b) HQ-8 resin loaded with ASL. | |
The morphology and surface of HQ-8 resin was observed by SEM, which are demonstrated in Fig. 2(A) and (C). As it depicted, the HQ-8 resin had a spherical form, a rough internal surface and a large number of macropores and mesopores. As showed in Fig. 2(E), the shape of the N2 adsorption–desorption isotherm curves of the HQ-8 resin seem to close to type IV. A well-defined capillary condensation step occurred between the P/P0 of 0.05–0.90 with a H1-type hysteresis loop, suggested that the material possesses a uniform mesoporous structure. Moreover, the visible hysteresis loop of desorption isotherm with a relative pressure (P/P0) over 0.90 indicated that HQ-8 resin had a structure of macropores.28 These analyses were in accordance with the pore diameter distribution in Fig. 2(F). Furthermore, it can be seen from Fig. 2(F) that the mesoporous are the main pores for HQ-8 resin and the average pore diameter is 32 nm. The HQ-8 resins loaded with ASL were examined using SEM for morphological structure investigations. As can be seen in Fig. 2, it is obvious that HQ-8 resin exhibits less porosity in the adsorption reached equilibrium (Fig. 2(D)) than without adsorption (Fig. 2(C)). This conclusion is also confirmed by surface area measurements using nitrogen adsorption–desorption isotherms, which indicate that the BET surface areas of HQ-8 resin before and after the adsorption of ASL are 199.103 and 58.907 m2 g−1. Textural parameters derived from the nitrogen adsorption–desorption isotherm data are summarized in Table 1. Based on Table 1, it can be concluded that the HQ-8 resin contains a well-developed pore structure and mesopores play a predominant role. The majority of mesopores volume was about 99.44% of the total pore volume, and the mesopore area contributed 75.73% to the total surface area. Besides, when the resin adsorbed the ASL, the textural parameters, such as BET surface area, mesopore area, macropore area, total pore volume, mesopore volume and macropore volume, is obviously decreasing.
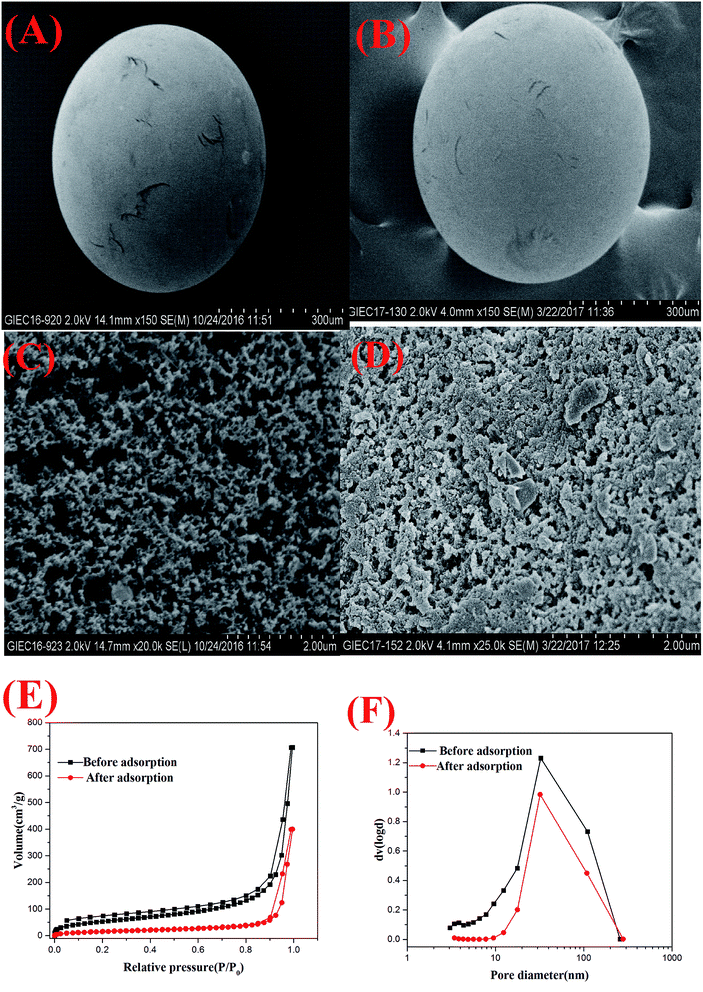 |
| | Fig. 2 Characterization of HQ-8 resin: SEM image of (A) (C) HQ-8 resin, (B) (D) HQ-8 resin loaded with ASL; (E) N2 adsorption–desorption isotherms and (F) pore diameter distribution. | |
Table 1 Physiochemical properties of HQ-8 resin before and after the adsorption of ASL
| Resin |
Before adsorption |
After adsorption |
| Grain shape |
Spherical beads |
Spherical beads |
| Appearance |
White |
Brown |
| Structure |
Polystyrene divinylbenzene |
— |
| Polarity |
Nonpolar |
— |
| Particle size (mm) |
0.25–0.85 |
0.25–0.85 |
| Average pore diameter (nm) |
21.965 |
41.938 |
| BET surface area (m2 g−1) |
199.103 |
58.907 |
| Mesopore area, Smeso (m2 g−1) |
150.784 |
58.799 |
| Macropore area, Smacro (m2 g−1) |
48.319 |
0.108 |
| Total pore volume (cm3 g−1) |
1.093 |
0.618 |
| Mesopore volume (cm3 g−1) |
1.036 |
0.616 |
| Macropore volume (cm3 g−1) |
0.057 |
0.002 |
3.2. Effect of the initial solution pH on the sorption
The pH of the initial solution is an important parameter in the adsorption process. In this work, the acid hydrolysate was strongly acidic (pH1) and in order to avoid consuming lots of alkali, the pH was controlled from 1 to 7. Effect of solution pH on the ASL adsorption capacity is presented in Fig. 3. It showed that the ASL adsorption capacity decreased as the pH value increased. When the pH increased from 1 to 7, the ASL adsorption capacity decreased from 66 mg g−1 to 49 mg g−1. It seemed that HQ-8 resin could adsorb ASL of the rice straw hydrolysate more efficiently under acidic condition. The most of ASL in the hydrolysate are phenolic compounds of low molar mass.29 It is inferred that the phenolic compounds had stronger affinity with HQ-8 resin in the acidic solution. It may be attributed to the fact that as the pH value increased, the amount of forming the negative ionic form of phenol is increase.30 Therefore, all the following experiments were carried out at the initial pH.
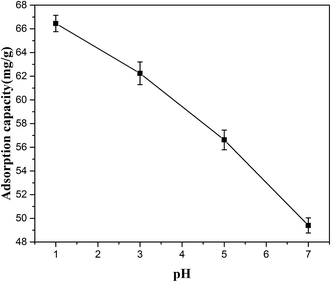 |
| | Fig. 3 Effect of pH on the adsorption of ASL on HQ-8 resin. | |
3.3. Effect of adsorbent dose on the extent of removal of ASL
The selectivity of HQ-8 resin between ASL and sugars is a significantly important parameter in the detoxification process. Selectivity coefficient (βASL/sugar) was computed using eqn (3) in order to evaluate the selectivity of HQ-8 resin for ASL compared to sugars.31| | |
βASL/sugar = DASL/Dsugar
| (3) |
Where DASL and Dsugar are the distribution coefficients of ASL and sugars, respectively, which can be expressed as:32| |
 | (4) |
The competitive adsorption of ASL in rice straw hydrolysate containing D-xylose, L-arabinose and D-glucose in addition to ASL was examined. The selectivity parameters including distribution and selectivity coefficients are shown in Table 2. As can be seen, the HQ-8 resin exhibits a high distribution coefficient with respect to D-xylose, L-arabinose, D-glucose and total sugar, which indicates the ASL had stronger affinity with HQ-8 resin. Moreover, the selectivity coefficient greater than 1 for each sugar, revealed the high adsorption selectivity between ASL and sugar. It is attributed to the hydrophobic interaction between cross-linked benzene ring of HQ-8 resin and the aromatic ring of ASL.
Table 2 Selective adsorption of ASL from rice straw hydrolysate by HQ-8 resin
| Components |
Distribution coefficient (mL g−1) |
Selectivity coefficient |
| ASL |
30.56 ± 0.68 |
— |
| D-Xylose |
1.39 ± 0.09 |
22.00 ± 0.97 |
| L-Arabinose |
1.57 ± 0.11 |
19.75 ± 1.51 |
| D-Glucose |
1.96 ± 0.09 |
15.61 ± 0.54 |
| Total sugar |
1.51 ± 0.05 |
20.19 ± 0.53 |
The effect of adsorbent dose in the range of 0.5–5.0 g on removal of ASL and sugar loss was studied. As shown in Fig. 4, it was apparent from the results that the extent of ASL adsorption efficiency increased by increasing the resin amount. This phenomenon was probably due to the fact that the number of available adsorption sites increases with an increase in the resin dose, resulting in an increase in removal efficiency. However, the total sugar lost also increased by increasing the resin amount. Comprehensive consider of the ASL adsorption efficiency and the total sugar loss, 1.0 g dry resin was selected as the most suitable adsorbent dosage in the following experiments.
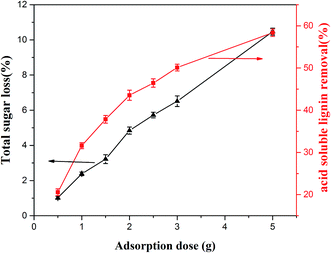 |
| | Fig. 4 Effect of adsorbent dose on removal extent of ASL and total sugar loss. | |
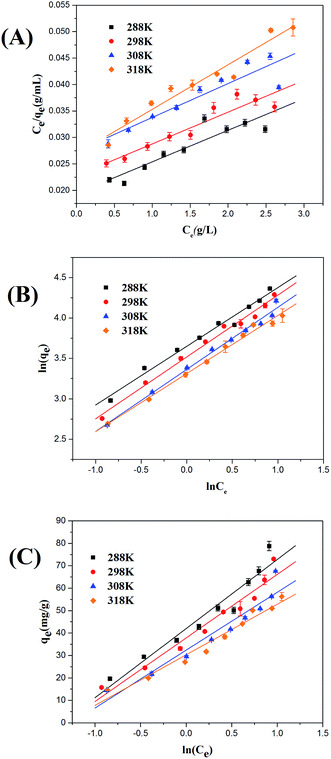 |
| | Fig. 5 Langmuir (A), Freundlich (B), and Temkin (C) adsorption isotherms for ASL on HQ-8 resin at different temperatures. | |
3.4. Adsorption isotherms
Adsorption isotherm plays a significant role in understanding how adsorbate interacts with adsorbents in the adsorption process. In this study, three commonly used isotherm models, namely Langmuir, Freundlich, and Temkin, were applied to analyze the equilibrium data of sorption of ASL onto HQ-8 resin at 288 to 318 K.
The Langmuir isotherm supposes that a monolayer adsorption occurs onto a special surface containing a finite number of binding sites of uniform strategies of adsorption with no interactions between the molecules adsorbed neither is transmigration on the surface of adsorbent.33 The linear Langmuir equation is given by:
| |
 | (5) |
Furthermore, the characteristic parameter of the Langmuir isotherm can be expressed by a dimensionless equilibrium parameter RL, also known as separation factor defined by Weber and Chakravorti:34
| |
 | (6) |
The value RL gives an indication of the type of the isotherm and the nature of the adsorption process. It indicates whether the adsorption nature is either unfavorable (RL > 1), linear (RL = 1), favorable (0 < RL < 1) or irreversible (RL = 0).
Different from Langmuir isotherm model, the Freundlich isotherm model is an empirical expression, which is based on the assumption that a multilayer adsorption takes place at the heterogeneous surface and considering the interactions between the adsorbed molecules.35 The logarithmic form of Freundlich isotherm model can be expressed as:
| |
 | (7) |
KF and
n are the Freundlich constants that can be related to adsorption capacity and adsorption strength, respectively. The
n value gives an indication of the favorability of the adsorption process. A value of 1/
n < 1 indicates a favorable adsorption, while 1/
n > 1 indicates a cooperative adsorption.
36
The Temkin model assumes that a linear decrease in the energy of adsorption with surface coverage and considering the interaction between adsorbate and adsorbent.37 The Temkin isotherm model is defined as:
| |
 | (8) |
The Langmuir, Freundlich and Temkin equations were used for curve fitting by Origin 8.5, and the parameters of the three equations were summarized and listed in Table 3. By comparing the correlation coefficient (R2), the Freundlich isotherm model gives the best fit for the adsorption of ASL onto HQ-8 resin. All 1/n values obtained from the Freundlich isotherm mode at different temperatures less than 1, indicating the adsorption was favorable. As seen from Table 3, the calculated RL values at all three temperatures were between 0 and 1, indicating the adsorption of ASL onto HQ-8 resin was favorable. However, the low correlation coefficient (R2) is an indication that it is not only a monolayer adsorption and the equilibrium isotherms cannot be described by Langmuir model. It can also be observed from Table 3 that the experimental data are not well fitted to the Temkin isotherm model. It can be explained that the interaction between adsorbate and adsorbent, and the adsorption process is simply a function of surface coverage.
Table 3 Isotherm parameters of each isotherm model for the sorption of ASL onto HQ-8 resin at different temperatures
| T (K) |
Langmuir isotherm |
Freundlich isotherm |
Temkin isotherm |
| qm (mg g−1) |
KL (L g−1) |
RL (g L−1) |
R2 |
1/n |
KF (mg g−1) (L g−1)1/n |
R2 |
KT (L g−1) |
bT (J mol−1) |
R2 |
| 288 |
167.5 |
0.31 |
0.44 |
0.8148 |
0.727 |
38.47 |
0.9820 |
3.91 |
77.76 |
0.9394 |
| 298 |
166.4 |
0.26 |
0.48 |
0.8796 |
0.766 |
33.72 |
0.9883 |
2.11 |
87.55 |
0.9462 |
| 308 |
153.0 |
0.23 |
0.51 |
0.8274 |
0.769 |
28.81 |
0.9895 |
2.21 |
99.32 |
0.9218 |
| 318 |
118.6 |
0.31 |
0.44 |
0.9415 |
0.719 |
27.46 |
0.9912 |
2.10 |
117.36 |
0.9618 |
3.5. Thermodynamic studies
The thermodynamic parameters ΔG° (standard free energy), ΔH° (enthalpy change) and ΔS° (entropy change) were calculated to determine the inherent energy change of adsorbent after adsorption and the mechanism involved in adsorption process. The thermodynamic parameters of ΔH° and ΔS° can be obtained respectively from the slope and intercept of ln![[thin space (1/6-em)]](https://www.rsc.org/images/entities/char_2009.gif) KC versus 1/T in Fig. 6(A), by using the linear Van's Hoff equation:38
KC versus 1/T in Fig. 6(A), by using the linear Van's Hoff equation:38| |
 | (9) |
| |
 | (10) |
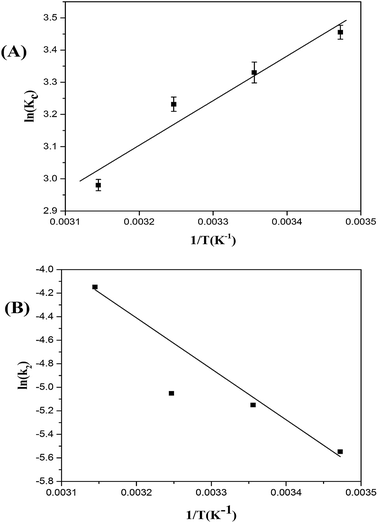 |
| | Fig. 6 Plot of ln![[thin space (1/6-em)]](https://www.rsc.org/images/entities/char_2009.gif) KC versus 1/T (A) plot of ln KC versus 1/T (A) plot of ln![[thin space (1/6-em)]](https://www.rsc.org/images/entities/char_2009.gif) k2 versus 1/T (Arrhenius plot) (B) for ASL adsorption on HQ-8 resin. k2 versus 1/T (Arrhenius plot) (B) for ASL adsorption on HQ-8 resin. | |
The ΔG° was calculated by the follow equation:
As is shown in Table 4, ΔG° was negative value, indicating that the adsorption process was spontaneous at all temperatures. Furthermore, the increase in ΔG° value with increasing temperature indicates that adsorption of ASL onto HQ-8 resin becomes favorable at a lower temperature. The negative value of ΔH° indicates that the sorption process of ASL on HQ-8 resin was exothermic in nature.25 The adsorption capacity of ASL onto HQ-8 resin decreased with increasing of temperature. In addition, the absolute values less than 20 kJ mol−1 implied that the adsorption was a physical process.39 The negative value of ΔS° showed that more ordered arrangement of ASL was shaped on HQ-8 resin surface after adsorption.
Table 4 Thermodynamic parameters for the sorption of ASL onto HQ-8 resin at different temperatures
| T (K) |
ΔG° (kJ mol−1) |
ΔH° (kJ mol−1) |
ΔS° (J mol−1 K−1) |
| 288 |
−8.34 |
−11.53 |
−11.08 |
| 298 |
−8.23 |
| 308 |
−8.13 |
| 318 |
−8.01 |
3.6. Kinetics studies
3.6.1 Effect of solution temperature on ASL adsorption. Effect of solution temperature on the ASL adsorption capacity is shown in Fig. 7(A), the adsorption capacity of ASL onto HQ-8 resin was found to decrease slightly with the increase in solution temperature from 288 K to 318 K, indicating the exothermic nature of the sorption reaction. This result consistent with the adsorption equilibrium results (Fig. 5(A–C)) and the adsorption thermodynamic analysis discussed above. The equilibrium time decreased from 50 to 10 min with increasing temperature from 288 to 318 K. These results probably due to the increase in diffusion rate of ASL with increasing temperature. Besides, the adsorption rate of ASL onto HQ-8 resin was fast in the first stages of the contact period at all experiment temperature, and then it became slower near the equilibrium. It may be attributed to the fact that as the contact time increased, the adsorption sites were obtained will became more difficult due to repulsive forces between the solute molecules on the solid and bulk phases.
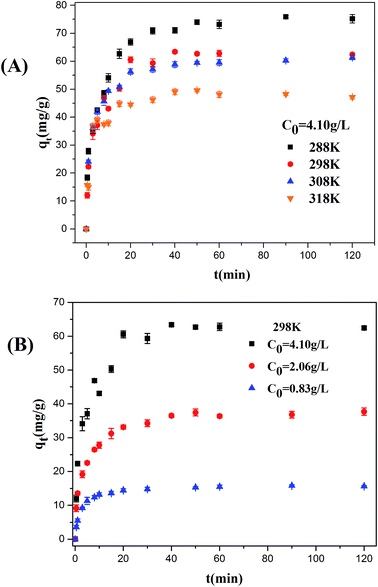 |
| | Fig. 7 The effect of contact time on the sorption of ASL onto HQ-8 resin at various temperatures (A); different initial concentrations of ASL (B). | |
3.6.2 Effect of initial concentration on ASL adsorption. The effect of initial ASL concentration on the adsorption time and adsorption rate was investigated. As shown in Fig. 7(B), the sorption capacity of at equilibrium increase from 15 to 64 mg g−1 with initial concentration from 0.83 to 4.10 g L−1. This phenomenon may be explained by the saturation of accessible-adsorbent sites of adsorbents. The equilibrium time decreased from 40 to 20 min when increasing ASL initial concentration from 0.83 to 4.10 g L−1 at 298 K. This was attributed to the fact that the mass transfer driving force increased with increasing initial concentration, which caused faster equilibrium.
3.6.3 Adsorption kinetics. The adsorption kinetics is useful to determine the rate of the adsorption and examine the controlling mechanism of the adsorption process. In this work, the Lagergren's pseudo first-order and pseudo second-order models were adopted to investigate the adsorption kinetic behavior of ASL onto HQ-8 resin.The equation for Lagergren's pseudo-first order kinetics is presented as follows:40
| |
ln(qe − qt) = ln![[thin space (1/6-em)]](https://www.rsc.org/images/entities/char_2009.gif) qe − k1t qe − k1t
| (12) |
The values of k1 and adsorption capacity qe are computed from the plots of ln(qe − qt) versus t (Fig. 8(A) and 9(A)) and showed in Table 5. Comparing the experimental obtained equilibrium adsorption (qe,exp) with the calculated results (qe,cal), it is obvious that there is no agreement between the values. The correlation coefficients (R2) for the first model show poor linearity. Therefore, the adsorption deviates from the Lagergren's pseudo-first model.
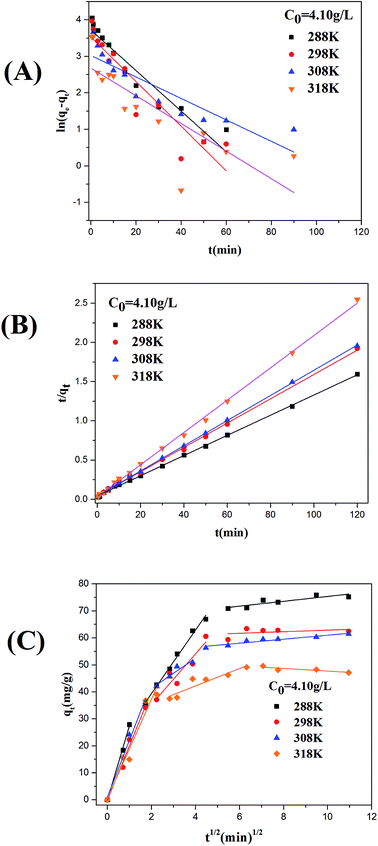 |
| | Fig. 8 Pseudo-first-order (A), pseudo-second-order (B), and intraparticle diffusion (C) kinetic models for batch adsorption of ASL by HQ-8 resin at different temperatures. | |
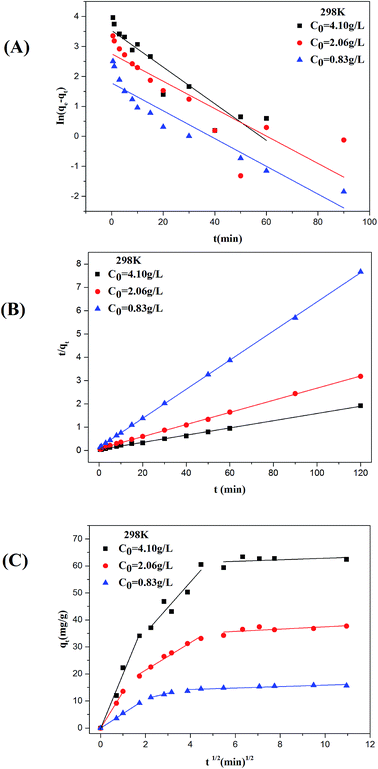 |
| | Fig. 9 Pseudo-first-order (A), pseudo-second-order (B), and intraparticle diffusion (C) kinetic models for batch sorption of ASL by HQ-8 resin at different initial concentrations. | |
Table 5 Kinetic constant parameters obtained for acid soluble lignin on HQ-8 resin
| T (K) |
C0 (g L−1) |
qe,exp (mg g−1) |
Pseudo-first order |
Pseudo-second order |
Intraparticle diffusion model |
| k1 (min−1) |
qe,cal (mg g−1) |
R2 |
k2 (g mg−1 min−1) |
qe,cal (mg g−1) |
R2 |
ki (mg g−1 min−1) |
C (mg g−1) |
R2 |
| 288 |
4.10 |
75.94 |
0.0555 |
41.20 |
0.919 |
0.0039 |
77.76 |
0.9992 |
11.8 |
15.75 |
0.9887 |
| 298 |
0.83 |
15.81 |
0.0463 |
5.92 |
0.893 |
0.0291 |
16.01 |
0.9999 |
2.0 |
6.73 |
0.9870 |
| 298 |
2.06 |
37.71 |
0.0457 |
15.67 |
0.729 |
0.0088 |
38.46 |
0.9994 |
5.1 |
11.17 |
0.9769 |
| 298 |
4.10 |
64.61 |
0.0611 |
34.17 |
0.856 |
0.0058 |
64.56 |
0.9984 |
9.4 |
16.41 |
0.8473 |
| 308 |
4.10 |
62.21 |
0.0294 |
20.51 |
0.788 |
0.0064 |
62.34 |
0.9998 |
5.6 |
30.08 |
0.8837 |
| 318 |
4.10 |
49.02 |
0.0379 |
14.52 |
0.635 |
0.0158 |
48.52 |
0.9987 |
3.2 |
29.26 |
0.8374 |
The pseudo-second-order kinetic model is expressed as follows:41
| |
 | (13) |
k2 is the pseudo-first-order rate constant for the sorption is obtained by a plot of
t/
qt against
t (
Fig. 8(A) and
9(A)). It can be observed from
Table 5 that the values of the correlation coefficients (
R2 > 0.99) for all the operating condition indicate that the adsorption process follows pseudo-second order kinetic model. Meanwhile, this conclusion is also supported by the comparisons between the experimental results (
qe,exp) and model predictions (
qe,cal).
To better understand the adsorption mechanism of ASL onto HQ-8 resin, the rate limiting step was estimated by the Weber and Morris intraparticle diffusion model.42,43 The linear form of this equation is:
Adsorption kinetics may be controlled by the rate limiting step of the process and the adsorption mechanism. Generally, if the plot of qt versus t0.5 yields a straight line, the adsorption process is controlled by intra-particle diffusion; and if the data exhibit multi-linear plot, the adsorption process is influenced by two or more stages.44 Fig. 8(C) and 9(C) show that the plot of qt versus t0.5 is multi-linear. Clearly, there are three linear portions to explain the adsorption stages, the first stage is attributed to the instantaneous adsorption or external surface adsorption, the second to intraparticle diffusion and the third portion referred to the final equilibrium stage for which the intraparticle diffusion started to slow down due to the extremely low adsorbate concentration left in the solution.45 Fig. 8(C) and 9(C) also showed the linear lines of the second and the third stages did not pass through the origin, indicating that intraparticle diffusion is not the only rate-limiting.46,47 The intraparticle diffusion constant values are shown in Table 5.
3.7. Adsorption activation energy
The activation energy of adsorption, Ea (kJ mol−1), is calculated from the second order rate constant (k2) obtained from the pseudo-second order kinetic model using the Arrhenius equation:| |
 | (15) |
The apparent activation energy Ea gives an indication of the type of the adsorption process, physical or chemical. The Arrhenius plot of ln![[thin space (1/6-em)]](https://www.rsc.org/images/entities/char_2009.gif) k2 versus 1/T for the sorption of ASL on the resin is presented in Fig. 6(B). The calculated activation energy Ea was 35.99 kJ mol−1 (ranging between 5 and 40 kJ mol−1), revealing physical nature of the adsorption process.48,49 This finding was consistent with the thermodynamic results.
k2 versus 1/T for the sorption of ASL on the resin is presented in Fig. 6(B). The calculated activation energy Ea was 35.99 kJ mol−1 (ranging between 5 and 40 kJ mol−1), revealing physical nature of the adsorption process.48,49 This finding was consistent with the thermodynamic results.
3.8. Reusability
The regeneration and reuse of the resin is significance in term of economic cost. It was found that the HQ-8 resin could be well desorbed by 95% ethanol at room temperature. Fig. 10 shows the ASL adsorption capacity in five adsorption–desorption cycles. It can be seen that the resin exhibited good reusability with almost stable efficiency, indicating that HQ-8 resin is a promising valuable adsorbent to remove ASL from the lignocellulose hydrolysate.
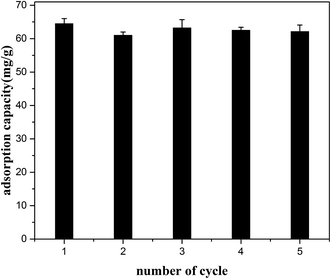 |
| | Fig. 10 Effect of the regeneration cycles on the adsorption capacity of ASL on HQ-8 resin at 298 K. | |
4. Conclusion
In the present investigation, a macro/mesoporous resin, HQ-8, was evaluated as a novel adsorbent with high adsorption capacity for removal of ASL. The study of influence of solution pH indicated that the HQ-8 resin exhibited better adsorption performance under acidic conditions. The maximum adsorption amount of ASL onto HQ-8 resin was achieved to 64.61 mg g−1 at a pH of 1 at 298 K. The resin dose inversely affected the adsorption capacity of ASL onto HQ-8 resin, whereas the adsorption capacity increased with increasing initial ASL concentration. Within the studied range of ASL concentrations, the adsorption equilibrium was found to follow the Freundlich isotherm model well, with R2 > 0.988. The adsorption of ASL onto HQ-8 resin reached equilibrium in a short contact time (within 50 min), resulting in fast and efficient ASL removal, which would be beneficial for practical purposes. The regression results revealed that the rate of the ASL adsorption process was found to conform accurately to the pseudo-second-order kinetic model. The efficiency of HQ-8 resin for the spontaneous and exothermic adsorption of ASL is attributed to the hydrophobic interaction between cross-linked benzene ring of HQ-8 resin and the aromatic ring of ASL. In addition, the Arrhenius activation energy of ASL adsorption onto HQ-8 resin is 35.99 kJ mol−1, suggested physical nature of the adsorption process. Thus, the present adsorption study has provided a new, efficient, and stable adsorbent with potential for practical application in the detoxification of lignocellulose hydrolysate.
List of symbols
| A | Arrhenius constant |
| bT | Temkin constant related to heat of adsorption |
| C | Intraparticle diffusion model constant (mg g−1) |
| C0 | Initial concentration of ASL in hydrolysate (g L−1) |
| Ce | Equilibrium concentration of ASL in hydrolysate (g L−1) |
| Ct | Concentration of ASL in solution at contact time (g L−1) |
| D | Distribution coefficients (mL g−1) |
| Ea | Apparent activation energy (kJ mol−1) |
| k1 | Pseudo-first-order rate constant (min−1) |
| k2 | Second order rate constant in (mg g−1 min−1) |
| ki | Intraparticle diffusion rate (mg g−1 min−1/2) |
| KC | Thermodynamic equilibrium constant |
| KF | Freundlich adsorption isotherm constant (mg g−1) (L g−1)1/n |
| KL | Langmuir constant (L g−1) |
| KT | Temkin isotherm constant (L g−1) |
| M | Mass of the dry resin (g) |
| N | Freundlich adsorption isotherm constant |
| qe | Equilibrium adsorption capacity (mg g−1) |
| qe,cal | Calculate adsorption capacity (mg g−1) |
| qe,exp | Experimental adsorption capacity (mg g−1) |
| qm | Maximum saturated adsorption capacity (mg g−1) |
| qt | Adsorption capacity of ASL at contact time (mg g−1) |
| R | Gas constant (8.314 J mol−1 K−1) |
| RL | Langmuir equilibrium parameter |
| T | Contact time (min) |
| T | Solution temperature (K) |
| V | Volume of solution (L) |
| V0 | Initial volume of solution (L) |
| Vi | Sampling volume (L) |
| ΔG° | Gibbs free energy change (kJ mol−1) |
| ΔH° | Enthalpy change (kJ mol−1) |
| ΔS° | Entropy change (J mol−1 K−1) |
| β | Selectivity coefficient |
Acknowledgements
The authors are grateful to the financial support from the Project of National Natural Science Foundation of China (51508547), Pearl River S&T Nova Program of Guangzhou (201710010096), the Science and Technology Planning Project of Guangdong Province, China (2016A010104009), the Project of Huaian Science and Technology (HAS201623), the Foundation of Director of Guangzhou Institute of Energy Conversion, Chinese Academy of Sciences (y407r41001) and the Project of Guangdong Provincial Key Laboratory of New and Renewable Energy Research and Development (Y709jh1001).
References
- X. Tang, Y. Sun, X. Zeng, W. Hao, L. Lin and S. Liu, Energy Fuels, 2014, 28, 4251–4255 CrossRef CAS.
- D. T. N. N. Nguyen, M. L. Lameloise, W. Guiga, R. Lewandowski, M. Bouix and C. Fargues, J. Membr. Sci., 2016, 512, 111–121 CrossRef CAS.
- C. C. Geddes, I. U. Nieves and L. O. Ingram, Curr. Opin. Biotechnol., 2011, 22, 312–319 CrossRef CAS PubMed.
- G. W. Huber, S. Iborra and A. Corma, Chem. Rev., 2006, 106, 4044–4098 CrossRef CAS PubMed.
- X. Lin, Q. Huang, G. Qi, S. Shi, L. Xiong, C. Huang, X. Chen, H. Li and X. Chen, Sep. Purif. Technol., 2017, 174, 222–231 CrossRef CAS.
- L. H. Deng, Y. H. Wang, Y. Zhang and R. Y. Ma, J. Food Biochem., 2007, 31, 195–205 CrossRef CAS.
- M. Balat, Energy Convers. Manage., 2011, 52, 858–875 CrossRef CAS.
- P. Lenihan, A. Orozco, E. O'neill, M. Ahmad, D. Rooney and G. Walker, Chem. Eng. J., 2010, 156, 395–403 CrossRef CAS.
- S. Larsson, E. Palmqvist, B. Hahn-Hägerdal, C. Tengborg, K. Stenberg, G. Zacchi and N.-O. Nilvebrant, Enzyme Microb. Technol., 1999, 24, 151–159 CrossRef CAS.
- S. I. Mussatto and I. C. Roberto, Bioresour. Technol., 2004, 93, 1–10 CrossRef CAS PubMed.
- L. J. Jonsson, B. Alriksson and N. O. Nilvebrant, Biotechnol. Biofuels, 2013, 6, 6–16 CrossRef PubMed.
- T. Ezeji, N. Qureshi and H. P. Blaschek, Biotechnol. Bioeng., 2007, 97, 1460–1469 CrossRef CAS PubMed.
- E. Palmqvist and B. Hahn-Hägerdal, Bioresour. Technol., 2000, 74, 25–33 CrossRef CAS.
- Y. Xia, H. H. P. Fang and T. Zhang, RSC Adv., 2013, 3, 15528–15542 RSC.
- K. S. Yadav, S. Naseeruddin, G. S. Prashanthi, L. Sateesh and L. V. Rao, Bioresour. Technol., 2011, 102, 6473–6478 CrossRef PubMed.
- R. Purwadi, C. Niklasson and M. J. Taherzadeh, J. Biotechnol., 2004, 114, 187–198 CrossRef CAS PubMed.
- W. Zhang, X. Zhang, L. Bao and G. Wei, Chem. Biochem. Eng. Q., 2012, 26, 127–136 CAS.
- K. M. Lee, K. Min, O. Choi, K.-Y. Kim, H. M. Woo, Y. Kim, S. O. Han and Y. Um, Bioresour. Technol., 2015, 187, 228–234 CrossRef CAS PubMed.
- T. J. Schwartz and M. Lawoko, BioResources, 2010, 5, 2337–2347 CAS.
- Z. Wang, J. Jiang, X. Wang, Y. Fu, Z. Li, F. Zhang and M. Qin, Bioresour. Technol., 2014, 174, 198–203 CrossRef CAS PubMed.
- H. Miyafuji, H. Danner, M. Neureiter, C. Thomasser, J. Bvochora, O. Szolar and R. Braun, Enzyme Microb. Technol., 2003, 32, 396–400 CrossRef CAS.
- C. Detoni, C. H. Gierlich, M. Rose and R. Palkovits, ACS Sustainable Chem. Eng., 2014, 2, 2407–2415 CrossRef CAS.
- X. Lin, L. Xiong, C. Huang, X. Yang, H. Guo, X. Chen and X. Chen, Desalin. Water Treat., 2016, 57, 366–381 CAS.
- X. Lin, J. Wu, J. Fan, W. Qian, X. Zhou, C. Qian, X. Jin, L. Wang, J. Bai and H. Ying, J. Chem. Technol. Biotechnol., 2012, 87, 924–931 CrossRef CAS.
- X. Lin, Q. Huang, G. Qi, L. Xiong, C. Huang, X. Chen, H. Li and X. Chen, Chemosphere, 2017, 171, 231–239 CrossRef CAS PubMed.
- A. Sluiter, B. Hames, R. Ruiz, C. Scarlata, J. Sluiter, D. Templeton and D. Crocker, Laboratory analytical procedure, 2008, vol. 1617, http://www.nrel.gov/biomass/analyticalprocedures.html Search PubMed.
- X. Lin, L. Xiong, G. Qi, S. Shi, C. Huang, X. Chen and X. Chen, ACS Sustainable Chem. Eng., 2015, 3, 702–709 CrossRef CAS.
- X. Yang, L. Wu, L. Ma, X. Li, T. Wang and S. Liao, Catal. Commun., 2015, 59, 184–188 CrossRef CAS.
- S. Yasuda, K. Fukushima and A. Kakehi, J. Wood Sci., 2001, 47, 69–72 CrossRef CAS.
- J. H. Huang, J. Hazard. Mater., 2009, 168, 1028–1034 CrossRef CAS PubMed.
- D. K. Singh and S. Mishra, Anal. Chim. Acta, 2009, 644, 42–47 CrossRef CAS PubMed.
- M. Monier, N. H. Elsayed and D. A. Abdel-Latif, Polym. Int., 2015, 64, 1465–1474 CrossRef CAS.
- I. Langmuir, J. Am. Chem. Soc., 1916, 38, 2221–2295 CrossRef CAS.
- T. W. Weber and R. K. Chakravorti, AIChE J., 1974, 20, 228–238 CrossRef CAS.
- H. Freundlich, J. Phys. Chem., 1906, 57, 1100–1107 Search PubMed.
- I. Tan, A. Ahmad and B. Hameed, J. Hazard. Mater., 2009, 164, 473–482 CrossRef CAS PubMed.
- K. K. Choy, G. McKay and J. F. Porter, Resour., Conserv. Recycl., 1999, 27, 57–71 CrossRef.
- V. Gupta, P. Singh and N. Rahman, J. Colloid Interface Sci., 2004, 275, 398–402 CrossRef CAS PubMed.
- X. Zhou, J. Fan, N. Li, W. Qian, X. Lin, J. Wu, J. Xiong, J. Bai and H. Ying, Ind. Eng. Chem. Res., 2011, 50, 9270–9279 CrossRef CAS.
- S. Lagergren, K. Sven. Vetenskapsakad. Handl., 1898, 24, 1–39 Search PubMed.
- Y.-S. Ho and G. McKay, Process Saf. Environ. Prot., 1998, 76, 183–191 CrossRef CAS.
- G. Annadurai, R.-S. Juang and D.-J. Lee, J. Hazard. Mater., 2002, 92, 263–274 CrossRef CAS PubMed.
- S. Srivastava, R. Tyagi and N. Pant, Water Res., 1989, 23, 1161–1165 CrossRef CAS.
- C. Long, A. Li, H. Wu and Q. Zhang, Colloids Surf., A, 2009, 333, 150–155 CrossRef CAS.
- H. Zaghouane-Boudiaf and M. Boutahala, Chem. Eng. J., 2011, 170, 120–126 CrossRef CAS.
- F.-C. Wu, R.-L. Tseng and R.-S. Juang, Environ. Technol., 2001, 22, 205–213 CrossRef CAS PubMed.
- I. Langmuir, J. Am. Chem. Soc., 1918, 40, 1361–1403 CrossRef CAS.
- A. Ozcan, A. Ozcan and O. Gok, Hazardous Materials and Wastewater—Treatment, Removal and Analysis, Nova Science Publishers, New York, 2007 Search PubMed.
- E. Unuabonah, K. Adebowale and B. Olu-Owolabi, J. Hazard. Mater., 2007, 144, 386–395 CrossRef CAS PubMed.
|
| This journal is © The Royal Society of Chemistry 2017 |
Click here to see how this site uses Cookies. View our privacy policy here.  Open Access Article
 *abc
*abc
![[thin space (1/6-em)]](https://www.rsc.org/images/entities/char_2009.gif) :
:![[thin space (1/6-em)]](https://www.rsc.org/images/entities/char_2009.gif) mDVB = 1
mDVB = 1![[thin space (1/6-em)]](https://www.rsc.org/images/entities/char_2009.gif) :
:![[thin space (1/6-em)]](https://www.rsc.org/images/entities/char_2009.gif) 1), and 40 g pore-forming agent (mtoluene
1), and 40 g pore-forming agent (mtoluene![[thin space (1/6-em)]](https://www.rsc.org/images/entities/char_2009.gif) :
:![[thin space (1/6-em)]](https://www.rsc.org/images/entities/char_2009.gif) mliquid paraffin = 1
mliquid paraffin = 1![[thin space (1/6-em)]](https://www.rsc.org/images/entities/char_2009.gif) :
:![[thin space (1/6-em)]](https://www.rsc.org/images/entities/char_2009.gif) 1) was added into the flask, and then nitrogen was bubbled through the mixture for 10 min. The mixture was stirred to form a suspension of oil beads with a suitable size in an aqueous solution and then gradually heated to 353 K within 3 h. The reaction was maintained stirred at 353 K for approximately 5 h. After copolymerization, the copolymer beads were filtered out and washed with a large amount of hot water three times, then packed in a fixed-bed column and eluted with anhydrous ethanol until the eluant is transparent when mixed with water. The resins were extracted with ethanol for 24 h in a Soxhlet to remove pore-forming agent and residual monomers, and then were washed with de-ionized water and anhydrous ethanol three times, respectively, to ensure complete removal of impurities. Finally, the resins were dried under vacuum at 333 K for 10 h.
1) was added into the flask, and then nitrogen was bubbled through the mixture for 10 min. The mixture was stirred to form a suspension of oil beads with a suitable size in an aqueous solution and then gradually heated to 353 K within 3 h. The reaction was maintained stirred at 353 K for approximately 5 h. After copolymerization, the copolymer beads were filtered out and washed with a large amount of hot water three times, then packed in a fixed-bed column and eluted with anhydrous ethanol until the eluant is transparent when mixed with water. The resins were extracted with ethanol for 24 h in a Soxhlet to remove pore-forming agent and residual monomers, and then were washed with de-ionized water and anhydrous ethanol three times, respectively, to ensure complete removal of impurities. Finally, the resins were dried under vacuum at 333 K for 10 h.

![[double bond, length as m-dash]](https://www.rsc.org/images/entities/char_e001.gif) C group is identified by the presence of peaks at 1604 cm−1, 1498 cm−1 and 1446 cm−1. The IR spectrum of the HQ-8 resin after loading with ASL (Fig. 1(b)) displays a new strong band at 3442 cm−1 is attributed to the presence of –OH due to the fact that the ASL in the hydrolysates largely as phenolic compounds of low molar mass.
C group is identified by the presence of peaks at 1604 cm−1, 1498 cm−1 and 1446 cm−1. The IR spectrum of the HQ-8 resin after loading with ASL (Fig. 1(b)) displays a new strong band at 3442 cm−1 is attributed to the presence of –OH due to the fact that the ASL in the hydrolysates largely as phenolic compounds of low molar mass.


![[thin space (1/6-em)]](https://www.rsc.org/images/entities/char_2009.gif) KC versus 1/T in Fig. 6(A), by using the linear Van's Hoff equation:38
KC versus 1/T in Fig. 6(A), by using the linear Van's Hoff equation:38


![[thin space (1/6-em)]](https://www.rsc.org/images/entities/char_2009.gif) KC versus 1/T (A) plot of ln
KC versus 1/T (A) plot of ln![[thin space (1/6-em)]](https://www.rsc.org/images/entities/char_2009.gif) k2 versus 1/T (Arrhenius plot) (B) for ASL adsorption on HQ-8 resin.
k2 versus 1/T (Arrhenius plot) (B) for ASL adsorption on HQ-8 resin.![[thin space (1/6-em)]](https://www.rsc.org/images/entities/char_2009.gif) qe − k1t
qe − k1t


![[thin space (1/6-em)]](https://www.rsc.org/images/entities/char_2009.gif) k2 versus 1/T for the sorption of ASL on the resin is presented in Fig. 6(B). The calculated activation energy Ea was 35.99 kJ mol−1 (ranging between 5 and 40 kJ mol−1), revealing physical nature of the adsorption process.48,49 This finding was consistent with the thermodynamic results.
k2 versus 1/T for the sorption of ASL on the resin is presented in Fig. 6(B). The calculated activation energy Ea was 35.99 kJ mol−1 (ranging between 5 and 40 kJ mol−1), revealing physical nature of the adsorption process.48,49 This finding was consistent with the thermodynamic results.


