
 Open Access Article
 This Open Access Article is licensed under a Creative Commons Attribution-Non Commercial 3.0 Unported Licence
Oxidative stress-induced apoptosis of osteoblastic MC3T3-E1 cells by hydroxyapatite nanoparticles through lysosomal and mitochondrial pathways
Yi Jinab,
Xiaolong Liua,
Huifang Liua,
Shizhu Chena,
Chunyue Gaoa,
Kun Gea,
Cuimiao Zhanga and
Jinchao Zhang *a
*a
aKey Laboratory of Chemical Biology of Hebei Province, Key Laboratory of Medicinal Chemistry and Molecular Diagnosis of the Ministry of Education, College of Chemistry & Environmental Science, Hebei University, Baoding 071002, P. R. China. E-mail: jczhang6970@163.com; Tel: +86-312-5079627
bCollege of Basic Medical Science, Hebei University, Baoding 071000, P. R. China
First published on 24th February 2017
Abstract
Hydroxyapatite nanoparticles (HAPs) are increasingly utilized in biomedical fields including dental composites, bone tissue engineering and orthopedic implants due to its similar properties to bone minerals. With their widespread use, toxicological effects of HAPs have aroused people's close attention. However, the potential toxic effects of HAPs on bone cells are poorly understood. In our present work, the HAPs with aspect ratios of 4 were synthesized by a hydrothermal method and characterized by transmission electron microscopy (TEM), X-ray diffractometry (XRD), dynamic light scattering (DLS) and photoluminescence (PL). The cytotoxicity of HAPs on MC3T3-E1 cells and the relevant mechanisms were further studied. The results proved that HAPs could be uptaken into MC3T3-E1 cells via macropinocytosis-mediated endocytosis pathway, and mainly localized in lysosome. HAPs inhibited the cells proliferation in dose- and time-dependent manners. Results from annexin V-FITC/PI apoptosis assay showed that HAPs induced cell apoptosis significantly, and the mechanism of apoptosis was related to oxidative stress. HAPs induced ROS generation and antioxidant enzymes superoxide dismutase (SOD) and glutathion peroxidase (GSH-Px) decrease, which not only induced a lysosome-dependent damage pathway via lysosomal membrane permeabilization (LMP) and increased the release of cathepsins B, but also a mitochondria-dependent damage pathway via counter regulating expressions of bax and bcl-2, decrease of mitochondrial membrane potential (MMP), activation of caspase3. In addition, the ROS also caused DNA damage. In summary, HAPs induces apoptosis through oxidative stress-induced lysosomal and mitochondrial pathways. Our study will provide some valuable data for biomedical applications of HAPs in the future.
Introduction
Hydroxyapatite (HA, Ca5(PO4)3OH), as an important inorganic constituent of biological hard tissues, has been considered to play a critical role in various bone tissue regeneration and teeth after trauma.1–3 With the development of nanotechnology, hydroxyapatite nanoparticles (HAPs) are widely used in biomedical fields due to their improved biocompatibility, non-immunogenicity, high osteoinductivity and good bioactivity.4–6 It has been proved that HAPs may promote osteoblast adhesion, proliferation, alkaline phosphatase synthesis and cause more rapid repair of hard tissue damage. During the past 20 years, there is growing interest in the application of HAPs in bone tissue engineering, such as filling bone defects, coating materials, orthopedic implants and so on. For example, Bhuiyan et al. created a complex collagen and HAP-based biopolymer for a bone graft substitute.7 Curtin et al. developed non-aggregating collagen HAP scaffolds which were used as a gene delivery platform for stem cell-mediated bone formation.8 The above results indicated that HAPs could serve as an ideal candidate in the bone tissue engineering field. However, with increased biological applications of HAPs, the concerns about their potential toxic effects on humans have also increased.In recent years, studies about biocompatibility of HAPs were successively reported. For example, Remya et al. evaluated the molecular toxicity of 50 nm HAPs using bone marrow mesenchymal stem (BMSCs), and concluded that the in-house synthesized HAPs were non-toxic/safe to BMSCs at the molecular level.9 We previously reported that defect-related luminescent hydroxyapatite could enhance osteogenic differentiation of BMSCs via an ATP-induced cAMP/PKA pathway.10 Doostmohammadi et al. confirmed that bone-derived HA were compatible with BMSCs and HAPs could be used for bone tissue engineering.11 Sun et al. used primary osteoblastic cells as model to detect the biocompatibility of different-sized HAPs, and found that larger HAPs had a good biocompatibility with primary osteoblastic cells while smaller-sized HAPs can both promote osteoclast activity and restrain osteoblasts activity, implying that size-dependent cytotoxicity of HAPs.12 Chen et al. verified that the surface charge of HAPs play an important role in cellular uptake, cell viability and proliferation of osteoblast MC3T3-E1 cells.13 Wang et al. studied the toxicity effect of HAPs on the major organs of SD rats and MC3T3-E1 cells in vitro, displayed that HAPs could induce cells apoptosis in liver and renal tissues, and inhibit the proliferation of MC3T3-E1 cells.14 However, the potential toxic effects of HAPs on bone cells are not well-understood.
MC3T3-E1 is an osteoblast precursor cell line derived from mouse calvaria.15 A number of derivatives of this strain have been isolated to select for varying degrees of osteogenic capability, and widely used as model systems in bone tissue engineering. The purpose of this study was to assess whether and how HAPs can inhibit the proliferation and induce the apoptosis of MC3T3-E1 cells, hence providing an interesting view of the biological application of HAPs in future.
Materials and methods
Materials
MC3T3-E1 cells were purchased from the cell bank of Peking Union Medical College (Beijing, China). Dulbecco's modified eagle medium (DMEM) and fetal bovine serum (FBS) were purchased from Gibco (Grand Island, NY, USA). 3-[4,5-Dimethylthiazole-2-yl]-2,5-diphenyl tetrazolium bromide (MTT), trypsin, benzylpenicillin, streptomycin, rhodamine 123 (RH123), 2′,7′-dichloroflourescein diacetate (DCFH-DA), ethidium bromide (EB), chlorpromazine hydrochloride, nystatin, wortmannin, acridine orange (AO) were purchased from Sigma (St. Louis, MO, USA). Cathepsin B activity kit, annexin V-fluorescein isothiocyanate (FITC)/PI apoptosis kit, Revertaid first strand cDNA synthesis kit, Lyso-Tracker Red and Mito-Tracker Green were obtained from Thermo Scientific (Rockford, USA). Superoxide dismutase (SOD) and glutathion peroxidase (GSH-Px) detection kits were purchased from Nanjing Jiancheng Bioengineering Institute (Jiangsu, CHN). Ultra SYBR Mixture was obtained from CWBIOTECH (Beijing, CHN).Synthesis and characterization of HAPs
The HAPs were synthesized using a facile hydrothermal process according to literature with some modifications.16 Calcium nitrate [Ca(NO3)2·4H2O] (2 mmol), hexadecyltrimethylammonium bromide (CTAB) (0.2 g), and ammonia solution (5 mL) to adjust the pH value 9.0 were dissolved in deionized water (20 mL). Trisodium citrate (2 mmol) and (NH4)2HPO4 (1.2 mmol) were added to 10 mL H2O. Then, the above solutions were mixed, stirred for 20 min, transferred into a Teflon bottle, sealed, and maintained at 180 °C for 24 h. The precipitates were separated, washed by deionized water and ethanol, and dried in air at 75 °C for 12 h to obtain HAPs.The HAPs were characterized by powder X-ray diffraction (XRD) using D8 Advance diffractometer (Bruker, Germany). The morphology of the samples was observed by JSM-7500F cold field transmission electron microscope (TEM) (Tecnai G2, S-Twin, FEI). The photoluminescence (PL) measurement was performed on F-7000 spectrophotometer. The dynamic light scattering (DLS) was obtained on Delsa Nana C grainsize analyzer (Beckman, USA). All measurements were performed at room temperature.
Cytotoxicity
Cytotoxicity was determined by MTT assay as previously described.17 The MC3T3-E1 cells (2 × 10⁴ cells per well) were seeded in 96-well plates, HAPs was added at final concentrations of 10, 20, 30, and 40 μg mL−1. Cells without nanoparticles treatment were used as control, wells without cells were used as blanks. Cells were cultured for 24, 48, and 72 h, 10 μL MTT (5.0 mg mL−1) was added, and incubated at 37 °C for 4 h. Then the MTT medium was discarded and 100 μL of DMSO was added. The optical density (OD) value was measured by a microplate spectrophotometer (MD VersaMax, USA) at 570 nm. The viability (%) was calculated using the following formula: (ODtreated − ODblank)/(ODcontrol − ODblank) × 100.Annexin V-FITC/PI apoptosis assay
The apoptosis of cells was detected using annexin V-FITC/PI double labeling method.18 Briefly, cells (3 × 10⁵ cells per well) were seeded in 6-well plates overnight. After the treatment of HAPs (40 μg mL−1) for 24 h, cells were resuspended and mixed with annexin V-FITC and PI for 15 min. The apoptosis of cells was analyzed by flow cytometer (FACSCalibur™, Becton Dickinson).Cellular uptake and endocytosis mechanism
Cells (3 × 10⁵ cells per well) were plated in 6-well plates. After treatment by HAPs suspension (40 μg mL−1) for 2, 4, 8, and 12 h. The uptake of HAPs into MC3T3-E1 was analyzed by flow cytometer.For cell endocytosis mechanism,19 cells (3 × 10⁵ cells per well) were pre-treated with different inhibitors of endocytosis (3.5 μM chlorpromazine hydrochloride, 1 mM nystatin or 400 nM wortmannin) for 30 min at 37 °C. In addition, the cells were cultured with HAPs at 4 and 37 °C as negative and positive controls, respectively. The uptake of HAPs was analyzed using flow cytometer.
Intracellular localization of HAPs
The intracellular localization of HAPs in MC3T3-E1 cells was traced with the Lyso-Tracker Red or Mito-Tracker Green, respectively.20 After cells were treated with HAPs (40 μg mL−1) for 4 h, Lyso-Tracker Red or Mito-Tracker Green was added. The images of cells were observed with a laser confocal scanning microscope (Olympus, IX81, Japan).Intracellular ROS measurement assay
Intracellular ROS level was detected as previous literature.21 Cells (6 × 10⁵ cells per well) were seeded in 6-well plates. After treatment of HAPs for 24 h, the cells were stained with 5 μM DCFH-DA and incubated at 37 °C for 30 min. The fluorescence of oxidized DCF was detected by flow cytometer. In addition, the ROS level was also observed by morphology. After the same treatment as describe above, the cells' images were captured using a fluorescent microscopy (Olympus, IX53, Japan).SOD and GSH-Px measurement assays
Cells were seeded in 6-well plates at 6 × 10⁵ cells per well. Following treatment by different concentrations of HAPs for 24 h, the SOD, GSH-Px activities and protein content were measured by using SOD, GSH-Px and a micro-Bradford assay kits according to the manufacturer's instruction.Lysosomal membrane permeabilization (LMP) and cathepsin B activity assay
The LMP was measured by using AO relocation assay.22 Briefly, cells (6 × 10⁵ cells per well) were seeded in 6-well culture plates and incubated in the presence or absence of HAPs (40 μg mL−1) for 24 h. Subsequently the cells were trypsinized and resuspended in PBS with 5 μg mL−1 AO for 15 min at room temperature, then the red fluorescence was analyzed by flow cytometer.For cathepsin B activity assay, cells (6 × 10⁵ cells per well) were seeded in 48-well culture plates and incubated with HAPs (40 μg mL−1) for 24 h. The activity of cathepsin B was measured according to the manufacturer's instruction.
Mitochondrial membrane potential (MMP) measurement assay
The MMP was determined by the rhodamine 123 (RH123) staining.23 Cells (6 × 10⁵ cells per well) were seeded into 6-well plates and treated with 10, 20, 30, and 40 μg mL−1 of HAPs for 24 h. Then, cells were stained with 10 mM RH123. The fluorescence intensity of RH123 was analyzed by a flow cytometer.Caspase3 and bax/bcl-2 gene expression
After cells were treated with HAPs (40 μg mL−1) for 24 h, total RNA was extracted using Trizol reagent. Then, 2 μg of RNA was performed to reverse transcriptase reaction using the RevertAid first strand cDNA synthesis kit. The PCR profile began with 10 min at 95 °C, followed by 40 cycles of 15 s at 95 °C and 1 min at 60 °C, and later followed by the melting curve test. The primer sequences are listed in Table 1.| Gene | Forward primer (5′-3′) | Reverse primer (5′-3′) |
|---|---|---|
| bax | CAAAGTAGAAGAGGGCAACCAC | AGGATGCGTCCAAGAA |
| bcl-2 | AATCCGTAGGAATCCCAACC | CGAGAAGAAGAGAGAATCACAGG |
| Caspase3 | GCAAGCCATCTCCTCATCAG | TGACTGGAAAGCCGAAACTC |
| GAPDH | GACTTGAACAGCAACTCCCAC | TCCACCACCCTGTTGCTGTA |
DNA damage assay
The DNA damage assay was performed according to literature.24 Cells (6 × 10⁶ cells per well) were incubated in the presence or absence of HAPs (40 μg mL−1) for 24 h. The cellular DNA damage was analyzed by a single cell gel electrophoresis (SCGE), also known as comet assay. Cellular DNA damage could be visualized under fluorescence microscope after staining with a fluorescent DNA-binding dye EB. Olive tail moment (OTM), the tail length and the percentage of DNA in the tail (tail DNA%) were used to evaluate the extent of DNA damage of cells.Statistical analysis
All results were confirmed in at least three separate experiments. Data are expressed as mean ± standard deviation (SD). A one-way ANOVA was used for multiple comparisons. A value of p less than 0.05 was considered significant.Results
Characterizations of HAPs
The particle size and morphology of HAPs were observed under a TEM microscope. The sample is composed of nanorods with lengths of ∼80 nm and diameters of ∼20 nm (aspect ratios of 4) (Fig. 1A). The composition of HAPs was detected by XRD (Fig. 1B), and the diffraction peaks of sample can be well indexed to hexagonal phase hydroxyapatite (JCPDS no. 09-0432). The dispersibility of HAPs in medium was determined by DLS, indicating that the HAPs may be aggregated when they were added into cell culture medium (Fig. 1C). Fig. 1D shows the PL excitation and emission spectra of the HAPs. The excitation spectrum mainly exhibits a broad band from 280 to 400 nm with a maximum at 349 nm. Under excitation at 349 nm, the emission spectrum consists of an intense broad band from 350 nm to 600 nm (centered at 433 nm), which exhibits a blue emission.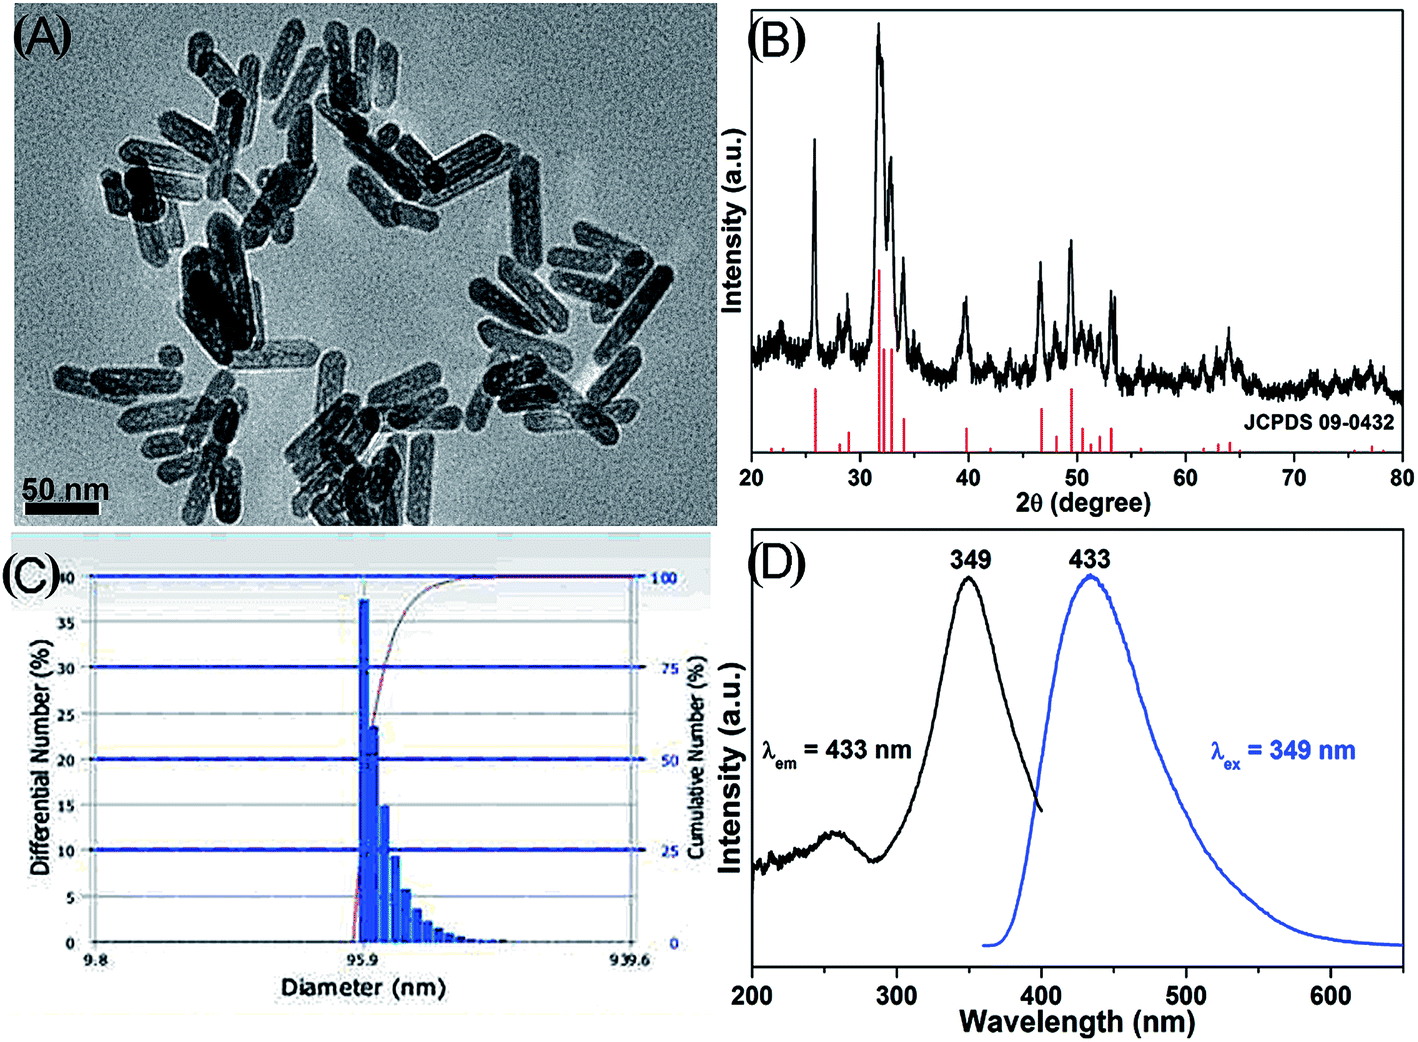 | ||
| Fig. 1 Characterizations of HAPs. (A) TEM image. (B) XRD pattern. (C) Particle size distribution. (D) PL excitation and emission spectra of HAPs. | ||
Effect of HAPs on cell viability and apoptosis
As shown in Fig. 2A, after the treatment with HAPs, the viability of MC3T3-E1 cells was significantly decreased in dose- and time-dependent manners. Fig. 2B and C shows that the apoptotic rate of MC3T3-E1 cells was only 7.89% in control group. After being incubated with 40 μg mL−1 of HAPs for 24 h, the apoptotic rate of cells was increased significantly to 34.97%.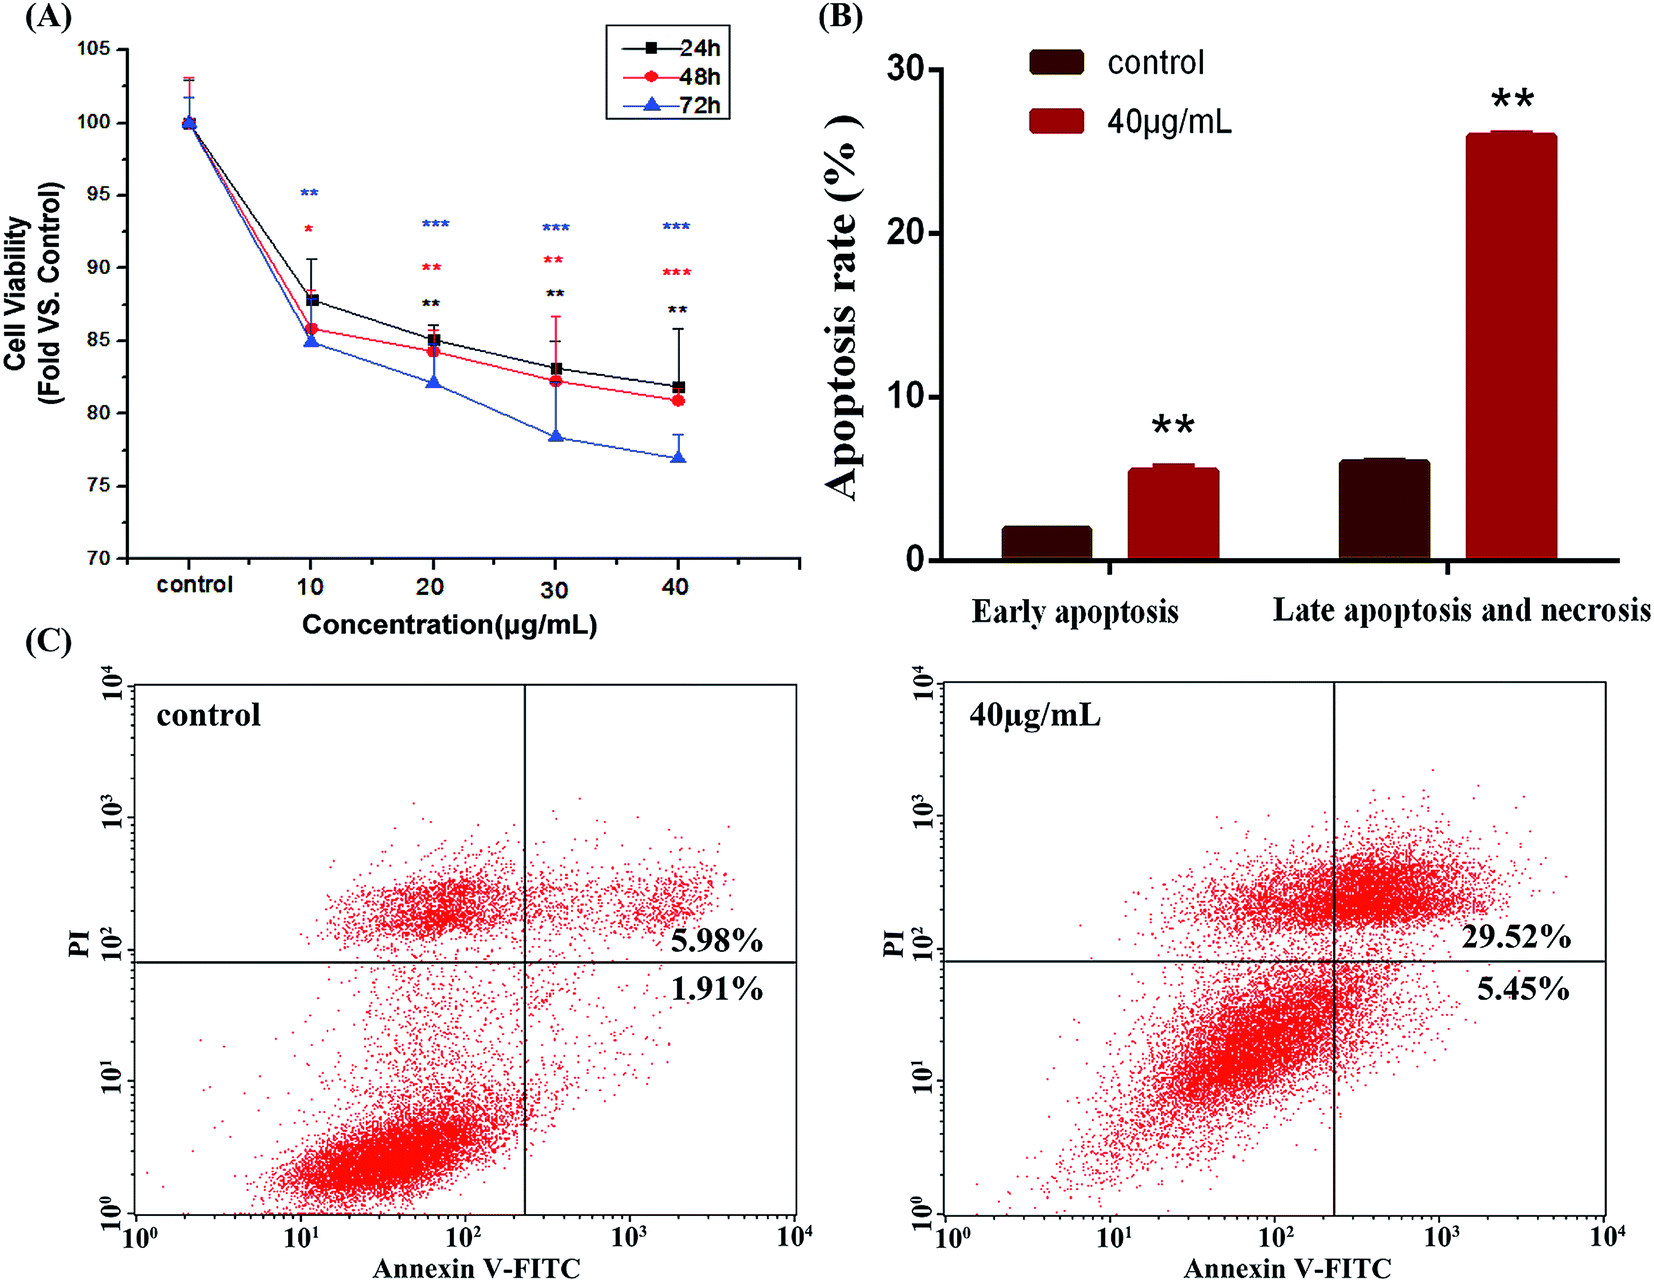 | ||
| Fig. 2 (A) The cell viability of MC3T3-E1 cells after incubation with 10, 20, 30, and 40 μg mL−1 of HAPs for 24, 48, and 72 h (*p < 0.05, **p < 0.01, and ***p < 0.001 vs. control). (B and C) HAPs induced apoptosis in MC3T3-E1 cells. (B) Statistic analysis of apoptosis rate (**p < 0.01 vs. control). (C) Flow cytometric quantification of apoptotic cells upon exposure to 40 μg mL−1 of HAPs for 24 h. | ||
Cellular uptake, endocytosis and intracellular localization of HAPs
As indicated in Fig. 3A and B, after cells were treated with 10, 20, 30, and 40 μg mL−1 of HAPs for 2, 4, 6, and 12 h, the scatter intensity sharply increased compared with that of control group. The results showed that HAPs were taken by MC3T3-E1 cells in dose- and time-dependent manners. The result of endocytosis mechanism from Fig. 3C showed that the scatter intensity of the macropinocytosis inhibitor (wortmannin) group led to a 12.5% decrease compared to that of positive group (37 °C), indicating that HAPs enter into cells through macropinocytosis pathway. To further ascertain the intracellular localization of HAPs in MC3T3-E1 cells, Lyso-Tracker and Mito-Tracker were used to label lysosome and mitochondrion, respectively. As shown in Fig. 3D, the blue fluorescence of HAPs overlapped with the red fluorescence of Lyso-Tracker mostly, but only a little with green fluorescence of Mito-Tracker. The result demonstrated that the HAPs were primarily distributed in lysosome.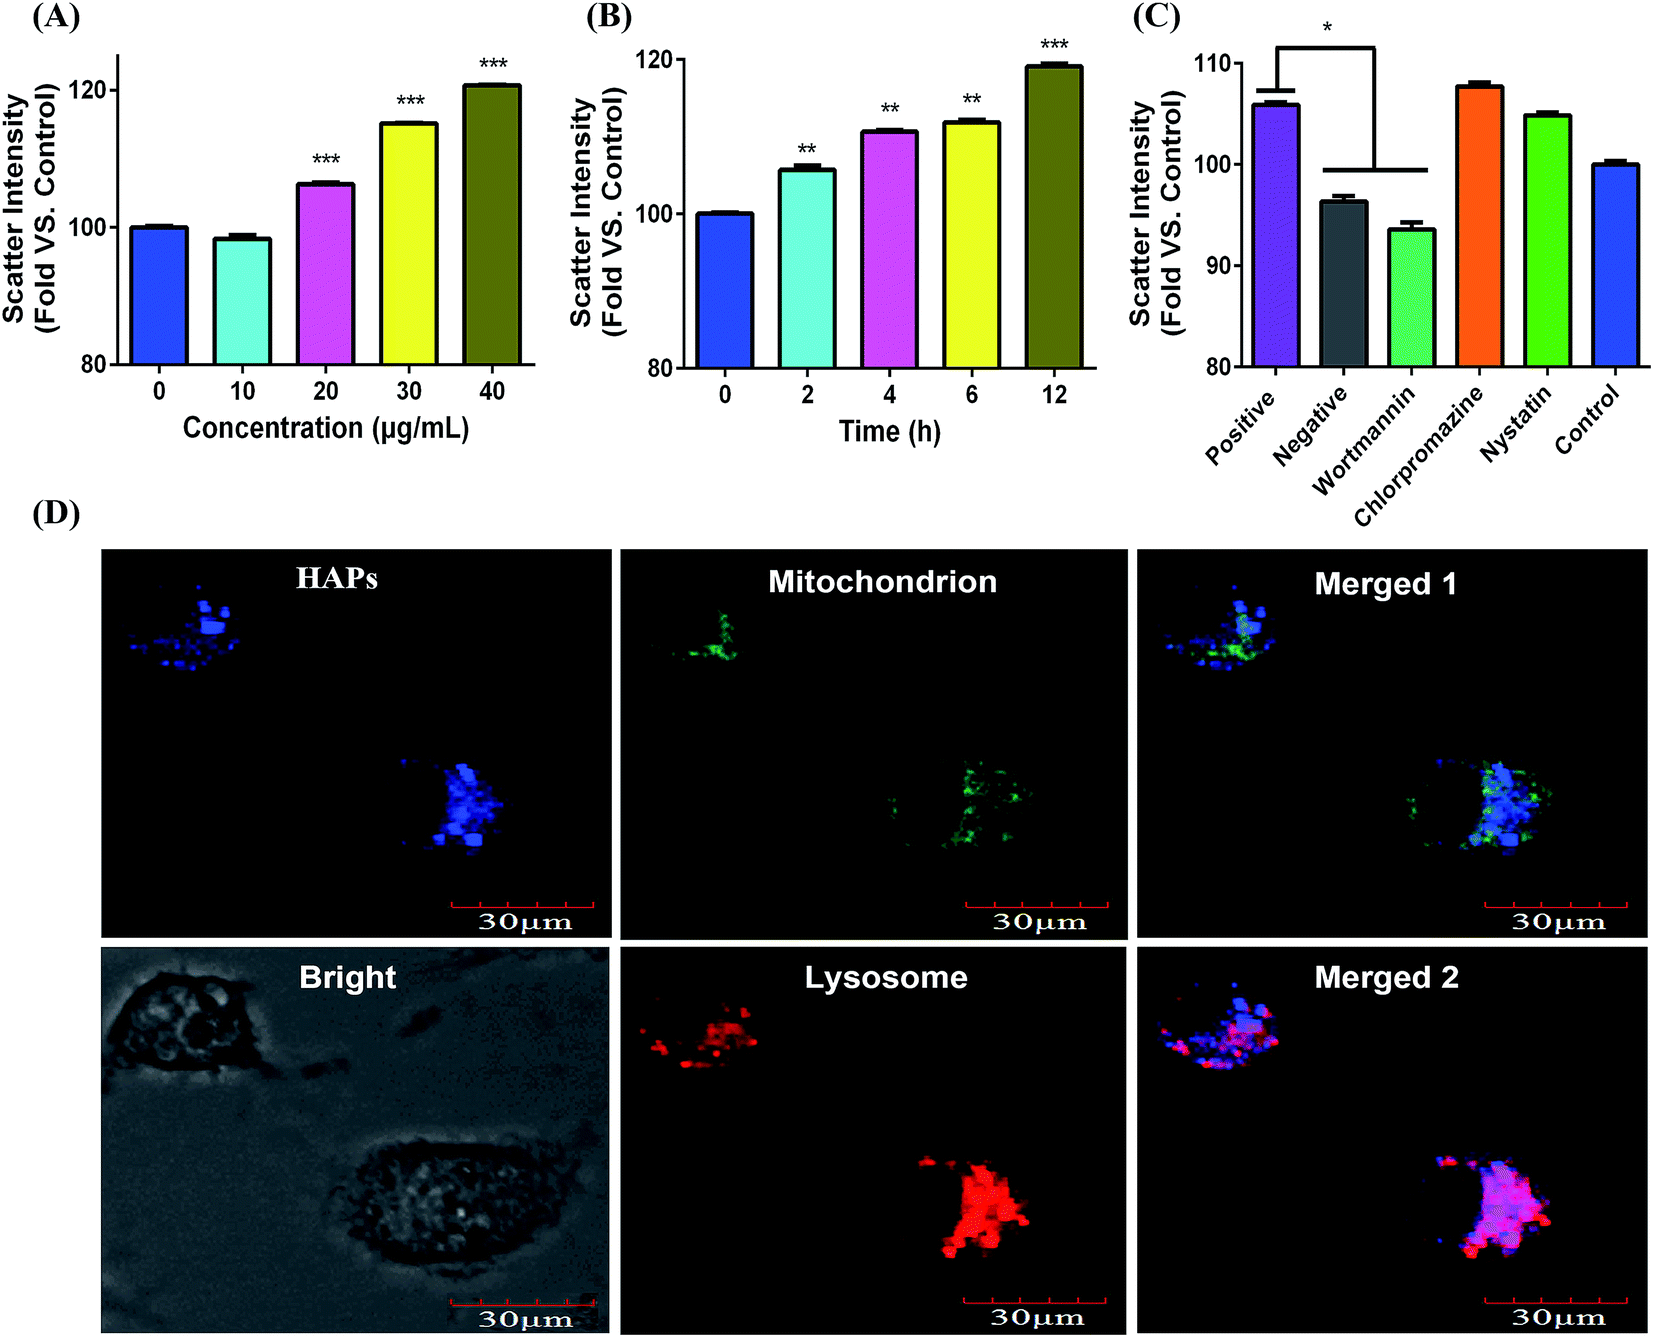 | ||
| Fig. 3 Cellular uptake, endocytosis mechanism and intracellular localization of HAPs. (A) The cells were incubated with different concentrations of HAPs for 24 h. (B) The cells were incubated with HAPs (40 μg mL−1) for 2, 4, 6, and 12 h. (C) The endocytosis mechanism of HAPs into MC3T3-E1 cells in the presence of different endocytosis inhibitors (*p < 0.05, **p < 0.01, and ***p < 0.001 vs. control). (D) Subcellular localization of HAPs in MC3T3-E1 cells using laser scanning confocal microscopy. The merged image 1 was HAPs and mitochondria. The merged image 2 was HAPs and lysosome. Bar: 30 μm. | ||
Measurement of ROS generation
As shown in Fig. 4A, ROS level in MC3T3-E1 cells has an approximately 1.63-, 1.55-, 1.51-, and 1.48-fold increase compared with the control group after 10, 20, 30, and 40 μg mL−1 of HAPs treatment for 24 h. These results were also further confirmed by fluorescent microscope. As shown in Fig. 4B, when MC3T3-E1 cells were exposed to 40 μg mL−1 of HAPs for 24 h, the fluorescence intensity increased. However, when MC3T3-E1 were pretreated with 5 mM N-acetylcysteine (NAC) for 1 h prior to 12 h treatment with 10, 20, 30, 40 μg mL−1 of HAPs, the inhibition of cell proliferation induced by HAPs turned to decrease (Fig. 4C).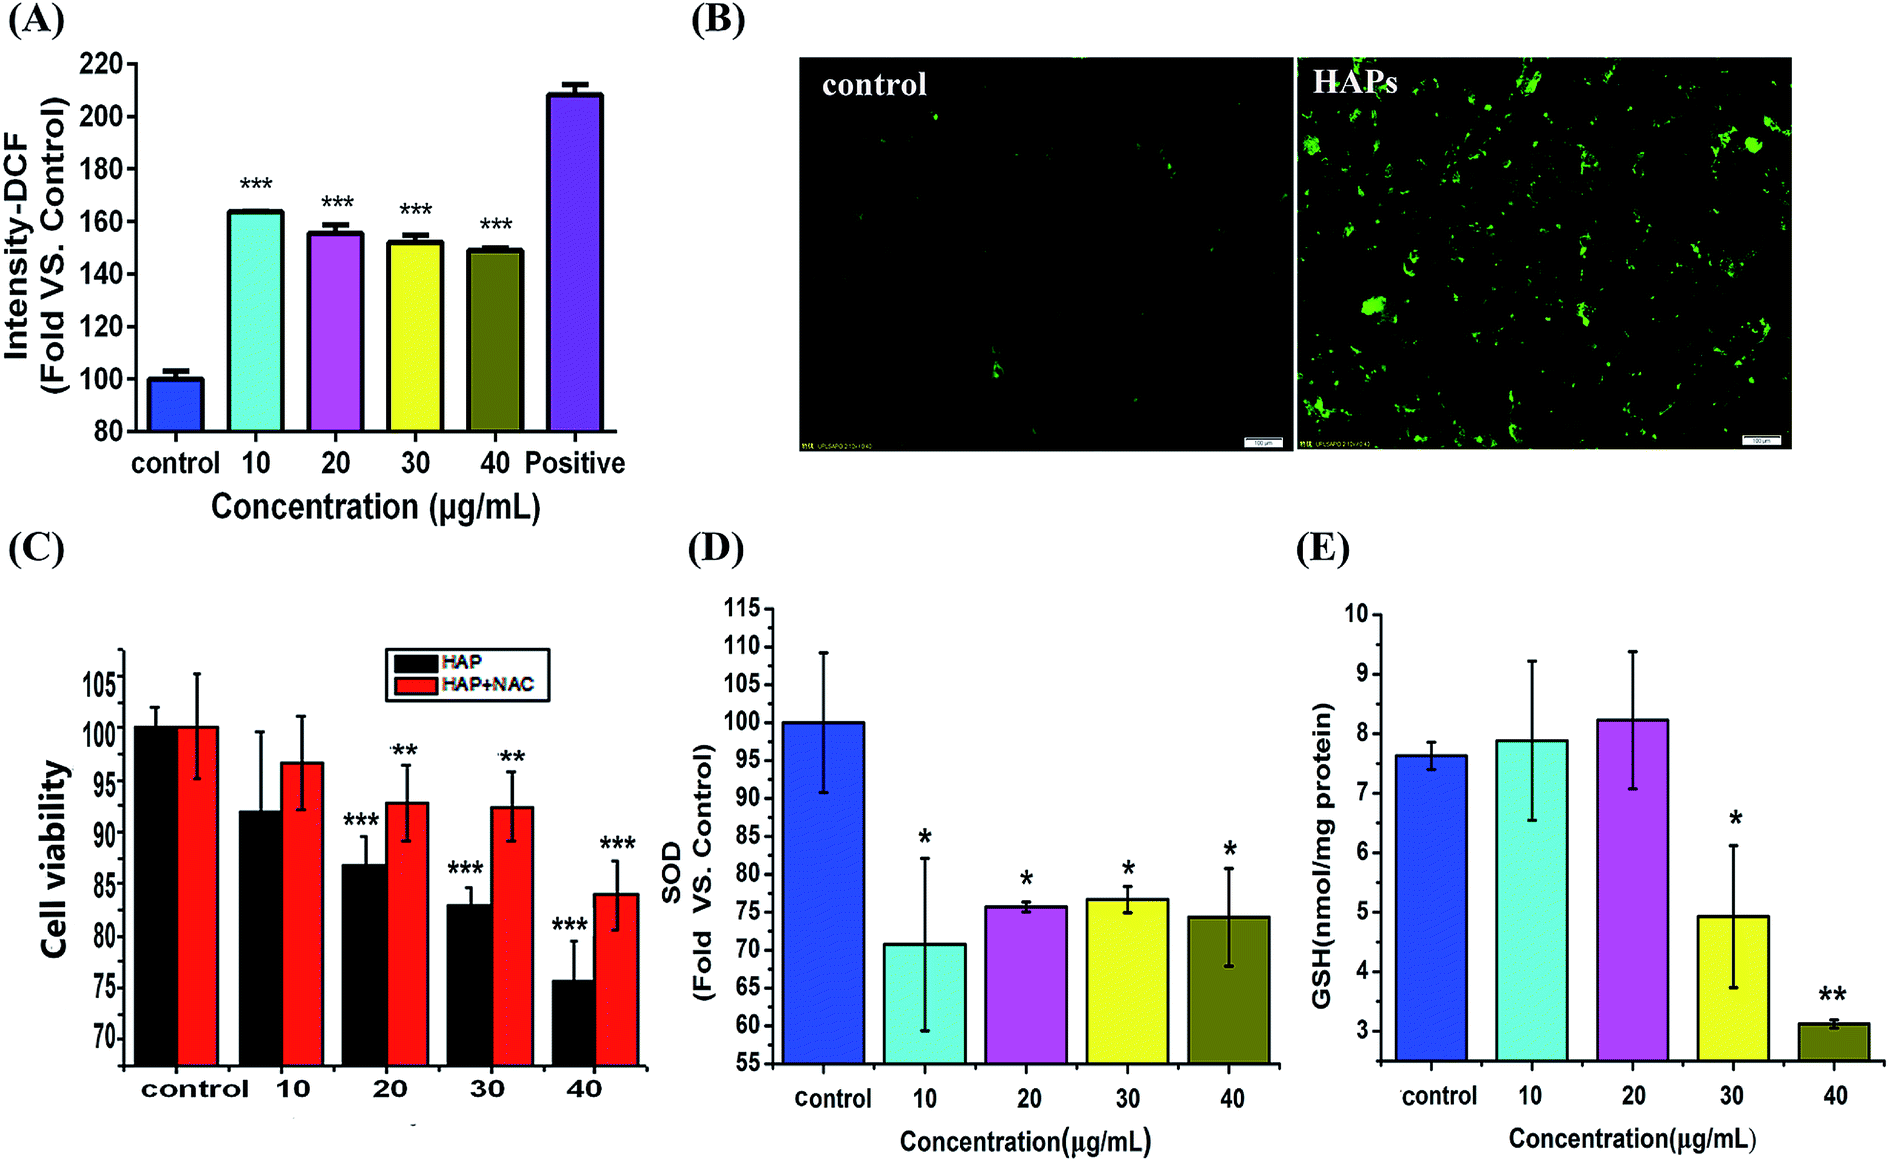 | ||
| Fig. 4 Oxidative stress-induced by HAPs in MC3T3-E1 cells. (A) The relative fluorescence intensity of DCF measured by flow cytometer after MC3T3-E1 cells were exposed to different concentrations HAPs for 24 h. (B) The morphological images of the cells stained by DCFH-DA were observed under fluorescence microscope after cells were exposed to 40 μg mL−1 of HAPs for 24 h. (C) The protective effect of NAC against HAPs-induced inhibition of cell proliferation. (D) SOD and (E) GSH-Px activities after treatment with different concentrations of HAPs (10, 20, 30, and 40 μg mL−1) for 24 h (*p < 0.05, **p < 0.01, and ***p < 0.001 vs. control). | ||
Effects of HAPs on SOD and GSH-Px activity
The activities of antioxidant enzymes SOD and GSH-Px decreased in HAPs treated cells compared to control cells. As shown Fig. 4D and E, HAPs at a concentration of 10 μg mL−1 caused a 72% decrease in SOD activity. 40 μg mL−1 of HAPs also induced a marked decrease in GSH-Px activity after 24 h treatment.Effects of HAPs on lysosomal damage and cathepsin B activity
As shown in Fig. 5A, after treatment with HAPs, the fluorescence intensity of treated cells was significantly decreased than that of control group, indicating lysosomal rupture. Meanwhile, cathepsin B was notably released from the lysosomes of MC3T3-E1 cells after incubation with 40 μg mL−1 HAPs (Fig. 5B).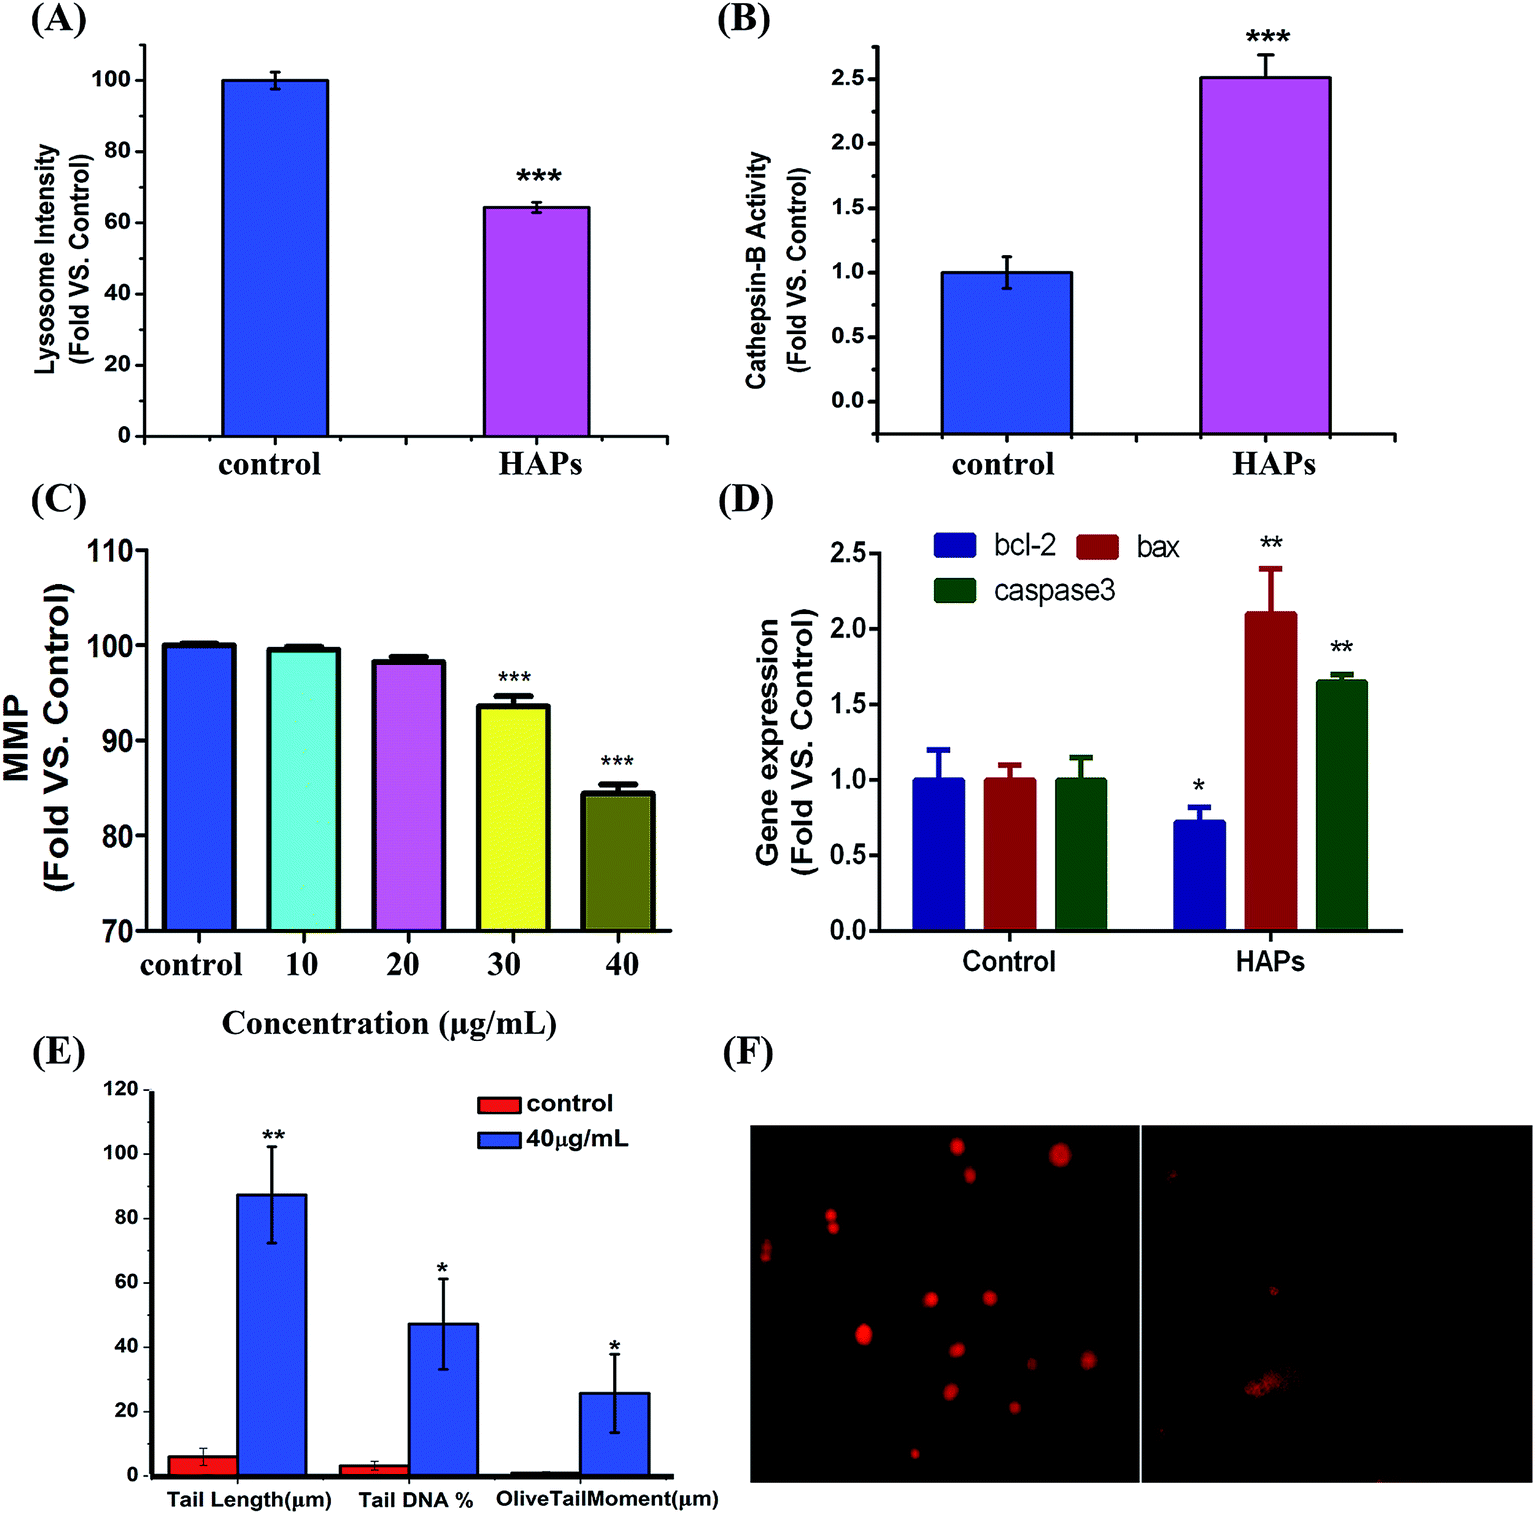 | ||
| Fig. 5 Apoptosis mechanism of MC3T3-E1 cells induced by HAPs. (A) The relative fluorescence intensity of AO measured by flow cytometer. (B) The cathepsin B activity of MC3T3-E1 exposed to 40 μg mL−1 of HAPs for 24 h. (C) Measurement of MMP in MC3T3-E1 cells after treatment with 10, 20, 30, and 40 μg mL−1 HAPs for 24 h. (D) The expression of apoptosis specific genes. (E and F) DNA damage caused by 40 μg mL−1 HAPs in MC3T3-E1 cells for 24 h. (E) DNA damage are evaluated by tail DNA%, tail length and olive tail moment (*p < 0.05, **p < 0.01, and ***p < 0.001 vs. control). (F) Representative images of the comet assay for MC3T3-E1 cells. | ||
Measurement of intracellular MMP
As shown in Fig. 5C, 10 and 20 μg mL−1 of HAPs have no effect on intracellular MMP, but 30 and 40 μg mL−1 of HAPs induced depolarization of the mitochondrial inner membrane and resulted in the loss of MMP.Effect of HAPs on apoptosis-related genes
The mRNA levels of the apoptosis-related genes, including bcl-2, bax and caspase3 after treatment by HAPs in MC3T3-E1 cells were shown in Fig. 5D. It can be seen that bcl-2 mRNA level was significantly suppressed by HAPs. But the bax and caspase3 mRNA levels in MC3T3-E1 cells were obviously increased in contrast with control group. The mRNA levels of bax and caspase3 were about 2.1- and 1.6-fold higher than that of control group, respectively.DNA damage induced by HAPs
As shown in Fig. 5E and F, compared with control cells, 40 μg mL−1 HAPs induced prominent DNA damage, confirmed by tail length (87.33 vs. 6), tail DNA% (47.20 vs. 6.20), and olive tail moment (25.70 vs. 0.93).Discussion
The interaction between HAPs and the biological system has a close relationship with the physico-chemical properties of particles. As recommended for toxicological evaluation, the physico-chemical properties of the HAPs were also important. The HAPs used in the experiment were rod-like particles with aspect ratios of 4. The XRD pattern of HAPs demonstrated the pure hexagonal phase of HAPs was formed without impurity phase detecting (Fig. 1). To clarify the effect of HAPs on MC3T3-E1 cells, we first tested cell vitality of MC3T3-E1 cells by MTT assay following exposure to varying concentrations of HAPs. The results revealed that HAPs exerted significant cytotoxicity and inhibited the proliferation of MC3T3-E1 cells in dose- and time-dependent manners (Fig. 2A). Induction of apoptosis or necrosis may account for the anti-proliferation effect. From the analysis of annexin V-FITC/PI staining assay by flow cytometry showed that the apoptotic rate of MC3T3-E1 cells treated with HAPs for 24 h was increased significantly, indicating HAPs could induce the apoptosis of MC3T3-E1 cells (Fig. 2B and C).As we know, the degree of cell damage may be closely associated with the uptake and accumulation of the nanoparticles in cells.25 It was also reported that shape, size and surface charge could influence the cellular uptake behavior and mechanism of nanoparticles.26–28 The HAPs used in the experiment were 50 nm. HAPs could be uptaken by MC3T3-E1 in a dose- and time-dependent manners (Fig. 3A and B). It is well known that the smaller and larger particles enter into cells via endocytosis and phagocytosis, respectively.29 The entry mechanism of various nanoparticles which has been reported as endocytosis was involved in clathrin, caveolae and pinocytosis.30 In order to discriminate the possible endocytosis pathway, several specific inhibitors of endocytosis routes included chlorpromazine, nystatin and wortmannin were used. Chlorpromazine is a known inhibitor of clathrin-mediated endocytosis, which induces dissociation of the clathrin lattice. Nystatin is a sterol-binding agent which disrupts caveolar integrity. Wortmannin as a potent phosphatidylinositol 3-kinase inhibitor is useful for inhibiting macropinocytosis.31 Our results indicated that HAPs enter into cells via an energy-dependent macropinocytosis endocytosis pathway (Fig. 3C). To further confirm the subcellular localization of HAPs in cells, Lyso-Tracker Red and Mito-Tracker Green as mitochondrial and lysosome indicators were used in our work. From the analysis of co-localization image, HAPs were found mainly localized in lysosome, slightly localized in mitochondria, and not in the cell nucleus (Fig. 3D).
It was reported that nanomaterials could provoke oxidative stress.32,33 Oxidative stress, where there is an imbalance between ROS and the cell's antioxidant capacity, is one of the classical stress response mechanisms, also plays an important role in the mechanism of the cell injury.34 It is well known that ROS, SOD and GSH are three important biochemical and physiological indexes of oxidative stress. ROS at high level could cause nuclear DNA proteins, carbohydrates and lipids damage. SOD, as one of enzymatic scavengers of ROS, can decrease the accumulation of ROS and prevent the oxidative injury. So the activity level of SOD is closely related to the antioxidative damage ability.35 GSH, as an important antioxidant, is capable of preventing damage to important cellular components caused by ROS.36 Thus, preserving the GSH-mediated antioxidant defense is critical for cell survival. SOD can catalyze the dismutation of superoxide into H2O2, and then by GSH-Px and catalase (CAT) to decompose H2O2 into H2O. In this study, the augmentation of ROS was found in MC3T3-E1 of HAPs treated group (Fig. 4A and B). Meanwhile, the activities of antioxidant enzymes SOD and GSH-Px were decreased in HAPs treated cells, which corresponds with the increase in apoptotic cells (Fig. 4C and D). Moreover, ROS scavenger NAC was used for further study. MTT results showed that when cells were pre-treated with NAC, the cell viability increased observably in HAPs-treated group, indicating NAC can reduce the cell damage by HAPs. All results demonstrated that HAPs might induce the apoptosis of MC3T3-E1 cells by enhancement of intracellular ROS generation, and affect the oxidant–antioxidant balance.
There are some different mechanisms involved in toxicity effects of nanomaterials. Numerous studies confirmed that nanomaterials may induce apoptosis, necrosis or inflammation by oxidative stress.37 Oxidative stress as an important mediator of cytotoxicity, can leads to very different outcomes, such as injury of lysosome integrity as well as potential compensatory responses, mitochondrial dysfunction, DNA oxidative damage and so on.38 Recently some researches also shown that there are two major intrinsic apoptotic pathways: mitochondria and lysosome pathways.39,40 The mitochondrial pathway is mediated by bcl-2 family proteins, which regulate the release of cytochrome c from the mitochondria into the cytosol followed by caspase3 activation. bcl-2 directly control the permeability of the outer mitochondrial membrane, whereas bax induces the opening of membrane pore.41 Results from Real-time PCR demonstrated that the HAPs down-regulated the level of bcl-2, up-regulated the level of bax and activate caspase3 (Fig. 5D). This could be concluded that HAPs activates the mitochondria apoptotic pathway, which is characterized by modulation of bax and bcl-2 expressions, and loss of MMP (Fig. 5C). With the exception of its important role in degradation of proteins, the lysosome is now also recognized as a key factor of integration of different apoptotic stimuli.42,43 Studies suggest that oxidative stress involved in lysosomal related apoptotic cascades.44,45 Many studies have demonstrated that lysosomal permeabilization was a key factor in the process of cell death, consequently facilitated the release of lysosomal enzymes into the cytoplasm, such as cathepsin B, a lysosomal cysteine protease, which is a candidate for an apoptotic mediator originating from acidic vesicles. Yan et al. reported that cathepsin B played an essential role in tumor necrosis factor- (TNF-α)-induced apoptosis in vitro and in vivo.46 Due to the importance of lysosomal destabilization in the initiation of the apoptotic pathway, we examined the potential role of HAPs in inducing LMP. Our study clearly showed HAPs caused a significant increase of LMP (Fig. 5A) and the activity of cathepsin B (Fig. 5B). The results suggest that lysosomal membrane damage may induce cathepsin B release which contributed significantly to HAPs-mediated apoptosis in MC3T3-E1 cells. In addition, it was reported that endogenous ROS is the important source of spontaneous damage to DNA.47 The alkaline comet assay was recommended for assessing the genotoxicity of materials.48 We found that HAPs could cause DNA lesions (Fig. 5E and F). Therefore, we concluded that ROS-related DNA lesions was also a important factor of cell apoptosis caused by HAPs.
Together, this work proposed a mechanism of the MC3T3-E1 cells apoptosis induced by HAPs. The HAPs were uptaken into MC3T3-E1 cells through an macropinocytosis endocytosis pathway and localized in lysosome. HAPs induced oxidative stress, caused the imbalance of ROS and the cell's antioxidant capacity. On one hand, the oxidative stress induced lysosomal rupture, cathepsin B release, which is a pathway mediating apoptosis. On the other hand, oxidative stress induced a mitochondria-dependent apoptosis pathway via modulation of bax and bcl-2 expressions, disruption of MMP, activation of caspase3. In addition, HAPs also caused DNA lesions (Fig. 6).
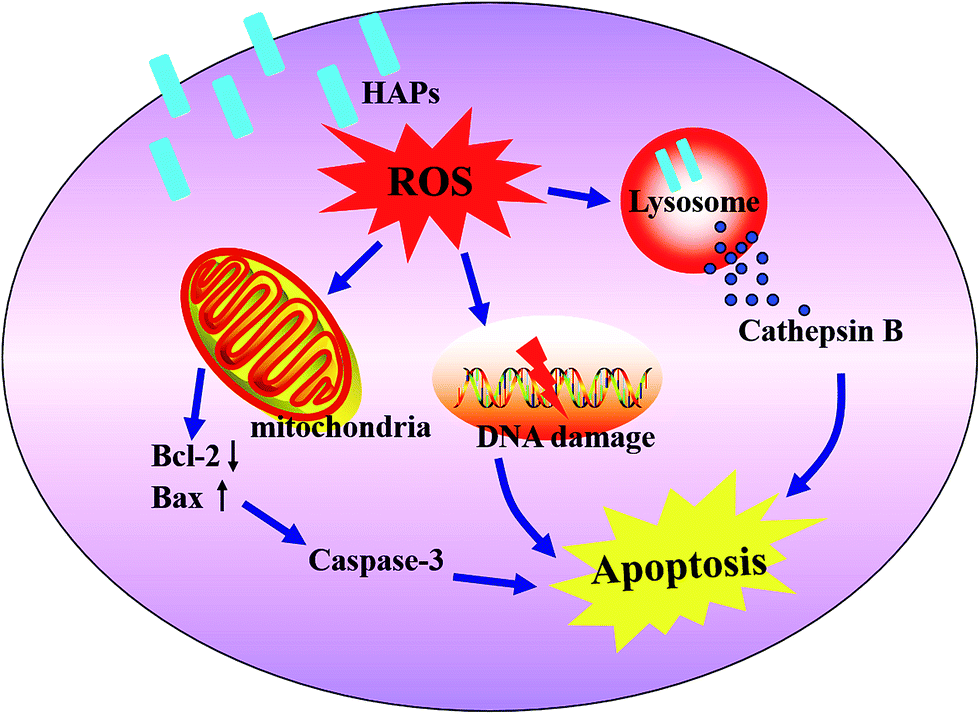 | ||
| Fig. 6 The mechanism of apoptosis of MC3T3-E1 induced by HAPs. | ||
Conclusion
In conclusion, the results showed that HAPs could induce apoptosis in MC3T3-E1 cells via oxidative stress. HAPs induced ROS generation and led to damage to cellular components. The overproduction of ROS not only induced lysosomal rupture, but also damaged the mitochondria and DNA. Our study will provide some valuable data for biomedical applications of HAPs in the future.Conflict of interest
The authors declare that no competing interests exist.Acknowledgements
This work was supported in part by Chinese Natural Science Foundation Project (21271059, 81200078, 21301046, 51302062), “Three Three Three” Talents Project of Hebei Province (A201401002), Research Fund for the Doctoral Program of Higher Education of China (20131301120004), Hebei Province “Hundred Talents Program” (BR2-202), Key Program of Hebei Education Department (ZD2015031), China Postdoctoral Science Foundation Funded Project (2013M530119, 2014T70226), Training Program for Innovative Research Team and Leading Talent in Hebei Province University (LJRC024). The Second Batch of Top Youth Talent Support Program of Hebei Province, Distinguished Young Scholars Fund of Hebei University (2015JQ04).References
- N. Tamai, A. Myoui, T. Tomita, T. Nakase, J. Tanaka, T. Ochi and H. Yoshikawa, J. Biomed. Mater. Res., 2002, 59, 110–117 CrossRef CAS PubMed.
- D. A. Wahl and J. T. Czernuszka, Eur. Cells Mater., 2006, 28, 43–56 CrossRef.
- B. S. Kim, J. S. Kim, Y. S. Chung, Y. W. Sin, K. H. Ryu, J. Lee and H. K. You, J. Biomed. Mater. Res., Part A, 2013, 101, 1550–1558 CrossRef PubMed.
- H. Cao, L. Zhang, H. Zheng and Z. Wang, J. Phys. Chem. C, 2010, 114, 18352–18357 CAS.
- V. Uskoković and D. P. Uskoković, J. Biomed. Mater. Res., Part B, 2011, 96, 152–191 CrossRef PubMed.
- H. W. Kim, J. H. Song and H. E. Kim, J. Biomed. Mater. Res., Part A, 2006, 79, 698–705 CrossRef PubMed.
- D. Bhuiyan, M. J. Jablonsky, I. Kolesov, J. Middleton, T. M. Wick and R. Tannenbaum, Acta Biomater., 2015, 15, 181–190 CrossRef CAS PubMed.
- C. M. Curtin, G. M. Cunniffe, F. G. Lyons, K. Bessho, G. R. Dickson, G. P. Duffy and F. J. O'Brien, Adv. Mater., 2012, 24, 749–754 CrossRef CAS PubMed.
- N. S. Remya, S. Syama, V. Gayathri, H. K. Varma and P. V. Mohanan, Colloids Surf., B, 2014, 117, 389–397 CrossRef CAS PubMed.
- C. Wang, D. Liu, C. Zhang, J. Sun, W. Feng, X.-J. Liang, S. Wang and J. Zhang, ACS Appl. Mater. Interfaces, 2016, 8, 11262–11271 CAS.
- A. Doostmohammadi, A. Monshi, R. Salehi, M. H. Fathi, E. Seyedjafari, A. Shafiee and M. Soleimani, Biomed. Pap., 2011, 155, 323–326 CrossRef CAS PubMed.
- J. S. Sun, F. H. Lin, T. Y. Hung, Y. H. Tsuang, W. H. Chang and H. C. Liu, J. Biomed. Mater. Res., 1999, 45, 311–321 CrossRef CAS PubMed.
- L. Chen, J. M. Mccrate, J. C. Lee and H. Li, Nanotechnology, 2011, 22, 105708 CrossRef PubMed.
- L. Wang, G. Zhou, H. Liu, X. Niu, J. Han, L. Zheng and Y. Fan, Nanoscale, 2012, 4, 2894–2899 RSC.
- M. Suda, K. Tanaka, K. Natsui, T. Usui, I. Tanaka, M. Fukushima, C. Shigeno, J. Konishi, S. Narumiya, A. Ichikawa and N. Nakao, Endocrinology, 1996, 137, 1698–1705 CAS.
- C. Zhang, J. Yang, Z. Quan, P. Yang, C. Li, Z. Hou and J. Lin, Cryst. Growth Des., 2009, 9, 2725–2733 CAS.
- D. Liu, C. Yi, D. Zhang, J. Zhang and M. Yang, ACS Nano, 2010, 4, 2185–2195 CrossRef CAS PubMed.
- J. P. Aubry, A. Blaecke, S. Lecoanet-Henchoz, P. Jeannin, N. Herbault, G. Caron, V. Moine and J. Y. Bonnefoy, Cytometry, 1999, 37, 197–204 CrossRef CAS PubMed.
- S. Chen, Y. Hou, G. Cheng, C. Zhang, S. Wang and J. Zhang, Biol. Trace Elem. Res., 2013, 154, 156–166 CrossRef CAS PubMed.
- S. Chen, C. Zhang, G. Jia, J. Duan, S. Wang and J. Zhang, Mater. Sci. Eng., C, 2014, 43, 330–342 CrossRef CAS PubMed.
- S. Bhattacharjee, D. Ershov, M. A. Islam, A. M. Kampfer, K. A. Maslowska, J. van der Gucht, G. M. Alink, A. T. M. Marcelis, H. Zuilhofa and L. M. C. M. Rietjens, RSC Adv., 2014, 4, 19321–19330 RSC.
- K. Ge, W. Sun, S. Zhang, S. Wang, G. Jia, C. Zhang and J. Zhang, RSC Adv., 2016, 6, 21725–21734 RSC.
- T. Sato, T. Machida, S. Takahashi, K. Murase, Y. Kawano, T. Hayashi, S. Iyama, K. Takada, K. Kuribayashi, Y. Sato, M. Kobune, R. Takimoto, T. Matsunaga, J. Kato and Y. Niitsu, J. Immunol., 2008, 181, 197–207 CrossRef CAS.
- S. Nunes Rda, V. F. Kahl, S. Sarmento Mda, M. F. Richter, J. A. Abin-Carriquiry, M. M. Martinez, B. Ferraz Ade and J. Da Silva, Phytother. Res., 2013, 27, 1495–1501 Search PubMed.
- Y. H. Ma, C. P. Huang, J. S. Tsai, M. Y. Shen, Y. K. Li and L. Y. Lin, Toxicol. Lett., 2011, 207, 258–269 CrossRef CAS PubMed.
- L. Hu, Z. Mao and C. Gao, J. Mater. Chem., 2009, 19, 3108–3115 RSC.
- Y. Cai, Y. Liu, W. Yan, Q. Hu, J. Tao, M. Zhang, Z. Shi and R. Tang, J. Mater. Chem., 2007, 17, 3780–3787 RSC.
- S. E. Gratton, P. A. Ropp, P. D. Pohlhaus, J. C. Luft, V. J. Madden, M. E. Napier and J. M. Desimone, Proc. Natl. Acad. Sci. U. S. A., 2008, 105, 11613–11618 CrossRef CAS PubMed.
- S. D. Conner and S. L. Schmid, Nature, 2003, 422, 37–44 CrossRef CAS PubMed.
- Y. Jin, S. Chen, J. Duan, G. Jia and J. Zhang, J. Inorg. Biochem., 2015, 146, 28–36 CrossRef CAS PubMed.
- C. Greulich, J. Diendorf, T. Simon, G. Eggeler, M. Epple and M. Köller, Acta Biomater., 2011, 7, 347–354 CrossRef CAS PubMed.
- Y. J. Kim, M. Yu, H. O. Park and S. I. Yang, Mol. Cell. Toxicol., 2010, 6, 336–343 CrossRef CAS.
- M. I. Setyawati, C. Y. Tay and D. T. Leong, Biomaterials, 2013, 34, 10133–10142 CrossRef CAS PubMed.
- I. Passagne, M. Morille, M. Rousset, I. Pujalté and B. L'azou, Toxicology, 2012, 299, 112–124 CrossRef CAS PubMed.
- P. Xu, J. Xu, S. Liu and Z. Yang, J. Hazard. Mater., 2012, 241, 279–286 CrossRef PubMed.
- W. Lin, Y. Huang, X. Zhou and Y. Ma, Toxicol. Appl. Pharmacol., 2006, 217, 252–259 CrossRef CAS PubMed.
- H. Turkez, M. I. Yousef, E. Sönmez, B. Togar, F. Bakan, P. Sozio and A. D. Stefano, J. Appl. Toxicol., 2014, 34, 373–379 CrossRef CAS PubMed.
- T. Kurz, A. Terman, B. Gustafsson and U. T. Brunk, Biochim. Biophys. Acta, 2008, 1780, 1291–1303 CrossRef CAS PubMed.
- V. Stoka, B. Turk, S. L. Schendel, T. H. Kim, T. Cirman, S. J. Snipas, L. M. Ellerby, D. Bredesen, H. Freeze, M. Abrahamson, D. Brömme, S. Krajewski, J. C. Reed, X. M. Yin, V. Turk and G. S. Salvesen, J. Biol. Chem., 2001, 276, 3149–3157 CrossRef CAS PubMed.
- S. Fulda, E. Meyer, C. Friesen, S. A. Susin, G. Kroemer and K. M. Debatin, Oncogene, 2001, 20, 1063–1075 CrossRef CAS PubMed.
- E. Z. Bagci, Y. Vodovotz, T. R. Billiar, G. B. Ermentrout and I. Bahar, Biophys. J., 2006, 90, 1546–1559 CrossRef CAS PubMed.
- S. Aits and M. Jaattela, J. Cell Sci., 2013, 126, 1905–1912 CrossRef CAS PubMed.
- U. Repnik, V. Stoka, V. Turk and B. Turk, Biochim. Biophys. Acta, 2012, 1824, 22–33 CrossRef CAS PubMed.
- G. Hristov, T. Marttila, C. Durand, B. Niesler, G. A. Rappold and A. Marchini, Hum. Mol. Genet., 2014, 23, 1619–1630 CrossRef CAS PubMed.
- C. O. Eno, G. Zhao, A. Venkatanarayan, B. Wang, E. R. Flores and C. Li, Free Radical Biol. Med., 2013, 65, 26–37 CrossRef CAS PubMed.
- B. Yan, W. Wang, L. Chen, M. Bi, Y. Lu, B. Li and B. Yang, World J. Gastroenterol., 2009, 15, 1231–1236 CrossRef CAS PubMed.
- S. Kim and D. Y. Ryu, J. Appl. Toxicol., 2013, 33, 78–89 CrossRef PubMed.
- V. Opačić-Galić, V. Petrović, S. Zivković, V. Jokanović, B. Nikolić, J. Knežević-Vukčević and D. Mitić-Ćulafić, Int. Endod. J., 2013, 6, 506–516 CrossRef PubMed.
| This journal is © The Royal Society of Chemistry 2017 |