 Open Access Article
The novel compound dimethylamine-5,5′-bistetrazole-1,1′-diolate: crystal structure, thermal investigation, safety evaluation and theoretical studies†
Yuehai Yua,
Shusen Chena,
Xin Lia,
Shaohua Jin a,
Lijie Lia,
Guangyuan Zhangb,
Xiao Mab and
Qinghai Shu
 *a
*a
aSchool of Materials Science and Engineering, Beijing Institute of Technology, 100081 Beijing, China. E-mail: qhshu121@bit.edu.cn
bResearch Institute of Gansu Yin'guang Chemical Industry Group Baiyin, 730900, P. R. China
First published on 30th March 2017
Abstract
The crystal of dimethylamine 5,5′-bistetrazole-1,1′-diolate, one possibly unknown intermediate in the production of the famous high energy insensitive explosive TKX-50, was easily prepared from the precursor of TKX-50 and solvent media and characterized by single-crystal X-ray analysis. In addition, the thermal behavior, and safety parameters of DMA-BTO were investigated, which will offer an important message for the production and application of TKX-50. Finally, the stabilization energy E(2), molecular electrostatic potential, HOMO–LUMO energy gaps and Mulliken charge distributions were calculated using Gaussian 09 at the B3LYP/6-311G(d,p) level.
1. Introduction
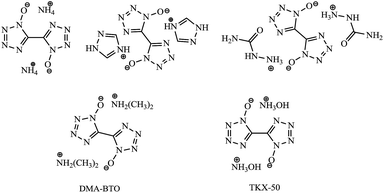
Recently, a new class of explosives1–11 with high energy and low sensitivity has been paid much attention since they are believed to be greener, safer and cheaper high energy density materials (HEDMs). Among them, one of the most promising HEDMs is considered to be the nitrogen-rich heterocyclic tetrazole derivatives12–15 due to their high content of nitrogen and low carbon and hydrogen contents as well as high positive enthalpy of formation. In particular, 5,5′-bistetrazole-1,1′-diolate derivatives (Scheme 1) became one booming topic16–19 in the area of propellants, explosives and pyrotechnics as soon as dihydroxylammonium 5,5′-bistetrazole-1,1′-diolate (TKX-50) was reported by Niko Fischer15 from 5,5′-bistetrazole-1,1′-diolate (BTO) in N,N-dimethylformamide (DMF) and water. To help analyze the product purity and component analysis, it is very important to understand the stability and reactivity of BTO in DMF and water media.Surprisingly, one new BTO derivative dimethylamine 5,5′-bistetrazole-1,1′-diolate (DMA-BTO) was easily achieved by the reaction of BTO with solvent DMF and water at room temperature. It could be one important unknown intermediate and/or side product in the production of TKX-50 so far. Based on the best of our knowledge, this is the first report on the reaction of BTO with media DMF and water, and it would make a great improvement on the production of TKX-50. In order to gain a detailed understanding of this new material, the thermal decomposition behavior of DMA-BTO was analyzed by TG-DTA and the activation energy was calculated by Kissinger and Ozawa methods. In addition, the advanced kinetics and technology solutions (AKTS) software was used to calculate the activation energy and predict the time to maximum rate under adiabatic conditions (TMRad) and the self-accelerating decomposition temperature (SADT) in 1–50 kg package. The theoretical performance data were calculated using Gaussian 09 at the B3LYP/6-311G(d,p) level for better understanding the relationship between structure and properties.
2. Experimental
2.1 Synthesis of DMA-BTO
BTO, prepared according to the literature,15 (500 mg, 2.43 mmol) was dissolved in the mixed solution (10 mL) of H2O and DMF with the volume ratio of 1![[thin space (1/6-em)]](https://www.rsc.org/images/entities/char_2009.gif) :
:![[thin space (1/6-em)]](https://www.rsc.org/images/entities/char_2009.gif) 1 and obtained a saturated solution eventually. The colorless crystal of DMA-BTO was obtained by slow evaporation of solvent at room temperature in 2 days.
1 and obtained a saturated solution eventually. The colorless crystal of DMA-BTO was obtained by slow evaporation of solvent at room temperature in 2 days.
2.2 Crystal structures
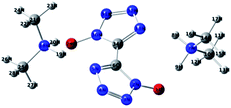
The crystals were found to contain one molecule of dimethylamine per molecule of BTO (see Fig. S1, Tables S1 and S2†). A colorless plate-like single crystal of dimensions 0.65 × 0.10 × 0.03 mm3 was mounted on a MiteGen MicroMesh using a small amount of Cargille Immersion Oil. Data were collected on a Bruker three-circle platform diffractometer equipped with a SMART APEX II CCD detector. The crystals were irradiated using graphite monochromatized MoKα radiation (λ = 0.71073). An Oxford Cobra low-temperature device was used to keep the crystals constant at T = 153(2) K during data collection. The structure was solved and refined with the aid of the programs in the SHELXTL-PLUS suite of programs.20,21 The full-matrix least-squares refinement on F2 includes atomic coordinates and anisotropic displacement parameters for all non-H atoms. The H atoms were included suing a riding model. Table S1† summarizes important crystal structure data.The molecular and crystal structure of DMA-BTO was shown in Fig. 1. The unit cell of DMA-BTO consists of a bistetrazole anion and two dimethylamine (CH3)2NH2+ cations. Atomic coordinates, bond lengths, angles, and torsion angles were listed in Tables S3 and S4.†
3. Results and discussion
3.1 Thermal behaviour
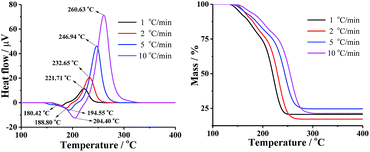
The TG-DTA curves of DMA-BTO were carried out under different heating rates of 1, 2, 5, and 10 °C min−1 to study the thermal decomposition of the crystal by Shimadzu DTG-60 instrument (Kyoto, Japan). The test temperature range for TG was 50–450 °C with the sample mass about 1–2 mg, placing in Al2O3 crucible without pan, under 50 mL min−1 dynamic nitrogen atmosphere. The DTA and TG curves of different hating rate were shown in Fig. 2 and Table S5.† In Fig. 2, the endothermic peak was assigned to the melting process and the exothermic peak clearly indicated that the thermal decomposition of DMA-BTO occurred beyond 221 °C and increased with the rise of the heating rate.3.2 Kinetic parameters
To determine the kinetic parameters of the match head composition, Ozawa and Kissinger's methods were applied. Kissinger22 and Flynn–Wall–Ozawa23 methods, described in following eqn (1) and (2), respectively, would be more suitable owing to deriving from the basic kinetic equations for heterogeneous chemical reactions,24 according to the International Confederation for Thermal Analysis and Calorimetry (ICTAC) Kinetics Committee25 recommendations for performing kinetic computations on thermal analysis data.Kissinger method (differential method):
 | (1) |
Flynn–Wall–Ozawa method (integral method):
 | (2) |
 | (3) |
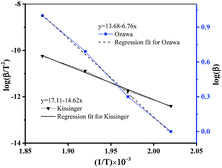
The kinetic parameters of thermal decomposition reaction calculated by Kissinger (see Table S6†) and Ozawa methods (see Table S7†), described by eqn (1) and (2) were shown in Fig. 3 and summarized in Table S8.†
In order to compare the results from different methods and predict the safety properties of DMA-BTO (in next chapter), the TG-DTA data were also analyzed by the advanced kinetics and technology solutions (AKTS) thermokinetics program.26–30 The exothermic data of DMA-BTO was used to derive and estimate the activation energy Ea and the modified pre-exponential factor A(α) by AKTS software, without explicitly guessing a particular form of the reaction model f(α). The reaction rate dα/dt and reaction progress α (described in Fig. 4) were exactly calculated by the results of various conversion rate for DMA-BTO, using the expressions of eqn (4) and (5):
 | (4) |
 | (5) |
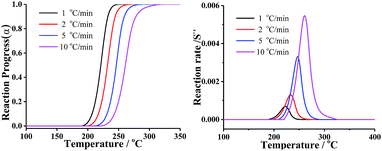 | ||
| Fig. 4 The relations between (left) reaction progress, (right) reaction rates and temperature of DMA-BTO by AKTS. | ||
Conversion rate with respect to temperature can be used to assess f(α) model of the special form of reaction activation energy Ea, which is the most common differential conversion method proposed by Friedman. The conversion rate dα/dt as a function of the reciprocal temperature at any conversion α was expressed in eqn (6):
 | (6) |
As shown in Fig. S2,† Ea of DMA-BTO is about 110 to 123 kJ mol−1 when α is between 0.05 and 0.99. For comparison, the activation energy was also calculated by ATKS using ASTM E698 method31 and the corresponding Ea was 125.04 kJ mol−1, as shown in Fig. S3.†
In summary, the kinetic parameters of thermal decomposition of DMA-BTO, calculated by the different methods, was listed in Table 1. From the data, we can make a conclusion that the activation energy calculated by AKTS software, Kissinger method and Ozawa method has good consistency.
| Methods | Kissinger | Ozawa | AKTS | |
|---|---|---|---|---|
| Friedman | ASTM E698 | |||
| Ea (kJ mol−1) | 122.53 | 124.65 | 110–123 (0.05 < α < 0.99) | 125.04 |
3.3 Safety parameters prediction
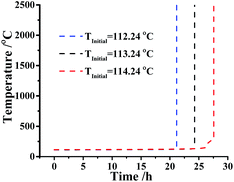
For the sake of discussing the safety of DMA-BTO in adiabatic condition, the nonisothermal data of DMA-BTO was employed in the kinetic method to calculate the safety parameters (Table S9†).As is known to all, a threshold temperature is significant for whether the industrial production or storage and transportation of energetic materials. Here, we assumed that the kilo-scale energy materials DMA-BTO were transported in the adiabatic condition and how to obtain the threshold temperature for application of DMA-BTO in this case? The AKTS software can use the thermal data to calculate the temperature–time curve (Fig. 5). In an ideal situation, phi (thermal inertia factor) = 1 and the critical value TMRad = 24 h are commonly accepted as the safety limit. When the temperature of DMA-BTO is 113.24 °C, the TMRad is reached after 24 h. That is to say, the production can be safely storage and transferred below 113.24 °C.
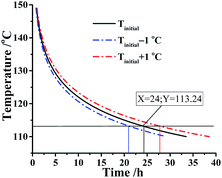 | ||
| Fig. 5 Simulation of thermal safety diagram: TMRad as a function of initial temperature for DMA-BTO by AKTS. | ||
However, if the temperature raised close or above the threshold temperature 113.24 °C, what measures should be taken? Considering this situation, the confidence interval of TMRad is predicted at the same assumptions. Fig. 6 indicated the simulation of TMRad of DMA-BTO and its 95% confidence intervals when the initial temperature is 113.24 °C.
As described in Fig. 6, the value of the TMRad is about 24.2 h and the lower and upper limits of the confidence interval are 21.2 h and 27.6 h, respectively, which means that if the runaway reaction happens, the fastest reaction time is 21.2 h and the lowest time is 27.6 h. Consequently, the time of safe zone is less than 21.2 h if a runaway reaction of DMA-BTO does happen.
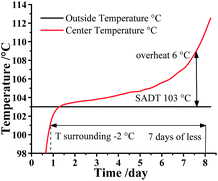
Additionally, ATKS software also can calculate the Self Accelerating Decomposition Temperature (SADT), which is the lowest temperature at which a material in a typical vessel or shipping package will undergo a self-accelerating decomposition at least 6 °C within one week. In other words, the SADT indicates the maximum safe storage temperature of material for a long storage periods. As listed in Table S9,† the SADT decreased with the increasing mass of DMA-BTO. As a consequence, the maximum safe storage temperature of DMA-BTO is 103 °C at 50 kg as shown in Fig. 7.
3.4 Theoretical studies
The density functional theory (DFT), especially the B3LYP method that not only produces reliable geometries and energies, but also requires less time and computer resources, has emerged as a very reliable and economical tool to predict the chemical and physical properties of novel energies materials.32,33 The molecular structure of DMA-BTO was shown in Fig. 8. The structure has been fully optimized using the density functional theory B3LYP method with the 6-311g(d,p) basis set by Gaussian 09 (ref. 34) software, which corresponds to the minimum energy points at the obtained molecular energy hypersurface (NImag = 0).3.5 Natural bond orbital (NBO) analysis
Natural bond orbital (NBO) analysis provides the significant method for studying intra- and intermolecular bonding and interaction among bonds and also provides a convenient basis for investigating charge transfer in molecular systems.35–37The second order Fock matrix was carried out to evaluate the donor (i)–acceptor (j) interactions in the NBO analysis35 for each donor (i) and acceptor (j), the stabilization energy E(2) associated with the delocalization i → j is estimated as
| E(2) = ΔEij = qiF(i,j)2/(εj − εi) | (7) |
Here, NBO analysis was performed on the BTO molecular at the B3LYP/6-311G(d,p) level in order to elucidate the intramolecular hybridization and delocalization of electron density within the molecule. The intramolecular interaction is formed by the orbital overlap between bonding (C–C), (C–N) and (C–C), (C–N) antibond orbital which results in intramolecular charge transfer (ICT) causing stabilization of the system. The intramolecular conjugate interactions of the BD N(5)–C(6) and BD* N(3)–N(4) orbital as a result the E(2) is 23.45 kJ mol−1. The most important interaction energy in this molecule is owing to electron donation from LP N(2) to the antibonding acceptors BD* N(3)–N(4) and BD* N(5)–C(6) resulting in stabilization energies of 42.76 and 58.39 kJ mol−1, respectively. The E(2) values and types of the transitions are shown in Table S10.†
3.6 Molecular electrostatic potential
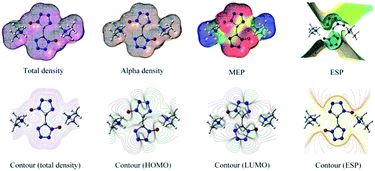
The molecular electrostatic potential (MEP) is a plot of electrostatic potential mapped on the constant electron density surface displaying the electrostatic potential distribution. MEP is very useful descriptor in understanding sites for electrophilic attack and nucleophilic reaction. The different values are expressed by the different colors, blue indicating regions of most positive electrostatic potential (preferred site for nucleophilic attack), red indicating regions of most negative electrostatic potential (preferred site for electrophilic attack), and green indicating regions of zero potential. In order to calculate reactive sites for electrophilic and nucleophilic attack for BTO, the MEP at the B3LYP/6-311G(d,p) level was mapped with the total electron density of the molecule. In Fig. 9, red represents the most negative potential and blue represents the most positive potential. In addition, the polarization effect is clearly visible. The isosurface of electron density for the molecular is 0.001 electron per bohr3. The colour range from −0.025 and 0.025 a.u. (red and blue). Molecular shape, size, and dipole moments of the molecule provide a visual method to understand the relative polarity.39 As can be seen from the MEP map of the molecule, the negative section mainly focuses on the bistetrazole ring, on the contrary, the positive section localized at the group of dimethylamine.3.7 Total density alpha density MEP ESP
Contour (total density), contour (total density), contour (HOMO), contour (LUMO) and contour (ESP) were shown in Fig. 9.The highest occupied molecular orbital (HOMO) and lowest unoccupied molecular orbital (LUMO) of DMA-BTO were shown in Fig. 10. The HOMO mainly acts as an electron donor and the LUMO chiefly acts as an electron acceptor.40,41 The energy gap between the HOMO (−0.2168 a.u.) and the LUMO (−0.0233 a.u.) of the molecule is about 0.1935 a.u, which illustrated the charge transfer interactions taking place within the molecule. Mulliken42 has derived the wavefunctions for the ground state and excited states of the complex and the charge distribution over the atoms thus produces a way of examining the proton transfer process. The charge distributions calculated by the Mulliken method43 for the equilibrium geometry of DMA-BTO were given in Table S11.†
4. Conclusions
The crystal of DMA-BTO, one of important intermediates of TKX-50, was prepared and characterized by X-ray single crystal diffraction, TG-DTA along with AKTS program and theoretical investigations. The results indicated that DMA-BTO could be easily formed in DMF and water through the precursor BTO. The thermal behaviour studies using DTA-TG at different heating rates showed that DMA-BTO has higher thermal decomposition temperature than 221 °C. For the storage and transferring, DMA-BTO was predicted to be safe below 113.24 °C and the time of safe zone is less than 21.2 h if a runaway reaction of DMA-BTO does happen. To conclude, this work would supply helpful information and make great progress on the production of high energy insensitive explosive TKX-50.Acknowledgements
We acknowledge the financial support from the Youth Innovation Fund of the North Chemical Industry Group (No. 3090041410054) and the Excellent Young Scholar Research Found of Beijing Institute of Technology of China (No. 3090012331542).Notes and references
- M. Gobel, B. H. Tchitchanov, J. S. Murray, P. Politzer and T. M. Klapotke, Nat. Chem., 2009, 1, 229 CrossRef PubMed.
- M. Gobel, K. Karaghiosoff, T. M. Klapötke, D. G. Piercey and J. Stierstorfer, J. Am. Chem. Soc., 2010, 32, 17216 CrossRef PubMed.
- H. Gao and J. M. Shreeve, Chem. Rev., 2011, 111, 7377 CrossRef CAS PubMed.
- J. Zhu, S. Jin, L. Wan, C. Zhang, L. Li, S. Chen and Q. Shu, Dalton Trans., 2016, 45, 3590 RSC.
- T. M. Klapötke and D. G. Piercey, Inorg. Chem., 2011, 50, 2732 CrossRef PubMed.
- V. Thottempudi and J. M. Shreeve, J. Am. Chem. Soc., 2011, 133, 19982 CrossRef CAS PubMed.
- T. M. Klapötke, D. G. Piercey and J. Stierstorfer, Chem.–Eur. J., 2011, 17, 13068 CrossRef PubMed.
- (a) S. Jin, Q. Shu, S. Chen and Y. Shi, Propellants, Explos., Pyrotech., 2007, 6, 468 CrossRef; (b) J. Zhu, S. Jin, Y. Yu, C. Zhang, L. Li, S. Chen and Q. Shu, Thermochim. Acta, 2016, 623, 58 CrossRef CAS.
- J. Zhang, L. Mitchell, D. A. Parrish and J. M. Shreeve, J. Am. Chem. Soc., 2015, 137, 10532 CrossRef CAS PubMed.
- (a) J. Zhu, S. Jin, Y. Yu, L. Wan, L. Li, S. Chen and Q. Shu, Z. Naturforsch., B: J. Chem. Sci., 2016, 71, 197 CAS; (b) Y. Yu, S. Jin, J. Zhu, L. Li, S. Chen and Q. Shu, Z. Naturforsch., B: J. Chem. Sci., 2016, 231, 491 CAS.
- (a) C. Qi, S. Li, Y. Li, Y. Wang, X. Zhao and S. Pang, Chemistry, 2012, 18, 16562 CrossRef CAS PubMed; (b) Q. Wu, L. Tan, Z. Hang, J. Wang, Z. Zhang and W. H. Zhu, RSC Adv., 2015, 5, 93607 RSC.
- N. Fischer, T. M. Klapotke, M. Reymann and J. Stierstorfer, Eur. J. Inorg. Chem., 2013, 12, 2167 CrossRef.
- N. Fischer, L. Gao, T. M. Klapötke and J. Stierstorfer, Polyhedron, 2013, 51, 201 CrossRef CAS.
- N. Fischer, D. Izsak, T. M. Klapötke, S. Rappengluck and J. Stierstorfer, Chem.–Eur. J., 2012, 18, 4051 CrossRef CAS PubMed.
- N. Fischer, D. Fischer, T. M. Klapötke, D. G. Piercey and J. Stierstorfer, J. Mater. Chem., 2012, 22, 20418 RSC.
- Z. Zhang, L. Yin and X. Yin, Crystals, 2016, 6, 21 CrossRef.
- Y. Shang, B. Jin and R. Peng, RSC Adv., 2016, 6, 48590 RSC.
- X. Wang, S. Jin, C. Zhang, L. Li, S. Chen and Q. Shu, Chin. J. Chem., 2015, 33, 1229 CrossRef CAS.
- Y. Yu, S. Chen, X. Li, J. Zhu, H. Liang, X. Zhang and Q. Shu, RSC Adv., 2016, 6, 20034 RSC.
- G. M. Sheldrick, shelxtl-plus (version 2008/4), Bruker Analytical X-ray Instruments Inc., Madison, WI, USA, 2008 Search PubMed.
- G. M. Sheldrick, Acta Crystallogr., Sect. A: Found. Crystallogr., 2008, 64, 112 CrossRef CAS PubMed.
- H. E. Kissinger, Anal. Chem., 1957, 29, 1702 CrossRef CAS.
- T. Ozawa, J. Therm. Anal. Calorim., 1970, 2, 301 CrossRef CAS.
- H. J. Borchardt and F. Daniels, J. Am. Chem. Soc., 1956, 79, 41 CrossRef.
- S. Vyazovkin, A. K. Burnham, J. M. Criado, L. A. Pérez-Maqueda, C. Popescu and N. Sbirrazzuoli, Thermochim. Acta, 2011, 520, 1 CrossRef CAS.
- AKTS AG, AKTS-thermokinetics software and AKTS-thermal safety software, http://www.akts.com Search PubMed.
- M. Maciejewski, Thermochim. Acta, 2000, 355, 145 CrossRef CAS.
- S. Weng, S. Liu, L. Tsai, T. F. Hsieh, C. Ma and C. Shu, J. Therm. Anal. Calorim., 2013, 113, 1603 CrossRef CAS.
- B. Roduit, M. Hartmann, P. Folly, A. Sarbach, P. Brodard and R. Baltensperger, J. Therm. Anal. Calorim., 2014, 117, 1017 CrossRef CAS.
- B. Roduit, Thermochim. Acta, 2002, 388, 377–387 CrossRef CAS.
- ASTM E698, American Society for Testing Materials, Standard test method for Arrhenius kinetic constants for thermally unstable materials, West Conshohocken, PA, USA, 2001 Search PubMed.
- L. Yang, P. Ravindran, P. Vajeeston and M. Tilset, RSC Adv., 2012, 2, 1618 RSC.
- F. Wang, G. Wang, H. Du, J. Zhang and X. Gong, J. Phys. Chem. A, 2011, 115, 13858 CrossRef CAS PubMed.
- M. J. Frisch, G. W. Trucks, H. B. Schlegel, G. E. Scuseria, M. A. Robb, J. R. Cheeseman, G. Scalmani, V. Barone, B. Mennucci, G. A. Petersson, H. Nakatsuji, M. Caricato, X. Li, H. P. Hratchian, A. F. Izmaylov, J. Bloino, G. Zheng, J. L. Sonnenberg, M. Hada, M. Ehara, K. Toyota, R. Fukuda, J. Hasegawa, M. Ishida, T. Nakajima, Y. Honda, O. Kitao, H. Nakai, T. Vreven, J. A. Montgomery Jr, J. E. Peralta, F. Ogliaro, M. Bearpark, J. J. Heyd, E. Brothers, K. N. Kudin, V. N. Staroverov, R. Kobayashi, J. Normand, K. Raghavachari, A. Rendell, J. C. Burant, S. S. Iyengar, J. Tomasi, M. Cossi, N. Rega, J. M. Millam, M. Klene, J. E. Knox, J. B. Cross, V. Bakken, C. Adamo, J. Jaramillo, R. Gomperts, R. E. Stratmann, O. Yazyev, A. J. Austin, R. Cammi, C. Pomelli, J. W. Ochterski, R. L. Martin, K. Morokuma, V. G. Zakrzewski, G. A. Voth, P. Salvador, J. J. Dannenberg, S. Dapprich, A. D. Daniels, O. Farkas, J. B. Foresman, J. V. Ortiz, J. Cioslowski and D. J. Fox, Gaussian, Inc., Wallingford CT, 2009.
- M. Szafran, A. Komasa and E. B. Adamska, J. Mol. Struct., 2007, 827, 101 CrossRef CAS.
- C. James, A. A. Raj, R. Rehunathan, I. H. Joe and V. S. Jayakumar, J. Raman Spectrosc., 2006, 379, 1381 CrossRef.
- J. Liu, Z. Chen and S. Yuan, J. Zhejiang Univ., Sci., B, 2005, 6, 584 CrossRef PubMed.
- S. Sebastin and N. Sundaraganesan, Spectrochim. Acta, Part A, 2010, 75, 941 CrossRef PubMed.
- I. Fleming, Frontier Orbitals and Organic Chemical Reactions, John Wiley and Sons, New York, 1976, p. 98 Search PubMed.
- K. S. Thanthiriwatte and K. M. Nalin de Silva, J. Mol. Struct.: THEOCHEM, 2002, 617, 169 CrossRef CAS.
- P. S. Liyange, R. M. de Silva and K. M. Nalin de Silva, J. Mol. Struct.: THEOCHEM, 2003, 639, 195 CrossRef.
- R. S. Mulliken, J. Am. Chem. Soc., 1952, 74, 811 CrossRef CAS.
- R. S. Mulliken, J. Chem. Phys., 1955, 23, 1833 CrossRef CAS.
Footnote |
| † Electronic supplementary information (ESI) available. CCDC 1408368 and 1532257. For ESI and crystallographic data in CIF or other electronic format see DOI: 10.1039/c7ra00908a |
| This journal is © The Royal Society of Chemistry 2017 |

