 Open Access Article
Creative Commons Attribution 3.0 Unported Licence
Selective and sensitive colorimetric determination of cobalt ions using Ag–Au bimetallic nanoparticles
Dong Xua,
Hong Chena,
Qinlu Lin*a,
Ziwei Lia,
Tao Yanga and
Zhiqin Yuan *b
*b
aNational Engineering Laboratory for Rice and By-products Further Processing, Central South University of Forestry & Technology, Changsha 410004, China. E-mail: LinQL0403@163.com; Tel: +86-731-8562-3240
bState Key Laboratory of Chemical Resource Engineering, Beijing University of Chemical Technology, Beijing 100029, China. E-mail: yuanzq@mail.buct.edu.cn; Tel: +86-10-64411957
First published on 14th March 2017
Abstract
Plasmonic nanoparticle-based colorimetric sensing has gained wide attention due to its advantages including rapidity, simplicity and expensive instrument-free characters. In the present study, Ag–Au bimetallic nanoparticles were proposed as novel optical probes to determine cobalt ion (Co2+) concentration. The sensing mechanism is based on the fact that Co2+ can react with ethylenediamine (en) and S2O32− to form (en)2CoS2O3+ on the nanoparticle surface, which can decrease the negative charge of the nanoparticle, reduce the repulsion between adjacent nanoparticles, and subsequently induce nanoparticle aggregation, was verified by dynamic light scattering. The effects of several parameters on the detection sensitivity, including the concentration of S2O32− and en, pH value and incubation time, were investigated. The assay demonstrated high selectivity toward Co2+ in the presence of K+, Cu2+, Pb2+, Ag+, Zn2+, Ba2+, Mn2+, Fe2+, Fe3+, Ni2+ and Hg2+. Under optimal conditions, the absorbance ratio of A600/A434 showed a linear relationship versus Co2+ concentration from 0 to 0.6 μM with a correlation coefficient (R2) of 0.980, and the detection limit was calculated to be 0.02 μM. The practical application of the proposed nanoprobes was evaluated with river and tap water samples.
1. Introduction
Plasmonic nanoparticle-based colorimetric methods for detecting analytes have gained growing interest because of their simplicity, low cost, rapid response and expensive instrument-free characters.1–4 Various analytes including metal ions,5,6 proteins,7 DNA,8,9 glucose,10 H2S11 could be determined through elaborately designed strategies with high sensitivity and selectivity. Monometallic nanoparticles, in particular gold nanoparticles and silver nanoparticles, are the two most selected materials for developing colorimetric assays due to their prominent characteristics. Both gold and silver nanoparticles possess high absorption and scattering coefficients, high optical stability without photobleaching and photoblinking.12,13 Gold nanoparticle is inert to oxidation, having stronger chemical stability and better biocompatibility. However, silver nanoparticles have the highest efficiency of absorption and scattering light compared to gold and copper materials. For example, the molar extinction coefficient of silver nanoparticles is 20-fold larger than that of gold nanoparticles in the same volume,14 and the molar extinction coefficient is closely related to sensor sensitivity. Recently, Ag–Au bimetallic nanoparticles (BNPs, e.g., Ag core–Au shell nanoparticles) have attracted increasing attentions because their specific optical and physical features, such as good catalytic capacity, surface-enhanced Raman scattering property.15 They also can integrate the merits of the Ag and Au materials, that is, high plasmonic property of Ag and the stability of Au.16 The bands of localized surface plasmonic resonance in the range of 400–550 nm can be conveniently tuned by varying their components while keeping the nanoparticle diameter constant.17 Correspondingly, the BNP solution color could also vary from yellow to brown, to red by changing the components. Thus, BNP-based probes can provide low detection background, well stability and high sensitivity in assays. Despite of wide applications of Ag–Au BNPs, the studies on using Ag–Au BNPs as a platform in colorimetric sensors are still very rare.Cobalt (Co2+) is normally recognized as an essential element for human body, which acts as the metallic component of vitamin B12 and some metal loprotease. However, exposure to its excess amount can lead to serious health diseases.18–20 For example, excess Co2+ could change the enzyme activities, cause oxidative stress and DNA damage.21,22 It can also bring about low blood pressure, paralysis and even tissue carcinogenesis.23 On the other side, the widespread applications of cobalt in industries and medical science increase its exposure risks. For example, cobalt is important for processing alloys with corrosion and heat resistance, strong magnetism and high-strength.18 Cobalt is widely utilized in pigments in the glass and ceramics,24 and lithium ion batteries.25 In clinic, hip replacements are usually made from cobalt,26,27 inevitably lifting serum cobalt levels of patients. Therefore, developing assays for detecting Co2+ is urgent. Up to now, atom absorption spectroscopy,28 fluorescent techniques29 and electrochemical methods30 were exploited for Co2+ determination. However, there are several shortcomings including time-consuming and complex sample preparation when using these techniques. In contrast, colorimetric methods with rapid response and simple preparation characters may benefit the development of Co2+ determination strategy.31,32 Thereby, colorimetric method based on plasmonic nanoparticle may be an alternate owing to its specific virtues. Zhang et al. reported a colorimetric method for Co2+ quantification with a detection limit of 3.0 × 10⁻⁷ M based on Co2+ induces aggregation of thioglycolic acid capped gold nanoparticles.33 In Sung's work, glutathione functionalized silver nanoparticles with the shapes of sphere, plate and rod as probes for Co2+ were investigated and it was found rod-type silver nanoparticles showed better selectivity.34 Yao et al. synthesized triazole-carboxyl bifunctionalized silver nanoparticles by a click reaction to detect Co2+ sensitively.35 Zhang et al. developed a label free colorimetric method for cobalt determination.36 Annadhasan et al. reported a green method to fabricate gold nanoparticles under sunlight irradiation by using N-cholyl-L-valine as the reducing and capping agent, which demonstrated high selectivity and sensitivity toward Co2+.37 Nevertheless, the development of new colorimetric methods for Co2+ sensing is still appealing.
Herein, we developed a label-free method for sensing Co2+ in aqueous solutions by using Ag–Au BNPs fabricated by one-pot synthesis. The sensing is due to Co2+ can trigger the formation of (en)2CoS2O3+ in the presence of thiosulfate (S2O32−) and ethylenediamine (en), which decreases the repulsion between adjacent nanoparticles and causes the aggregation. This proposed method exhibited high selectivity toward Co2+ over other metal ions because of the involvement of a series of specific chemical reactions. The practical application of this method was further validated by detecting Co2+ in tap and river water samples.
2. Experimental
2.1 Chemicals
Hydrogen tetrachloroaurate(III) trihydrate (HAuCl4·3H2O), silver nitrate (AgNO3), polyvinyl pyrrolidone (PVP, 25k MW), trisodium citrate (C6H5O7Na3·2H2O), ethylenediamine (en), sodium thiosulfate (Na2S2O3) and glycine were purchased from Sinopharm Chemical Reagent (China). Analytical grade chemicals including CoSO4·7H2O, KCl, CuSO4·5H2O, Pb(NO3)2, ZnCl2, BaCl2, MnSO4·H2O, FeSO4·7H2O, FeCl3, NiCl2·6H2O, and Hg(NO3)2 were obtained from Sigma Aldrich. Deionized water (18.2 MΩ cm) was obtained from a Millipore system (Billerica, USA). All glassware was cleaned with fresh aqua regia (HCl![[thin space (1/6-em)]](https://www.rsc.org/images/entities/char_2009.gif) :
:![[thin space (1/6-em)]](https://www.rsc.org/images/entities/char_2009.gif) HNO3 = 3
HNO3 = 3![[thin space (1/6-em)]](https://www.rsc.org/images/entities/char_2009.gif) :
:![[thin space (1/6-em)]](https://www.rsc.org/images/entities/char_2009.gif) 1) before use. Glycine–NaOH buffer solutions (0.1 M) with pH values ranging from 8.6 to 9.6 were prepared by glycine and NaOH and the pH values were measured with a benchtop Orion™ plus pH meter (Thermo-Fisher, USA).
1) before use. Glycine–NaOH buffer solutions (0.1 M) with pH values ranging from 8.6 to 9.6 were prepared by glycine and NaOH and the pH values were measured with a benchtop Orion™ plus pH meter (Thermo-Fisher, USA).
2.2 Characterization
The UV-vis absorption spectra of the nanoparticles were obtained with a UV-1800 spectrophotometer (Shimadzu, Japan). Transmission electron microscopy (TEM) images of nanoparticles were collected with a JEOL JEM-1230 transmission electron microscope under operation of 100 kV (Hitachi, Japan). Photographs of nanoparticle solution was obtained with iphone 5. Dynamic light scattering (DLS) and zeta potential measurements were performed with a Zetasizer Nano ZS analyzer (Malvern, U.K.). X-ray photoelectron spectroscopy (XPS) was obtained on K-alpha 1063 X-ray photoelectron spectrometer (Thermo Fisher Scientific, USA) with Al Kα radiation operated at 72 W (6 mA emission current, 12 kV) and a base pressure of 10−9 mbar. Elemental mapping analysis was performed in the STEM mode on a Tecnai G2 F20 field emission TEM (FEI, USA).2.3 One-pot synthesis of Ag–Au BNPs
Ag–Au BNPs were prepared according to the previous reported papers with slight modifications.17 In brief, 182 μL 0.1 M AgNO3 and 250 μL 24.28 mM (1% in weight) HAuCl4 solutions was added into 95.5 mL distilled water in a flask. The mixture was heated to boil in oil bath under constant stirring at 250 rpm. During reflux, 2 mL 1 wt% trisodium citrate was rapidly injected into the solution. Reflux of the solution for another 1 h was to insure the formation of colloid. During this process, the color of the solution would turn to yellow from colorless. After cooling, the colloid suspension was stored at 4 °C in refrigerator prior to use.2.4 Sensitivity and selectivity of Co2+ sensing
A high concentration stock solution of CoSO4 (0.1 M) was prepared and used to prepare standard solutions through a serial dilution. For Co2+ detection, 1000 μL the as prepared Ag–Au BNP suspension was first mixed with 710 μL 0.1 M glycine–NaOH buffers in 2 mL tube to make the ultimate solution pH value at 9.0. Then, 55 μL distilled water, 20 μL 0.05 M Na2S2O3 and 200 μL Co2+ solution with different concentrations were injected into the tube in sequence. Finally, after 2 min equilibration at room temperature, 15 μL 1% v/v en solution was added to each tube. The photos and UV-vis spectra of the solutions were recorded during the 20 min window. The following metal ions were used to evaluate the selectivity of the BNP sensing system: K+, Cu2+, Pb2+, Ag+, Zn2+, Ba2+, Mn2+, Fe2+, Fe3+, Ni2+ and Hg2+.2.5 Real sample analysis
Water samples obtained from Xiang River and tap water in campus were firstly centrifuged (12![[thin space (1/6-em)]](https://www.rsc.org/images/entities/char_2009.gif) 000 rpm, 30 min) and then filtered through a 0.2 μm membrane to remove large suspended particles. The Co2+ detection procedure is the same as sensitivity test. 1000 μL of the as prepared Ag–Au BNP suspension was mixed with 710 μL 0.1 M glycine–NaOH buffers, 55 μL distilled water, 20 μL 0.05 M Na2S2O3 and 200 μL of the tested samples sequentially. Finally, after 2 min equilibration at room temperature, 15 μL 1% v/v en solution was added to each tube. The photos and UV-vis spectrum of the solutions were recorded after 20 min.
000 rpm, 30 min) and then filtered through a 0.2 μm membrane to remove large suspended particles. The Co2+ detection procedure is the same as sensitivity test. 1000 μL of the as prepared Ag–Au BNP suspension was mixed with 710 μL 0.1 M glycine–NaOH buffers, 55 μL distilled water, 20 μL 0.05 M Na2S2O3 and 200 μL of the tested samples sequentially. Finally, after 2 min equilibration at room temperature, 15 μL 1% v/v en solution was added to each tube. The photos and UV-vis spectrum of the solutions were recorded after 20 min.
3. Results and discussions
3.1 Principle of Co2+ detection
We prepared Ag–Au BNPs by a one-pot synthetic procedure.38,39 According to the literature,17 the BNPs have Ag core–Au shell structures, which endows them high stability. The molar ratio of Ag![[thin space (1/6-em)]](https://www.rsc.org/images/entities/char_2009.gif) :
:![[thin space (1/6-em)]](https://www.rsc.org/images/entities/char_2009.gif) Au was finally set to be 3
Au was finally set to be 3![[thin space (1/6-em)]](https://www.rsc.org/images/entities/char_2009.gif) :
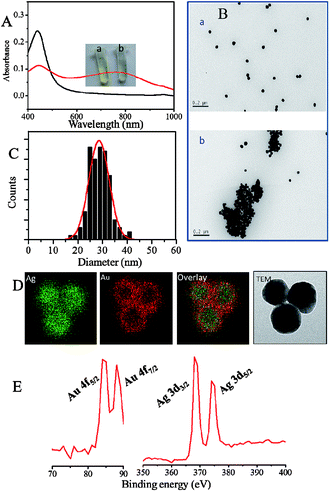
:![[thin space (1/6-em)]](https://www.rsc.org/images/entities/char_2009.gif) 1, since the compromise was made between the strong optical properties of nanoparticles relating to the detection signals and the well chemical stability associating with convenient storage. The obtained Ag–Au BNP was characterized by camera, UV-vis spectra, TEM and XPS, as displayed in Fig. 1. The color of as-prepared nanoparticle solution was yellow, whose UV-vis spectrum peak was located at 434 nm. In contrast, the UV-vis peak of gold nanoparticle (AuNP) and silver nanoparticle (AgNP) with the same diameter are at 532 nm and 393 nm according to the Mie simulations, respectively.40 The statistical size distribution of 132 nanoparticles was displayed in Fig. 1C. TEM results showed that these nanoparticles are spherical and monodisperse with a size of 28.6 ± 4.1 nm. Distribution of Ag and Au elements in BNPs proved that the nanoparticles consist of a predominant Ag core and a Au rich shell, which is consistent with the reported structure.17 As shown in Fig. 1E, the valence of both Ag and Au in BNP XPS was zero due to the overdose of the reducing agent. After 1.2 μM Co2+ was added, the color of the solution turned to pale green from yellow due to the obvious aggregation of Ag–Au BNPs with the presence of S2O32− and en (Fig. 1A(a) and (b)). The absorbance below 500 nm decreased, while that above 500 nm increased. The color alternation in our assay is different from that of pure AuNPs or AgNPs systems, in which AuNP solution would become purple or blue from red2,3 and AgNP solution turns pale red from yellow.2,41 We found that the value of A600/A434 could effectively reflect the ratio of the dispersed to the aggregated Ag–Au BNPs, and thus was finally used to evaluate Co2+ in our study.
1, since the compromise was made between the strong optical properties of nanoparticles relating to the detection signals and the well chemical stability associating with convenient storage. The obtained Ag–Au BNP was characterized by camera, UV-vis spectra, TEM and XPS, as displayed in Fig. 1. The color of as-prepared nanoparticle solution was yellow, whose UV-vis spectrum peak was located at 434 nm. In contrast, the UV-vis peak of gold nanoparticle (AuNP) and silver nanoparticle (AgNP) with the same diameter are at 532 nm and 393 nm according to the Mie simulations, respectively.40 The statistical size distribution of 132 nanoparticles was displayed in Fig. 1C. TEM results showed that these nanoparticles are spherical and monodisperse with a size of 28.6 ± 4.1 nm. Distribution of Ag and Au elements in BNPs proved that the nanoparticles consist of a predominant Ag core and a Au rich shell, which is consistent with the reported structure.17 As shown in Fig. 1E, the valence of both Ag and Au in BNP XPS was zero due to the overdose of the reducing agent. After 1.2 μM Co2+ was added, the color of the solution turned to pale green from yellow due to the obvious aggregation of Ag–Au BNPs with the presence of S2O32− and en (Fig. 1A(a) and (b)). The absorbance below 500 nm decreased, while that above 500 nm increased. The color alternation in our assay is different from that of pure AuNPs or AgNPs systems, in which AuNP solution would become purple or blue from red2,3 and AgNP solution turns pale red from yellow.2,41 We found that the value of A600/A434 could effectively reflect the ratio of the dispersed to the aggregated Ag–Au BNPs, and thus was finally used to evaluate Co2+ in our study.
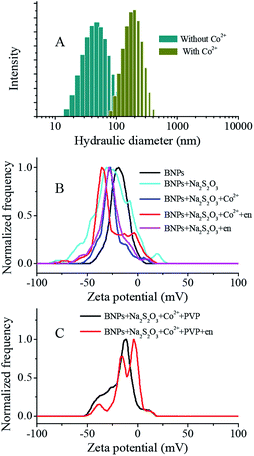
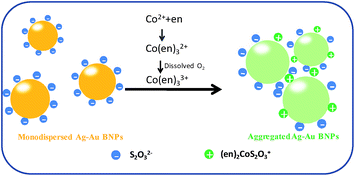
In order to further study the mechanism, we measured the hydraulic diameter and zeta potential of Ag–Au BNPs under different solution conditions, as shown in Fig. 2. As expected, an obvious increase on hydraulic diameter of Ag–Au BNP (from 50.7 nm to 190.1 nm) was observed, indicating the color change of solution can be assigned to the aggregation of Ag–Au BNPs. With the addition of chemicals, the surface potential of Ag–Au BNPs also changed. When S2O32− was mixed with Ag–Au BNP solution, S2O32− was immediately and strongly absorbed onto nanoparticle surface due to the strong affinity between sulfur and gold.42 The zeta potential of Ag–Au BNP changed to −26.9 mV from −18 mV. S2O32− coated Ag–Au BNPs are very stable due to the strong electrostatic repulsions between negatively charged nanoparticles even at high ionic strength. These nanoparticles do not aggregate with the presence of 0.0075% en and their zeta potential (−26.1 mV) was unchanged, partially because en does not react with S2O32− directly. Upon the addition of Co2+, Co2+ could quickly react with en to form Co(en)32+ first and then Co(en)32+ was readily oxidized to Co(en)33+ by the dissolved oxygen in water.43 Afterwards, Co(en)33+ would attack S2O32− on nanoparticle surface to form positively-charged (en)2CoS2O3+.44 As a result, the formed (en)2CoS2O3+ decreased the negative charge of nanoparticle and triggered the aggregation of nanoparticle. However, the measured zeta potential become more negative (−31.6 mV) after the formation of aggregates, which can not conclude the surface charge of single nanoparticles was reduced. To bypass the problem, 0.02 wt% PVP, a polymer that is widely applied to stabilize the nanoparticle, was added to the solution to prevent nanoparticle aggregation after adding Co2+. PVP stabilized nanoparticles have a potential of −13.8 mV, but after the addition of Co2+, an increased potential around −4.0 mV emerged (Fig. 2C). This result confirmed that Co2+ indeed reduced the negative charge and caused the aggregation of Ag–Au BNPs. Scheme 1 depicted the mechanism of Co2+ detection.
3.2 Establishment of the colorimetric sensing method for Co2+
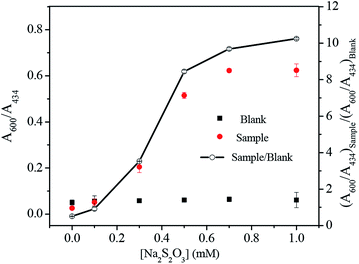
As mentioned above, the Co2+ induced nanoparticle aggregation was attributed to the formation of (en)2CoS2O3+ at the surface of Ag–Au nanoparticles. Since this reaction needs the participation of several reagents, a systematic investigation was performed to optimize these parameters by monitoring the ratio of absorbance ratio (A600/A434)sample/(A600/A434)blank changes at 600 and 434 nm, including the concentration of S2O32− and en, solution pH value and the incubation time. During this study, the concentration of Co2+ of 1 μM was fixed.The content of S2O32− in the range of 0–1.0 mM was investigated when en was fixed at 0.0075% and the pH value at 9.2 in the presence (sample) and absence (blank) of Co2+, as illustrated in Fig. 3. With the increasing S2O32− concentration, (A600/A434)blank remained unchanged, but the values of (A600/A434)sample and (A600/A434)sample/(A600/A434)bank increased gradually and reached to the top above 0.5 mM. The possible explanation is that, at low S2O32− concentration, the surface of nanoparticle was not completely coated by S2O32− and thus there was no enough sites on nanoparticle for Co(en)33+ combination. While at high S2O32− concentration (>0.5 mM), the surface of nanoparticle is totally occupied and free S2O32− exists in solution. We suppose Co(en)33+ tends to react with S2O32− at particle surface probably due to the strong electrostatic attraction between Co(en)33+ and the high negatively charged surface. Consequently, 0.5 mM S2O32− was chosen for the assay.
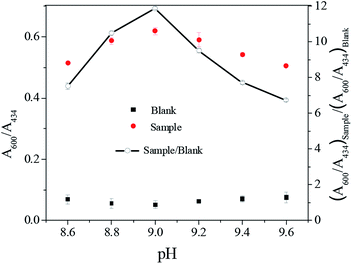
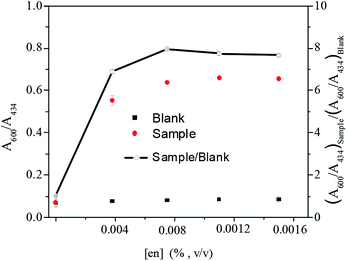
It is well-known that solution pH could influence the interactions of nanoparticle with capping molecules, and thus alter nanoparticle stability, sensitivity and selectivity of the assay. We investigated the effect of solution pH in the range of 8.6–9.6. As shown in Fig. 4, (A600/A434)sample/(A600/A434)blank reached the maximum value at pH 9.0. It is possible because low pH could cause decomposition of S2O32−, since its stability is proportional to pH. On the other hand, protonated en can hinder the formation of (en)2CoS2O3+. Conversely, extremely high pH may decrease the stability of nanoparticles via decreasing the surface repulsion and reduce oxidizing capacity of dissolved O2 on Co2+. Therefore, pH 9.0 was finally opted for the assay. Similarly, as demonstrated in Fig. 5, the optimal en concentration was determined to be 0.0075% (v/v).
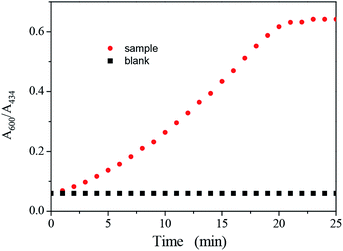
The incubation time is a key point for the colorimetric assays. The relationship between the ratio of A600/A434 and incubation time was obtained by recording the UV-vis spectra of Ag–Au nanoparticle solution after the addition of 1 μM Co2+, as shown in Fig. 6. It can be seen that (A600/A434)sample increased with the increasing incubation time, and reached a flatform after 20 min. The incubation time of 20 min in Co2+ assays was selected.
3.3 Co2+ sensing in aqueous media
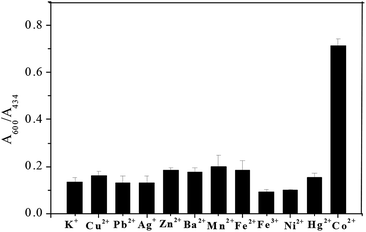
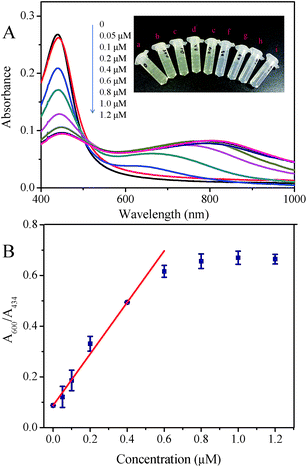
Selectivity of sensing methods is very important for its practical applications. In this study, the ratio of A600/A434 of Ag–Au nanoparticle solution upon addition of various metal ions including K+, Cu2+, Pb2+, Ag+, Zn2+, Ba2+, Mn2+, Fe2+, Fe3+, Ni2+ and Hg2+ under optimal conditions were measured to investigate whether the aggregation induced by Co2+ is specific. As manifested in Fig. 7, none of these metal ions (K+, Pb2+, Ag+, Zn2+, Ba2+, Mn2+, Fe2+, Fe3+, Ni2+, Hg2+: 100 μM; Cu2+: 5 μM) can induce comparable aggregation of Ag–Au nanoparticle as 1 μM Co2+ did. Such a high selectivity toward Co2+ of this method might be ascribed to the specific chemical reactions in Co2+, en and S2O32− system. First, Co2+ can react with en to generate chelating complex Co(en)32+; second, the complex with low Gibbs free energy can be oxidized into Co(en)33+ by dissolved oxygen; third, by reacting with S2O32−, Co(en)33+ could effectively reduce the negative charge on gold surface and lead to nanoparticle assembly. Despite of the formation of other metal–en complex, the lacking valence conversion or low reactivity to S2O32− lead to different results upon adding other metal ions. Thus, our system showed excellent selectivity toward Co2+.For the sensitivity evaluation, absorption spectra of Ag–Au nanoparticle solution were recorded after adding Co2+ with different concentrations (0, 0.05, 0.1, 0.2, 0.4, 0.6, 0.8, 1.0 and 1.2 μM). Upon increasing Co2+ concentration, the absorbance at 434 nm decreased, while that of new generated peaks in the range of 600–850 nm increased. The appearance of absorption shifted probably due to the occurrence of fusion between aggregated nanoparticles, which is confirmed by TEM results. The corresponding photographs of solution changed from yellow to light yellow, and finally pale green. As can be seen from Fig. 8, the ratio of A600/A434 of Ag–Au nanoparticle solution increased gradually upon increasing Co2+ concentration, and a typtical S-shaped curve is acquired. At 0.6 μM, the curve has nearly reached the plateau, which is lower than that tested by gold nanoparticle.36 A linear relationship was obtained with Co2+ in the range from 0 to 0.6 μM and was easily described by the linear equation with a correlation coefficient (R2) of 0.980: y = 0.085 + 1.055x, where y and x are the ratio of A600/A434 and Co2+ concentration, respectively. The limit of detection toward Co2+ of our assay was calculated to be 0.02 μM (3σ), which is lower than those reported colorimetric methods.33–36 Taken together, we could conclude that Ag–Au nanoparticle could be capable probes for Co2+ sensing.
3.4 Quantification of Co2+ in real samples
To investigate the potential application of the designed system in real samples, we tested tap and river water samples with spiked Co2+. The water samples did not induce the color change of Ag–Au nanoparticle solution without extra Co2+. The atomic absorption spectrum analysis demonstrated that the Co2+ content is below the detection limit of our method. Further, spike-recoveries tests showed that the recoveries for 0.4 μM Co2+ in tap water and 0.3 μM in river water were 102% and 106%, respectively. These results suggest the accuracy of the proposed method and its practicability for Co2+ detection in environmental samples.4. Conclusions
In this study, a simple and selective colorimetric method of Co2+ detection based on the aggregation of Ag–Au BNPs was developed. These BNPs used in this methods guarantee the high chemical stability and optical signals. Based on the special reactions in Co2+, en and S2O32− system, this assay can achieve the Co2+ determination with the presence 100-fold other ions such as K+, Pb2+, Ag+, Zn2+, Ba2+, Mn2+, Fe2+, Fe3+, Ni2+ and Hg2+ and 5-fold Cu2+. This method has a low LOD of 0.02 μM with a linear range in 0–0.6 μM. The rapid response within 20 min makes the assay capable of real-time and on-site Co2+ sensing applications. Our assay also showed effective applications in the real water sample analysis. New avenues for the design of bimetallic sensors for other analytes based on a similar strategy might be opened up in the analytical and related fields by preparing BNP with different sizes and compositions.Acknowledgements
This work was supported by funding from the National Natural Science Foundation of China (21505162, 21605003, 31571874), the Grain-Oil Process and Quality Control 2011 Collaborative and Innovative Grant from Hunan province, the China Postdoctoral Science Foundation (2016M600899), and the Fundamental Research Funds for the Central Universities (BUCTRC201619, ZY1625).References
- S. Zeng, K.-T. Yong, I. Roy, X.-Q. Dinh, X. Yu and F. Luan, Plasmonics, 2011, 6, 491–506 CrossRef CAS.
- D. Vilela, M. C. González and A. Escarpa, Anal. Chim. Acta, 2012, 751, 24–43 CrossRef CAS PubMed.
- W. Zhao, M. A. Brook and Y. Li, ChemBioChem, 2008, 9, 2363–2371 CrossRef CAS PubMed.
- Z. Yuan, C. C. Hu, H. T. Chang and C. Lu, Analyst, 2016, 141, 1611–1626 RSC.
- G. Sener, L. Uzun and A. Denizli, Anal. Chem., 2013, 86, 514–520 CrossRef PubMed.
- Z. Weng, H. Wang, J. Vongsvivut, R. Li, A. M. Glushenkov, J. He, Y. Chen, C. J. Barrow and W. Yang, Anal. Chim. Acta, 2013, 803, 128–134 CrossRef CAS PubMed.
- T.-S. Lai, T.-C. Chang and S.-C. Wang, Sens. Actuators, B, 2017, 239, 9–16 CrossRef CAS.
- M. Mancuso, L. Jiang, E. Cesarman and D. Erickson, Nanoscale, 2013, 5, 1678–1686 RSC.
- L. Guo, Y. Xu, A. R. Ferhan, G. Chen and D.-H. Kim, J. Am. Chem. Soc., 2013, 135, 12338–12345 CrossRef CAS PubMed.
- Y. Jiang, H. Zhao, Y. Lin, N. Zhu, Y. Ma and L. Mao, Angew. Chem., Int. Ed., 2010, 122, 4910–4914 CrossRef.
- Z. Yuan, F. Lu, M. Peng, C. W. Wang, Y. T. Tseng, Y. Du, N. Cai, C. W. Lien, H. T. Chang and Y. He, Anal. Chem., 2015, 87, 7267–7273 CrossRef CAS PubMed.
- S. Palomba, M. Danckwerts and L. Novotny, J. Opt. A: Pure Appl. Opt., 2009, 11, 733–736 CrossRef.
- A. M. Schrand, L. K. Braydichstolle, J. J. Schlager, L. Dai and S. M. Hussain, Nanotechnology, 2008, 19, 1694–1706 CrossRef PubMed.
- J.-S. Lee, A. K. Lytton-Jean, S. J. Hurst and C. A. Mirkin, Nano Lett., 2007, 7, 2112–2115 CrossRef CAS PubMed.
- B. W. Boote, H. Byun and J. H. Kim, J. Nanosci. Nanotechnol., 2014, 14, 1563–1577 CrossRef CAS PubMed.
- S. W. Verbruggen, M. Keulemans, J. A. Martens and S. Lenaerts, J. Phys. Chem. C, 2013, 117, 19142–19145 CAS.
- M. A. Uppal, M. B. Ewing and I. P. Parkin, Eur. J. Inorg. Chem., 2011, 2011, 4534–4544 CrossRef CAS.
- R. Lauwerys and D. Lison, Sci. Total Environ., 1994, 150, 1–6 CrossRef CAS PubMed.
- S. Mahey, R. Kumar, R. Arora, J. Mahajan, S. Arora, R. Bhardwaj and A. K. Thukral, SpringerPlus, 2016, 5, 930 CrossRef PubMed.
- P. J. Santander, Y. Kajiwara, H. J. Williams and A. I. Scott, Bioorg. Med. Chem., 2006, 14, 724–731 CrossRef CAS PubMed.
- L. Begovic, S. Mlinaric, J. A. Dunic, Z. Katanic, Z. Loncaric, H. Lepedus and V. Cesar, Aquat. Toxicol., 2016, 175, 117–126 CrossRef CAS PubMed.
- K. Al-Habsi, E. H. Johnson, I. T. Kadim, A. Srikandakumar, K. Annamalai, R. Al-Busaidy and O. Mahgoub, Vet. J., 2007, 173, 131–137 CrossRef CAS PubMed.
- D. Galaris and A. Evangelou, Crit. Rev. Oncol. Hematol., 2002, 42, 93–103 CrossRef PubMed.
- M. Gaudon, L. Robertson, E. Lataste, M. Duttine, M. Ménétrier and A. Demourgues, Ceram. Int., 2014, 40, 5201–5207 CrossRef CAS.
- A. K. Mondal, H. Liu, Z.-F. Li and G. Wang, Electrochim. Acta, 2016, 190, 346–353 CrossRef CAS.
- X. Mao, A. A. Wong and R. W. Crawford, Med. J. Aust., 2011, 194, 649–651 Search PubMed.
- D. L. Back, D. A. Young and A. J. Shimmin, Clin. Orthop. Relat. Res., 2005, 438, 177–181 CrossRef PubMed.
- S. Cadore, R. D. Goi and N. Baccan, J. Braz. Chem. Soc., 2005, 16, 957–962 CrossRef CAS.
- S. H. Mashraqui, M. Chandiramani, R. Betkar and K. Poonia, Tetrahedron Lett., 2010, 51, 1306–1308 CrossRef CAS.
- I. M. Isa, S. N. A. Dahlan, N. Hashim, M. Ahmad and S. A. Ghani, Int. J. Electrochem. Sci., 2012, 7, 7797–7808 CAS.
- Y. Li, J. Wu, X. Jin, J. Wang, S. Han, W. Wu, J. Xu, W. Liu, X. Yao and Y. Tang, Dalton Trans., 2014, 43, 1881–1887 RSC.
- J. R. Zhou, D. P. Liu, Y. He, X. J. Kong, Z. M. Zhang, Y. P. Ren, L. S. Long, R. B. Huang and L. S. Zheng, Dalton Trans., 2014, 43, 11579–11586 RSC.
- F. Zhang, L. Zeng, Y. Zhang, H. Wang and A. Wu, Nanoscale, 2011, 3, 2150–2154 RSC.
- H. K. Sung, S. Y. Oh, C. Park and Y. Kim, Langmuir, 2013, 29, 8978–8982 CrossRef CAS PubMed.
- Y. Yao, D. Tian and H. Li, ACS Appl. Mater. Interfaces, 2010, 2, 684–690 CAS.
- Z. Zhang, J. Zhang, T. Lou, D. Pan, L. Chen, C. Qu and Z. Chen, Analyst, 2011, 137, 400–405 RSC.
- M. Annadhasan, J. Kasthuri and N. Rajendiran, RSC Adv., 2015, 5, 11458–11468 RSC.
- B. Rodríguez-González, A. Burrows, M. Watanabe, C. J. Kiely and L. M. L. Marzán, J. Mater. Chem., 2005, 15, 1755–1759 RSC.
- J. Yang, J. Y. Lee and H.-P. Too, J. Phys. Chem. B, 2005, 109, 19208–19212 CrossRef CAS PubMed.
- C. F. Bohren and D. R. Huffman, in Absorption and Scattering of Light by Small Particles, Wiley, 1998 Search PubMed.
- H. Wei, C. Chen, B. Han and E. Wang, Anal. Chem., 2008, 80, 7051–7055 CrossRef CAS PubMed.
- Y. Y. Chen, H. T. Chang, S. Yenchun, H. Yulun, C. Chengkang and C. C. Huang, Anal. Chem., 2009, 81, 9433–9439 CrossRef CAS PubMed.
- J. Work and J. P. McReynolds, Inorg. Synth., 1946, 2, 221–222 CrossRef.
- A. Murdock, T. Tyree, W. Otterbein, L. Kinney, M. Carreras, J. N. Cooper and R. Elder, Inorg. Chem., 1985, 24, 3674–3679 CrossRef CAS.
| This journal is © The Royal Society of Chemistry 2017 |

