 Open Access Article
Simultaneous determination of parabens and inorganic anions in cosmetics by a two-dimensional ultrahigh-performance liquid chromatography-ion chromatography valve-switching method
Feng-Lian Wanga,
Yong-Gang Zhaoab,
Nadeem Muhammada,
Shu-Chao Wuc and
Yan Zhu *a
*a
aDepartment of Chemistry, Xixi Campus, Zhejiang University, Hangzhou 310028, Zhejiang, China. E-mail: zhuyan@zju.edu.cn; Fax: +86 571 88823446
bKey Laboratory of Health Risk Appraisal for Trace Toxic Chemicals of Zhejiang Province, Ningbo Municipal Center for Disease Control and Prevention, Ningbo, Zhejiang 315010, China
cZhejiang Institute of Geology and Mineral Resources, Hangzhou 310007, China
First published on 27th June 2017
Abstract
A rapid and simple approach involving two-dimensional ultrahigh-performance liquid chromatography (UHPLC) combined with ion chromatography (IC) through valve-switching was developed to determine parabens and inorganic anions in cosmetics simultaneously. Compared with a conventional IC column-switching technique, the proposed method required UHPLC coupled with IC via valve-switching without refreshing the pretreatment column. In this chromatographic system, a mobile phase with 60% methanol and 40% deionized water was used to simultaneously separate parabens, namely, methylparaben (MP), ethylparaben (EP), propylparaben (PP), and butylparaben (BP), and to eliminate the matrix, and KOH eluent (20 mmol L−1) was utilized to separate inorganic anions, such as nitrite, sulfite, sulfate, and nitrate. Organic compound analysis, and inorganic anion pretreatment and analysis were simultaneously performed with a single injection. Under optimized conditions, matrix–calibration curves were examined by preparing and analyzing different concentrations of mixture standard solutions containing parabens and inorganic anions. Linearity was between 0.9994 and 0.9999. The limits of detection ranged from 8.0 to 80 μg L−1. Satisfactory recoveries of cosmetic samples were obtained between 93.9% and 106.2% by adding three representative standard solutions. The proposed method can be applied to routine analysis, as indicated by the validated linearity, accuracy, and precision and potential application on the analysis of MP, EP, PP, BP, nitrite, sulfite, sulfate and nitrate in eight commercial samples.
1. Introduction
Cosmetics are commercially available products that can protect human skin from ultraviolet (UV) radiation and improve skin appearance because of their antioxygenation effects.1 These products are utilized by numerous individuals every day, and demands for cosmetics have increased. Cosmetics are commonly supplemented with effective antibacterial and antifungal reagents to increase their shelf-life.2 Parabens or esters of 4-hydroxybenzoic acid with slight differences in the ester group, including methylparaben (MP), ethylparaben (EP), propylparaben (PP), and butylparaben (BP), and inorganic anions, including nitrite and sulfite, are preservatives commonly used in cosmetic industries for over half a century.3,4 In normal individual skin, parabens are rapidly absorbed without causing irritation and sensitization in the areas of the skin. Unfortunately, the genotoxicity testing of parabens is unacceptable because of negative results. Compounds containing parabens may cause contact dermatitis and disruption in the endocrine system.5 Nitrite can be converted into carcinogenic nitrosamines that pose a severe risk to human health.6 Sulfite was utilized to manufacture cosmetics to make them have an inhibitory effect on melanogenesis.7 But sulfite can split vitamin B1 into two products, which have chronic toxicity.8 Nitrite and sulfite added in cosmetics can be slowly oxidated to nitrate and sulfate with time increasing. Therefore, a simple, rapid, and sensitive method should be developed for the simultaneous monitoring of MP, EP, PP, BP, nitrite, sulfite, nitrate and sulfate contents in cosmetics and used for hazardous studies and cosmetic quality identification.The development of analytical methods for parabens and inorganic anions in various matrices has been comprehensively described. For instance, high-performance liquid chromatography (HPLC) coupled with UV detection9 and mass spectrometry (MS),10 and gas chromatography (GC) coupled with MS are commonly utilized to analyze parabens.10,11 Ion chromatography (IC), which is proposed by Small in 1975,12,13 is applied to determine inorganic anions. These methods can accurately identify parabens and inorganic anions, but these approaches are complex and time-consuming because of their manual operations and utilization of different analytical instruments. In simultaneous organic compound and inorganic anion determination, samples with an organic matrix can damage IC columns and yield inaccurate results. Thus, organic compounds should be separated from inorganic anions before analysis is performed. A simple online pretreatment column-switching method with a carbon solid-phase extraction column as a pretreatment column has been proposed to determine iodide and thiocyanate in powdered milk and infant formula through IC.14 Zhong15 also designed single online pretreatment column-switching method by using polystyrene–divinylbenzene–carbon nanotube column to identify trace anions in different concentrated organic matrices through IC. In previous studies, pretreatment columns should be rinsed to achieve an equilibrium state, and an organic matrix should be eluted to generate waste products. As such, these approaches are time-consuming and cannot simultaneously determine organic compounds and inorganic anions. Therefore, we experience new challenges on the development of online pretreatment methods without the need for pretreatment column rinsing to separate inorganic anions from organic compounds and to detect organic compounds and inorganic anions simultaneously. To overcome these challenges, we propose a convenient and rapid two-dimensional ultrahigh-performance liquid chromatography (UHPLC-) IC coupling system to determine parabens and inorganic anions.
In this work, a simple sample pretreatment method combined with a two-dimensional UHPLC-IC valve-switching system was established to identify parabens and inorganic anions in cosmetics simultaneously. Four operating steps were involved in the proposed system. First, a sample was loaded on the sample loop of the system. Second, the sample was delivered from the sample loop into a C18 column via a mobile phase. Ions were eluted, but organic compounds were continually retained on the C18 column in the first 2 min. Third, a concentrator column was switched in line with the C18 column, and the ions were captured by the concentrator column. Subsequently, this system was switched back to its initial state, and the parabens and inorganic anions were simultaneously separated and determined. Several parameters, such as valve II switching time and formaldehyde content in standard solutions, which affect the recovery efficiency and relative standard deviations (RSDs) of parabens and inorganic anions, were assessed and optimized in a laboratory experiment. Thus, the proposed method provided a convenient, fast, sensitive, and practical approach for the simultaneous analysis of parabens and inorganic anions in cosmetics.
2. Experimental
2.1. Reagents and materials
MP, EP, PP, BP, methanol and formaldehyde solutions (36%) were purchased from Aladdin Bio-Chem Technology Co. Ltd. (Shanghai, China). Sodium nitrite, sodium sulfite, sodium sulfate, and sodium nitrate were obtained from Kelong Chemical Reagent Factory (Chengdu, China). Methanol was of HPLC grade, and other chemicals were of analytical grade. Water was purified by using a Milli-Q system (Millipore, Bedford, MA, USA) with a resistivity of 18.2 MΩ cm. Cosmetics, such as emulsion and toner, were purchased from a local Wal-Mart store in Hangzhou, China.2.2. Equipment
The ultrasonic constant temperature cleaning instrument SBL-5DTS (Ningbo, China) was used during the extraction procedure. The centrifugation and precipitation in the sample pretreatment process was performed with a Lab LD5-10B centrifuge (Beijing, China). All chromatographic separations were carried out using a Thermo Fisher Scientific 2100 ion chromatography system (ICS) instrument (Thermo Fisher Scientific, USA) and an UltiMate 3000 UHPLC instrument (Thermo Fisher Scientific, USA). The Thermo Fisher Scientific 2100 ICS consisted of a KOH eluent generator, ten-port valve, column oven, and DS6 conductivity detector. The Thermo Fisher Scientific UltiMate 3000 UHPLC was composed of a RS quaternary gradient pump, a RS autosampler, a RS thermal column compartment, and a UV-vis variable wavelength detector. An LC-9A binary pump (Shimadzu Corporation, Tokyo, Japan) was utilized to provide deionized water to ASRS 300 4 mm suppressor (Thermo Fisher Scientific, USA).2.3. Sample pretreatment procedure
Exactly 0.1 g cosmetic sample was transferred to a 10 mL polytetrafluoroethylene tube, and 5.0 mL methanol and 5.0 mL deionized water were added into the tube. Subsequently, the mixture was immediately subjected to ultrasound for 10 min and centrifuged at 5000 × g for 10 min. The supernatant of the elution was filtered through a 0.22 μm membrane filter prior to its injection into the two-dimensional UHPLC-IC valve-switching system.2.4. Experimental procedure
The chromatographic separation was performed on an UltiMate UHPLC XB-C18 column (100 mm × 2.1 mm i.d., 1.8 μm) using methanol/water (60![[thin space (1/6-em)]](https://www.rsc.org/images/entities/char_2009.gif) :
:![[thin space (1/6-em)]](https://www.rsc.org/images/entities/char_2009.gif) 40, v/v) as the optimum mobile phase at a flow velocity of 0.2 mL min−1 and on a Thermo Fisher IonPac AS11-HC column (250 mm × 4 mm i.d., 5 μm) preceded an IonPac AG11-HC guard column (250 mm × 4 mm i.d., 5 μm) by using 20 mmol L−1 KOH as the eluent at a flow rate of 1.0 mL min−1. The method was completed within four steps as follows: (i) the sample was loaded onto the sample loop via manual injection. (ii) The sample was delivered from the sample loop into the separation column, and then the inorganic anions were separated from the organic compounds. (iii) The concentrator column was placed in line with the separation column, and the anions were captured on the concentrator column. (iv) The concentrator column was switched in line with the guard column, and the organic compounds and inorganic anions were simultaneously determined. The measurements were performed using a 20.0 μL sample loop. The quaternary pump was used to supply not only the mobile phase for organic compounds but also the pretreatment solution for inorganic anions. An UltiMate UHPLC XB-C18 column was utilized for the separation of the inorganic anions from parabens. An IonPac AG19 guard column (50 mm × 4 mm i.d., 5 μm) was used as the concentrator column to concentrate anions. The material in the AG19 column is microporous polyvinylbenzyl ammonium polymer cross-linked with divinylbenzene. Chromeleon 7.2 software (Thermo Fisher Scientific Waltham, MA, USA) was utilized to acquire and integrate the data on a Dell computer. This software could control the switching time of valve II precisely and automatically to optimize the repeatability of the experimental results. Polyether ether ketone and stainless steel tubes were used to connect all chromatographic hardware and kept as short as possible. The column temperature was kept at 30 °C to increase the retention time reproducibility. The suppressor current was set at 50 mA. The conductivity detector was thermostated at 35 °C.
40, v/v) as the optimum mobile phase at a flow velocity of 0.2 mL min−1 and on a Thermo Fisher IonPac AS11-HC column (250 mm × 4 mm i.d., 5 μm) preceded an IonPac AG11-HC guard column (250 mm × 4 mm i.d., 5 μm) by using 20 mmol L−1 KOH as the eluent at a flow rate of 1.0 mL min−1. The method was completed within four steps as follows: (i) the sample was loaded onto the sample loop via manual injection. (ii) The sample was delivered from the sample loop into the separation column, and then the inorganic anions were separated from the organic compounds. (iii) The concentrator column was placed in line with the separation column, and the anions were captured on the concentrator column. (iv) The concentrator column was switched in line with the guard column, and the organic compounds and inorganic anions were simultaneously determined. The measurements were performed using a 20.0 μL sample loop. The quaternary pump was used to supply not only the mobile phase for organic compounds but also the pretreatment solution for inorganic anions. An UltiMate UHPLC XB-C18 column was utilized for the separation of the inorganic anions from parabens. An IonPac AG19 guard column (50 mm × 4 mm i.d., 5 μm) was used as the concentrator column to concentrate anions. The material in the AG19 column is microporous polyvinylbenzyl ammonium polymer cross-linked with divinylbenzene. Chromeleon 7.2 software (Thermo Fisher Scientific Waltham, MA, USA) was utilized to acquire and integrate the data on a Dell computer. This software could control the switching time of valve II precisely and automatically to optimize the repeatability of the experimental results. Polyether ether ketone and stainless steel tubes were used to connect all chromatographic hardware and kept as short as possible. The column temperature was kept at 30 °C to increase the retention time reproducibility. The suppressor current was set at 50 mA. The conductivity detector was thermostated at 35 °C.
2.5. Method validation
![[thin space (1/6-em)]](https://www.rsc.org/images/entities/char_2009.gif) :
:![[thin space (1/6-em)]](https://www.rsc.org/images/entities/char_2009.gif) 40, v/v) with 1% formaldehyde and then stored at −20 °C. Matrix–calibration standards with concentrations at 0.1, 0.5, 1.0, 5.0, and 10.0 mg L−1 were prepared for the calibration curves of MP, EP, PP, and BP, respectively. Additionally, 0.2, 0.5, 1.0, 5.0, and 10.0 mg L−1 were prepared for nitrite, sulfite, sulfate, and nitrate, respectively.
40, v/v) with 1% formaldehyde and then stored at −20 °C. Matrix–calibration standards with concentrations at 0.1, 0.5, 1.0, 5.0, and 10.0 mg L−1 were prepared for the calibration curves of MP, EP, PP, and BP, respectively. Additionally, 0.2, 0.5, 1.0, 5.0, and 10.0 mg L−1 were prepared for nitrite, sulfite, sulfate, and nitrate, respectively.3. Results and discussion
3.1. Two-dimensional UHPLC-IC valve-switching system procedure
The sample preparation method was also optimized before starting the 2D UHPLC-IC optimization. Thus, the extraction time of the ultrasound-assisted extraction step was studied. The results showed that the paraben and inorganic anion recoveries gradually increased with the increase of the extraction time from 0 min to 30.0 min and reached a balance of 93.9–106.2% in 10 min when the spiked level was 0.4, 2.0 and 8.0 mg L−1. Thus, the extraction time of 10 min was chosen as the optimum extraction time for further studies. Different methanol and deionized water proportions and KOH eluent concentrations have been studied to determine parabens and inorganic anions. The results demonstrated that the mobile phase of the methanol/deionized water proportion (60![[thin space (1/6-em)]](https://www.rsc.org/images/entities/char_2009.gif) :
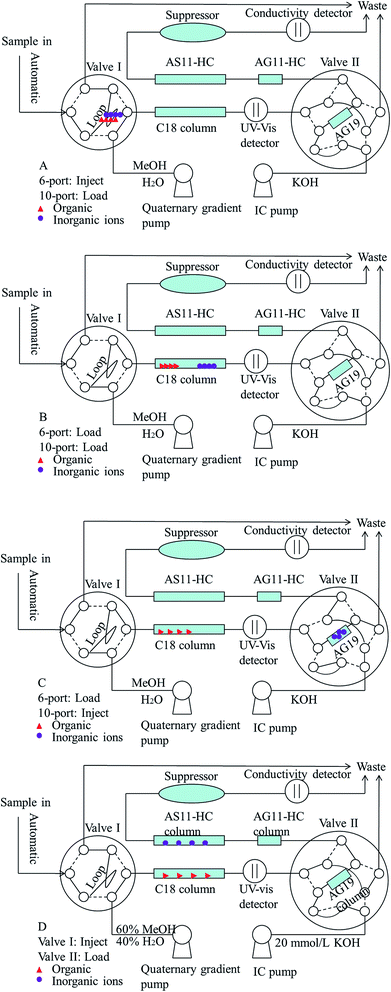
:![[thin space (1/6-em)]](https://www.rsc.org/images/entities/char_2009.gif) 40, v/v) and 20 mmol L−1 KOH eluent can obtain the best resolution, peak shape, and least analytical time. Fig. 1 presents the configuration diagram of this chromatographic apparatus for this two-dimensional UHPLC-IC valve-switching system. Four operation steps were established in this study and described as follows. First, the 20.0 μL pretreated sample was loaded onto the sample loop via auto injection by loading valve I (Fig. 1A, before 0 min). Second, the sample was delivered via the methanol/water (60
40, v/v) and 20 mmol L−1 KOH eluent can obtain the best resolution, peak shape, and least analytical time. Fig. 1 presents the configuration diagram of this chromatographic apparatus for this two-dimensional UHPLC-IC valve-switching system. Four operation steps were established in this study and described as follows. First, the 20.0 μL pretreated sample was loaded onto the sample loop via auto injection by loading valve I (Fig. 1A, before 0 min). Second, the sample was delivered via the methanol/water (60![[thin space (1/6-em)]](https://www.rsc.org/images/entities/char_2009.gif) :
:![[thin space (1/6-em)]](https://www.rsc.org/images/entities/char_2009.gif) 40, v/v) mobile phase from the sample loop into the XB-C18 column for online sample pretreatment (Fig. 1B, 0–1.0 min). The ions were eluted out, but the organics were retained on the XB-C18 column. Third, the concentrator column was in line with C18 column by switching the valve II to the load position, and the ions were captured by the IonPac AG19 column (Fig. 1C, 1.0–2.1 min). Valve II was switched for the second time, and then this system was changed to the status shown in Fig. 1D (2.1–12 min). Then the parabens and inorganic anions were separated and simultaneously determined. Before the first switch of valve II, the pressure of quaternary gradient pump was 545 bar, and the pressure of IC pump was 2602 psi. After the first switch of valve II, the pressure of quaternary gradient pump was 554 bar, and the pressure of IC pump was 2357 psi. The pressure of quaternary gradient pump was less than the upper limit 1000 bar and the pressure of IC pump was less than the upper limit 3000 psi. The appropriate pressure made the 2D UHPLC-IC system suitable for simultaneously determining parabens and inorganic anions.
40, v/v) mobile phase from the sample loop into the XB-C18 column for online sample pretreatment (Fig. 1B, 0–1.0 min). The ions were eluted out, but the organics were retained on the XB-C18 column. Third, the concentrator column was in line with C18 column by switching the valve II to the load position, and the ions were captured by the IonPac AG19 column (Fig. 1C, 1.0–2.1 min). Valve II was switched for the second time, and then this system was changed to the status shown in Fig. 1D (2.1–12 min). Then the parabens and inorganic anions were separated and simultaneously determined. Before the first switch of valve II, the pressure of quaternary gradient pump was 545 bar, and the pressure of IC pump was 2602 psi. After the first switch of valve II, the pressure of quaternary gradient pump was 554 bar, and the pressure of IC pump was 2357 psi. The pressure of quaternary gradient pump was less than the upper limit 1000 bar and the pressure of IC pump was less than the upper limit 3000 psi. The appropriate pressure made the 2D UHPLC-IC system suitable for simultaneously determining parabens and inorganic anions.
3.2. Selecting the second switching time of valve II
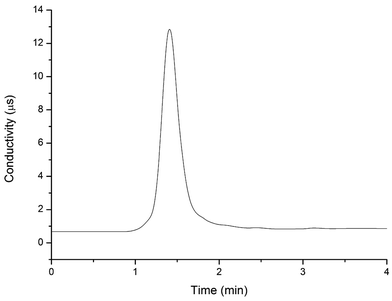
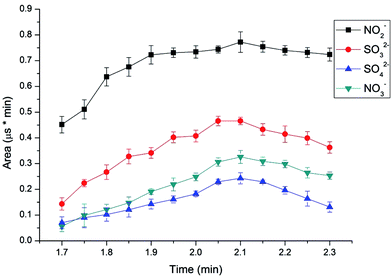
To determine the elution time of inorganic anions from the C18 column, a conductivity detector was directly connected with a C18 column without a suppressor. The ions eluted from the C18 column were detected. Fig. 2 shows the unsuppressed conductivity analysis of the ions eluted from the C18 column. Inorganic ions are eluted out prior to parabens because the former cannot be reserved on the C18 column with methanol and water as the mobile phase. A peak was observed at approximately 1.0–2.0 min on the chromatogram. Considering the collection completeness of the inorganic anions, Fig. 3 presents the relationships between the second switching time of valve II and the peak area of each anion. The results indicated that the peak areas remarkably increased with prolonged second switching time of valve II in the range of 1.7–2.1 min. The peak areas slightly decreased beyond 2.1 min. The concentration quantity of these four anions on the IonPac AG19 column was deduced to increase with the increase of the second switching time of valve II. However, beyond 2.1 min, the anions that concentrated on the IonPac AG19 column were slightly flushed. The peak areas of these four anions can reach the maximum when the second switching time of valve II was set at 2.1 min. Based on the discussion above, 2.1 min was selected as the optimum second switching time of valve II. As shown in Fig. 1B, before used to concentrate anions, the AG19 column was rinsed by the 20 mmol L−1 KOH eluent. This short column was activated steadily. When switching the valve II, the AG19 column was changed under the mobile phase of methanol/water (60![[thin space (1/6-em)]](https://www.rsc.org/images/entities/char_2009.gif) :
:![[thin space (1/6-em)]](https://www.rsc.org/images/entities/char_2009.gif) 40, v/v). Under this mobile phase, the AG19 column had no capacity of ionic elution and could concentrate anions in the range of 1.0–2.1 min.
40, v/v). Under this mobile phase, the AG19 column had no capacity of ionic elution and could concentrate anions in the range of 1.0–2.1 min.
3.3. Selecting the concentration of formaldehyde in standard solutions
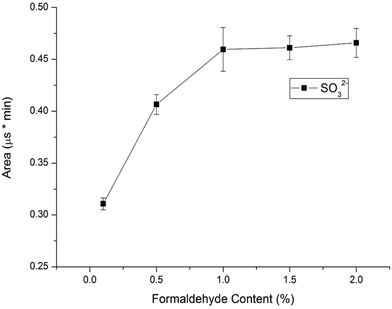
Considering that sulfite can be easily oxidized into sulfate in water, we should protect sulfite by using a stabilizer agent before analysis is performed. Sulfite can react with formaldehyde to form nonvolatile and stable hydroxymethanesulfonate (HMS) in an acidic solution.16 The resulting HMS can be converted back to sulfite and formaldehyde under basic conditions before determination by a conductivity detector, so sulfite can be determined under protection with formaldehyde. In this study, formaldehyde was used for reacting with sulfite to form stable MS− in standard solutions and samples to prevent the sulfite from oxidizing. To investigate the influence of the formaldehyde content in 10.0 mg L−1 standard solutions on the sulfite's peak area, the formaldehyde concentration was varied in the range of 0.1–2.0% (v/v). Fig. 4 illustrates the results. The sulfite's peak area increased with the increase of the percentage of formaldehyde percentage in standard solutions. The highest peak area of the sulfite was obtained at 1.0% formaldehyde in standard solution. The sulfite was completely converted into MS− with 1.0% formaldehyde in 10.0 mg L−1 standard solutions. Considering the almost constant influence of 1.0–2.0% formaldehyde on the sulfite area, 1.0% formaldehyde in standard solutions was chosen as the optimum content.3.4. Analytical performances
Under the optimized conditions, a series of standard solutions consisting of target analytes at various concentrations were analyzed. The linearity of the matrix–calibration curves was studied using the peak area of quantitative parabens and inorganic anions against the concentration. Each analyte was found to exhibit satisfactory linearity with the correlation coefficient r > 0.9990. Table 1 summarizes the satisfactory coefficients of determination (r), the linear ranges, the detection limits and recoveries of this method. The precisions (RSDs) of the six replicate standard solutions were calculated, with ≤2.6% based on retention time and ≤0.69% based on peak area. The accuracy was assessed based on the analysis of parabens and inorganic anions spiked at low, medium, high level in the blank cosmetic samples. The recoveries of the three spiking levels of parabens and inorganic anions were in the range of 93.9–106.2% for the spiked blank cosmetic samples.| Analyte | Linear range (mg L−1) | r | LODs (μg L−1) | LOQs (μg L−1) | RSD (n = 6)% | Average recoverya (%) | |||
|---|---|---|---|---|---|---|---|---|---|
| Peak area | Retention time | Low level | Medium level | High level | |||||
| a Spiked level: low, medium and high level mean 0.4, 2.0 and 8.0 mg L−1 for parabens, nitrite, sulfite, sulfate and nitrate in blank cosmetic samples. The results are means ± average deviation (n = 3). | |||||||||
| MP | 0.1–10.0 | 0.9997 | 8.0 | 27 | 3.4 × 10⁻¹ | 1.5 × 10⁻¹ | 101.5 ± 0.2 | 93.9 ± 0.1 | 104.0 ± 0.1 |
| EP | 0.1–10.0 | 0.9999 | 8.8 | 29 | 4.3 × 10⁻¹ | 1.2 × 10⁻¹ | 104.5 ± 0.1 | 102.8 ± 0.1 | 101.5 ± 0.1 |
| PP | 0.1–10.0 | 0.9999 | 18 | 59 | 4.8 × 10⁻¹ | 5.3 × 10⁻¹ | 95.3 ± 0.3 | 100.7 ± 0.2 | 101.7 ± 0.2 |
| BP | 0.1–10.0 | 0.9999 | 32 | 110 | 6.1 × 10⁻¹ | 8.0 × 10⁻² | 94.5 ± 0.1 | 105.2 ± 0.4 | 101.4 ± 0.2 |
| NO2− | 0.2–10.0 | 0.9994 | 18 | 60 | 8.6 × 10⁻¹ | 1.9 × 10⁻¹ | 106.2 ± 0.4 | 102.8 ± 0.2 | 103.5 ± 0.5 |
| SO32− | 0.2–10.0 | 0.9995 | 40 | 130 | 1.1 | 5.0 × 10⁻² | 104.3 ± 0.2 | 100.7 ± 0.3 | 96.4 ± 0.02 |
| SO42− | 0.2–10.0 | 0.9998 | 80 | 270 | 2.6 | 6.9 × 10⁻¹ | 102.6 ± 0.4 | 98.9 ± 0.3 | 94.0 ± 0.1 |
| NO3− | 0.2–10.0 | 0.9997 | 60 | 200 | 9.4 × 10⁻¹ | 1.6 × 10⁻¹ | 100.5 ± 0.4 | 98.3 ± 0.2 | 102.8 ± 0.4 |
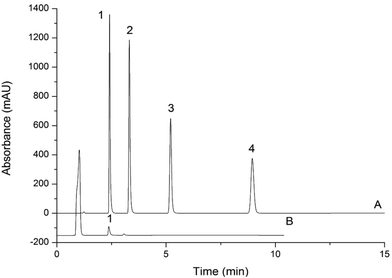
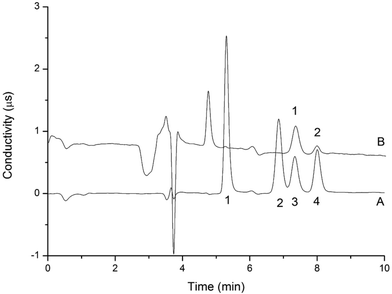
The LODs and LOQs, which were calculated based on a 20.0 μL injection volume of the 0.4 mg L−1 spiked blank sample that yielded an S/N ratio of 3 and 10, were in the range of 8.0–80 μg L−1 and 27–270 μg L−1, respectively. Fig. 5 and 6 display the representative chromatograms of parabens and inorganic anions in the cosmetics no interference peak of parabens and inorganic anions was observed in the chromatograms. This finding indicates that this method has excellent sensitivity and selectivity. Table 2 compares the results of this work and those of the literature. Compared with other methods for paraben and inorganic anion determination, this approach has a lower LOD. Moreover, it can simultaneously determine parabens and inorganic anions, which can substantially shorten the analysis time.
| Chromatographic technique | Sample | Sample pretreatment | Sample pretreatment time (min) | Chromatographic time (min) | Amount of sample | Analytes | Injection volume in the chromatographic system (μL) | Detection technique | Precision (RSD) | LOD (mg L−1) | Recovery | Linear range | Ref. |
|---|---|---|---|---|---|---|---|---|---|---|---|---|---|
| HPLC | Cosmetics | Diluted with 40% methanol | 2 | 12 | — | MP, EP, PP, BP | 5 | Fluorescence detection | 0.4–2.2% | 7–14 | 94.8–99.6% | 0.05–20 mg L−1 | 17 |
| Multi-syringe chromatographic system | Cosmetics | Sonication, centrifugation, dilution | 17 | 11.7 | 0.5 g | MP, EP, PP, BP | 20–160 | Chemiluminescent detection | 2–4.9% | 2 × 10⁻² to 4 × 10⁻² | — | 0.06–12 mg L−1 | 18 |
| Capillary zone electrophoresis | Cosmetics | Dilution, filtration | 9 | 1.2 | 1.0 g | MP, EP, PP, BP | 5 | UV detection | 0.30–2.88% | 0.1 | 85.9–95.1% | 0.50–30 mg L−1 | 19 |
| RP-HPLC | Cosmetics | Dilution, filtration | 17 | 8 | 0.5 g | MP, EP, PP, BP | 20 | UV detection | 1.0–3.0% | 4.0 × 10⁻² to 0.100 | 92.4–109.2% | 1–100 μmol L−1 | 20 |
| Ultra high-speed liquid chromatography | Cosmetics | Dilution, sonication | 30 | 8 | 20 g L−1 | MP, EP, PP, BP | 2 | Diode array detection | 3.3–5.4% | 0.12–0.15 | 90.4–97.7% | 0.50–160 mg L−1 | 21 |
| IC cycling-column-switching system | Sodium chloride electrolyte sample | Direct injection | — | 60 | 25 μL | Chlorate, nitrite | 25 | Conductivity detection | <1.0% | 3.1 × 10⁻³ | 98.8–101.2% | — | 22 |
| IC with cycling-column-switching | Seawater | Dilution by 5-folds | 2 | 45 | 25 μL | Fluoride, nitrite, nitrate, bromide, sulfate, phosphate | 25 | Conductivity detection | <4% | 2 × 10⁻³ to 2.3 × 10⁻² | 97–107% | 0.05–25.0 mg L−1 | 23 |
| IC | Liquid fertilizer | Dilution by 1000-fold | 2 | 10 | 1 mmol L−1 | Eight common anions | 30 | Conductivity detection | 0.4–2.0% | 2.3 × 10⁻² to 0.26 | 95–101% | 0.005–0.5 mM | 24 |
| Two-dimensional UHPLC-IC valve-switching system | Cosmetics | Dilution by 100-fold | 20 | 12 | 0.1 g | MP, EP, PP, BP, nitrite, sulfite, sulfate, nitrate | 20.0 | UV-vis and conductivity detection | 0.34–2.6% | 8.0 × 10⁻³ to 8.0 × 10⁻² | 93.9–106.2% | 0.1–10.0 mg L−1 | This work |
3.5. Verification and application
To illustrate the application of the proposed method, we selected eight actual cosmetic samples and determined MP, EP, PP, BP, nitrite, nitrate, sulfite and sulfate. In this approach, a simple matrix standard addition method was utilized to establish recovery data. The peaks of parabens and inorganic anions were confirmed by the enhanced peak intensities of parabens and inorganic anions in the chromatogram by spiking the sample with a known amount of parabens and inorganic anions. Table 3 provides the analysis results of parabens and inorganic anions in the eight commercial cosmetic samples. These results showed that parabens and inorganic anions were generally present in these cosmetics.| Analyte | Sample 1 (mg L−1) | Sample 2 (mg L−1) | Sample 3 (mg L−1) | Sample 4 (mg L−1) | Sample 5 (mg L−1) | Sample 6 (mg L−1) | Sample 7 (mg L−1) | Sample 8 (mg L−1) |
|---|---|---|---|---|---|---|---|---|
| a The results are means ± average deviation (n = 3); the sample mean value was determined in one day (n = 3 replicates). | ||||||||
| Methylparaben | (1.0 ± 0.1) × 10−1 | 8.54 ± 0.02 | 2.00 ± 0.03 | (5.7 ± 0.1) × 10−1 | — | 5.83 ± 0.03 | — | (3.9 ± 0.1) × 10−1 |
| Ethylparaben | — | — | — | — | — | (3.6 ± 0.1) × 10−1 | — | — |
| Propylparaben | 1.19 ± 0.01 | 2.81 ± 0.03 | (5.4 ± 0.1) × 10−1 | — | — | (2.1 ± 0.2) × 10−1 | — | — |
| Butylparaben | — | — | — | — | — | — | — | — |
| Nitrite | (6.6 ± 0.2) × 10−1 | (6.2 ± 0.3) × 10−1 | (5.9 ± 0.2) × 10−1 | — | (6.6 ± 0.1) × 10−1 | (5.9 ± 0.1) × 10−1 | — | (9.5 ± 0.2) × 10−1 |
| Sulfite | — | — | — | — | — | — | — | — |
| Sulfate | — | — | — | (9.5 ± 0.3) × 10−1 | — | (5.9 ± 0.1) × 10−1 | — | 1.07 ± 0.03 |
| Nitrate | (3.8 ± 0.2) × 10−1 | (3.3 ± 0.1) × 10−1 | — | (2.4 ± 0.4) × 10−1 | (3.5 ± 0.3) × 10−1 | (5.7 ± 0.2) × 10−1 | (5.3 ± 0.3) × 10−1 | (9.5 ± 0.4) × 10−1 |
4. Conclusion
A simple and rapid two-dimensional UHPLC-IC column-switching method was developed to determine parabens and inorganic anions in cosmetics simultaneously. With this method, inorganic anions were retained and concentrated on the concentrator column. The main advantages of the proposed method compared with offline solid-phase extraction pretreatment and conventional column-switching IC techniques are as follows: elimination of an online matrix, skipping of pretreatment column refreshing, usage of weak hazardous chemical regents, and simultaneous determination of organic compounds and inorganic anions. Parabens and inorganic anions in cosmetics were simultaneously estimated without any interference and with satisfactory analytical time. The paraben and inorganic anion contents in cosmetics were determined in single chromatographic run. Therefore, the proposed method can be used as a convenient and practical tool for routine analysis.Acknowledgements
This research was financially supported by National Science Foundation of China (No. 21405141), the Science and Technology Foundation for Benefit people of Ningbo (No. 2015C50041), Zhejiang Provincial Program for Public Welfare of Technology Application Research Plan (No. 2015C31149), Key Laboratory of Furniture Inspection Technology of Zhejiang Province (No. 2016J05).References
- Y. Guan, Q. Chu, L. Fu and J. Ye, J. Chromatogr. A, 2005, 1074, 201–204 CrossRef CAS PubMed
.
- R. Hájková, P. Solich, M. PospíŠilová and J. ŠíCha, Anal. Chim. Acta, 2002, 467, 91–96 CrossRef
.
- T. Liu, Y. Li, X. Zhao, M. Zhang and W. Gu, J. Insect Physiol., 2014, 71, 1–7 CrossRef CAS PubMed
.
- Z. Kalaycıoğlu and F. B. Erim, Food Anal. Method, 2016, 9, 706–711 CrossRef
.
- Y. Picó, TrAC, Trends Anal. Chem., 2013, 43, 84–99 CrossRef
.
- S. J. Lehotay, S. Yelena, H. Lijun and J. J. Johnston, J. Agric. Food Chem., 2015, 63, 10341–10351 CrossRef CAS PubMed
.
- D. Bresson-Rival and E. Perrier, EP0887072, 2002.
- R. R. Williams, R. E. Waterman, J. C. Keresztesy and E. R. Buchman, J. Am. Chem. Soc., 2002, 57, 536–537 CrossRef
.
- C. Piao, L. Chen and Y. Wang, J. Chromatogr. B: Anal. Technol. Biomed. Life Sci., 2014, 969, 139–148 CrossRef CAS PubMed
.
- N. Cabaleiro, I. D. L. Calle, C. Bendicho and I. Lavilla, TrAC, Trends Anal. Chem., 2014, 57, 34–46 CrossRef CAS
.
- P. G. Wang and W. Zhou, J. Sep. Sci., 2013, 36, 1781–1787 CrossRef CAS PubMed
.
- H. Small and J. Riviello, Anal. Chem., 1998, 70, 2205–2212 CrossRef CAS PubMed
.
- Z. Song, D. Wu, K. Ding and Y. Guan, J. Chromatogr. A, 2016, 1433, 85–89 CrossRef CAS PubMed
.
- R. A. Niemann and D. L. Anderson, J. Chromatogr. A, 2008, 1200, 193–197 CrossRef CAS PubMed
.
- Y. Zhong, W. Zhou, H. Zhu, X. Zeng, M. Ye, P. Zhang and Y. Zhu, Anal. Chim. Acta, 2011, 686, 1–8 CrossRef CAS PubMed
.
- X. H. Huang, H. S. Ip and J. Z. Yu, Anal. Chim. Acta, 2007, 604, 134–138 CrossRef CAS PubMed
.
- A. Zgołagrześkowiak, J. Werner, M. Jeszkaskowron and B. Czarczyńskagoślińska, Anal. Methods, 2016, 8, 3903–3909 RSC
.
- M. Rodas, L. A. Portugal, J. Avivar, J. M. Estela and V. Cerdà, Talanta, 2015, 143, 254–262 CrossRef CAS PubMed
.
- M. D. Dolzan, D. A. Spudeit, M. S. Azevedo, A. C. Costa, M. A. Oliveira and G. A. Micke, Anal. Methods, 2013, 5, 6023–6029 RSC
.
- N. Youngvises, T. Chaida, S. Khonyoung, N. Kuppithayanant, W. Tiyapongpattana, A. Itharat and J. Jakmunee, Talanta, 2013, 106, 350–359 CrossRef CAS PubMed
.
- T. Fei, H. Li, M. Ding, M. Ito and J. M. Lin, J. Sep. Sci., 2011, 34, 1599–1606 CrossRef CAS PubMed
.
- N. Wang, R. Q. Wang and Y. Zhu, J. Hazard. Mater., 2012, 235–236, 123–127 CrossRef CAS PubMed
.
- R. Wang, N. Wang, M. Ye and Y. Zhu, J. Chromatogr. A, 2012, 1265, 186–190 CrossRef CAS PubMed
.
- K. Arai, M. Mori, D. Kozaki, N. Nakatani, H. Itabashi and K. Tanaka, J. Chromatogr. A, 2012, 1270, 147–152 CrossRef CAS PubMed
.
| This journal is © The Royal Society of Chemistry 2017 |

