
 Open Access Article
 This Open Access Article is licensed under a
 Creative Commons Attribution 3.0 Unported Licence
Hierarchical S-doped porous carbon derived from by-product lignin for high-performance supercapacitors†
Jingyang Tian,
Zhangming Liu,
Zhenghui Li,
Wenguang Wang and
Haiyan Zhang *
*
College of Materials and Energy, Guangdong University of Technology, Guangzhou 51006, China. E-mail: hyzhang@gdut.edu.cn; Fax: +86 20 39322570; Tel: +86 20 39323232
First published on 20th February 2017
Abstract
For the first time, hierarchical S-doped porous carbon was fabricated using sodium lignosulfonate as a carbon and sulfur precursor through a simple template technique. The obtained carbon has a high surface area (1054 m2 g−1), high pore volume (1.73 cm3 g−1), high sulfur content (2.9 wt%), and interconnected open macropores that can provide many storage sites, pseudocapacitance, and short transport paths for ions. The as-obtained S-PC-L-900 exhibits a high specific capacitance (328 F g−1) at 0.2 A g−1, excellent rate performance with 73% capacitance retention after a current density increasing from 0.5 to 20 A g−1 and cycling stability, with 97% capacitance retention after 10![[thin space (1/6-em)]](https://www.rsc.org/images/entities/char_2009.gif) 000 cycles. Additionally, a symmetric supercapacitor based on S-PC-L-900 delivers a high energy density (6.9 W h kg−1) at 50 W kg−1.
000 cycles. Additionally, a symmetric supercapacitor based on S-PC-L-900 delivers a high energy density (6.9 W h kg−1) at 50 W kg−1.
1. Introduction
With exacerbated energy and environmental problems such as pollution, fossil fuel depletion, and global warming, sustainable and renewable energy materials have become more widespread.1 Supercapacitors, also known as electrochemical capacitors, have attracted most attention because of their high power density, fast charge and discharge, and long cycle life.2–5 Electrochemical capacitors can be categorized into electrical double-layer capacitors (EDLCs) and pseudocapacitors according to the energy storage mechanism.6,7 The energy storage of EDLCs is based on the electrostatic storage of electrical energy achieved by separation of charge in a Helmholtz double layer at the electrode/electrolyte interface. Therefore, the increase in the electrode surface area, which is accessible to electrolyte ions, can lead to higher capacitance. Another important factor is the surface properties and porosity of the electrode, such as pore size.8 On the other hand, the electrochemical storage of electrical energy for pseudocapacitors is dominated by faradaic charge transfer that occurs between the electrodes and electrolyte, which leads to reversible redox reactions.Recently, porous carbon materials, one of the carbonaceous materials, have been widely used as electrodes for EDLCs mainly because of their high surface area, good conductivity, well-developed pore structure, and high physicochemical stability.9,10 Most of the porous carbon consists of narrow micropores (<1 nm) which can exhibit a large BET surface area. However, these granular powders of porous carbon can result in large diffusion paths of ions. This is a serious drawback, as it limits the transport of ions in the pores, which leads to a sharp reduction of EDLCs performance at high current densities.11 Reducing the effective diffusion paths such as hierarchical structure containing macropores, mesopores, and micropores is one useful strategy. The macropores and mesopores can respectively act as ion-buffering reservoirs and channels for rapid transport of ions. Meanwhile, micropores provide abundant locations for charge accommodation. Therefore, preparation of hierarchical porous carbon containing a certain amount of macropores and mesopores is important to EDLC systems.
The preparation of porous carbon usually involves complex processes during synthesis, while most of them require a series of harsh chemical treatments. However, direct pyrolysis of abundant and renewable carbon precursors such as biowaste12,13 and biomass,7,10 has been proven to be a sustainable low-cost strategy.14 The good performance of supercapacitor electrodes produced through carbonization of biomass such as waste coffee grounds,8 seaweeds,15 and rice husks16 has been demonstrated. Lignin is one of the most abundant components of biomass ranks, second to cellulose. After the pulping process, lignin is obtained as a non-valuable by-products; its combustion to obtain energy17 results in serious air pollution. Therefore, many studies have explored transformation of lignin into high-value-added products.18,19
Doping of heteroatoms into carbon materials is an efficient way of improving the intrinsic chemical and electrical properties because of the introduced extrinsic defects that function as electron acceptors.20–22 In a recent study, carbon materials have been doped with heteroatoms such as nitrogen, phosphorus, sulfur, and boron via single or dual methods.23–26 In particular, sulfur-doped materials with wider band gap have drawn great attention because of the electron-withdrawing property of S.21 Much researches have focused on the application of S-doped carbon materials, such as cathode catalysts,27 Li ion batteries,28,29 electrochemical capacitors,30,31 and H2 storage.32
Sulfur-doped carbon is generally synthesized through a complex procedure that includes mixing of the sulfur-containing and carbon precursors. Most of the sulfur-containing precursors such as benzyl disulfide,33 hydrogen sulfide,34 and carbon disulfide21 are toxic. One novel environment-friendly way of obtaining sulfur-doped materials is utilizing precursors that contain both carbon and sulfur, which can also reduce the number of mixing steps.35
In this paper, we present a simple environment-friendly procedure for the synthesis of hierarchically S-doped porous carbon (S-PC-L) via direct carbonization of sulfur- and carbon-containing sodium lignosulfonate with silica templates. After removal of inorganic impurities, L-S-PC was obtained. Compared with undoped porous carbon prepared by carbonization of sucrose (PC-S),36 L-S-PC shows higher specific capacitance due to the particular hierarchical structure, which contains micropores as well as many macropores and mesopores. This approach of synthesis of sulfur-doped porous carbon not only provides an economical material for EDLCs, but also supplies a green alternative technique to those using toxic sulfur precursors.
2. Experimental section
2.1 Synthesis of the hierarchically S-doped porous carbon (S-PC-L)
Similar to a previous report,37 L-S-PC was prepared through the following method. Sodium lignosulfonate (LS, 2.0 g) and sulfuric acid (3 ml, 1 M) were transferred to a vial and then stirred for about 0.5 h until the LS completely dissolved. Tetraethyl orthosilicate (TEOS, 4 ml) was then added quickly under vigorous stirring for 3 h until the mixture became homogenous. The vial was placed in an oven and dried at 40 °C for 48 h. Subsequently, the product was pre carbonized at 100 °C and 160 °C for 6 h, respectively. Afterward, the obtained gel monolith was placed in a tube furnace and carbonized at 700–900 °C for 3 h at a heating rate of 5 °C min−1 under N2 protection. Eventually, the carbon solid was etched with excess HF (40%) to remove the silica template and washed several times until the pH 7 was reached. The material was then dried at 105 °C overnight in an oven. The harvested samples were labeled as S-PC-L-700, S-PC-L-800, and S-PC-L-900 for different carbonization temperature. Porous carbon material derived from sucrose through the same method at 900 °C (PC-S-900) was used as control sample. The entire preparation process of S-doped porous carbon material is shown in Scheme 1.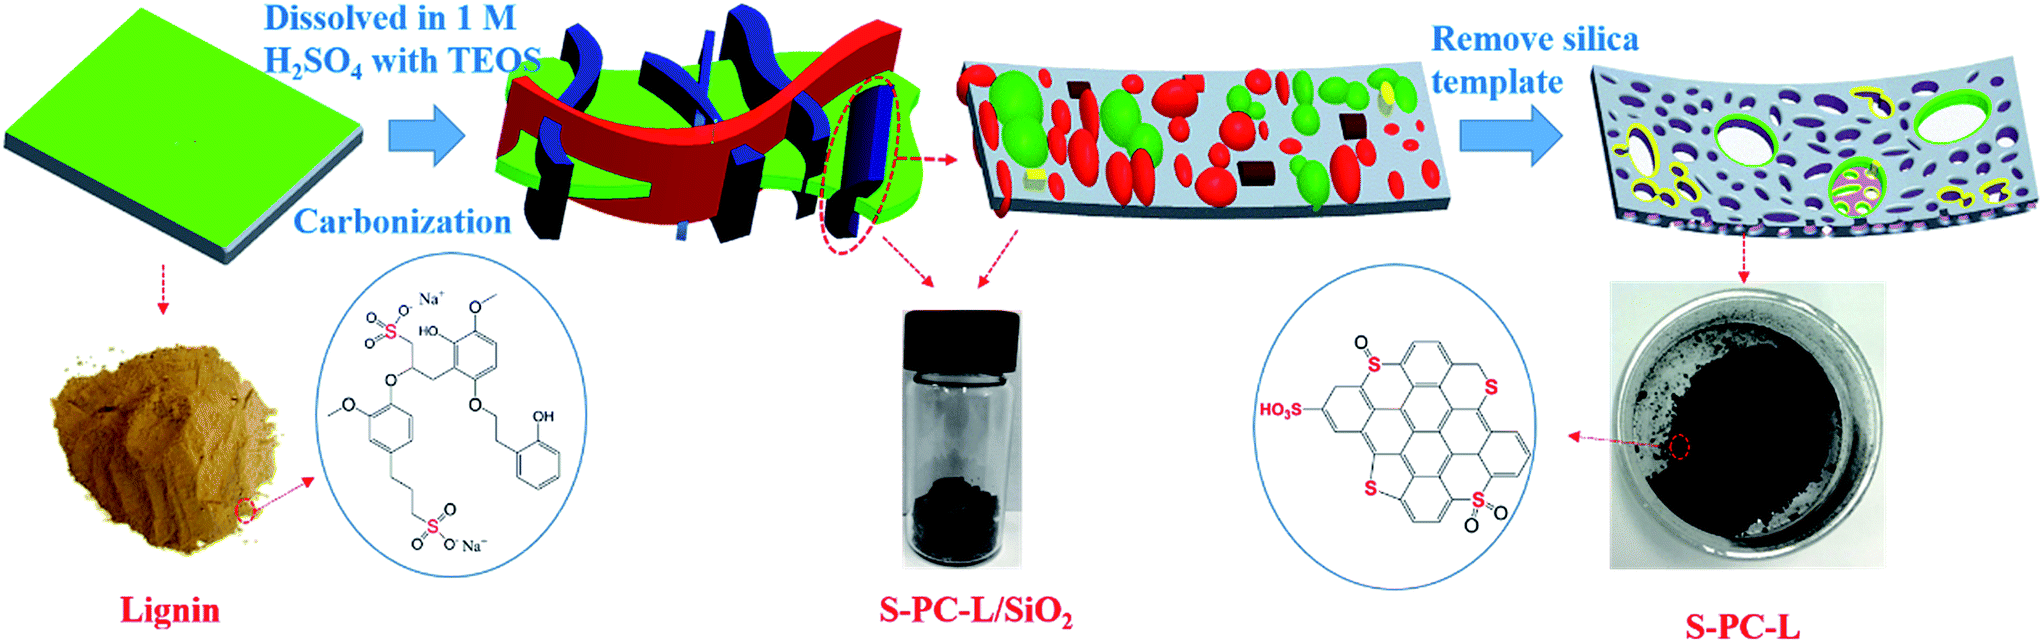 | ||
| Scheme 1 Schematic of the preparation process of S-doped porous carbon material. | ||
2.2 Material characterization
Images of the morphology of the prepared porous carbon were obtained using a field-emission scanning electron microscope (FE-SEM; Ultra55, Carl Zeiss, Germany) and field-emission transmission electron microscope (FE-TEM; JEM-2100F, Japan Electronics Corporation, Japan). Raman spectra were obtained on a Raman spectrometer (LabRAM Aramis, HORIBA Jobin Yvon, France) at 532 nm wavelength. X-ray photoelectron spectroscopy (XPS; Amicus, Shimadzu, Japan) and element analysis (EA; Vario EL Cube, Elementar, Germany) were used to examine the chemical composition. X-ray diffraction (XRD; Rigaku Corporation, Japan) patterns obtained using Cu Kα radiation were used to investigate the ordering of porous carbon. The Brunauer–Emmett–Teller (BET; Micromeritics 2460) surface area and pore size distribution were calculated from nitrogen sorption measurements at −196 °C.2.3 Preparation of electrodes
The working electrodes were prepared by mixing the as-prepared porous carbon S-PC-L-700, S-PC-L-800, S-PC-L-900, and PC-S-900 with acetylene black and polytetrafluoroethylene solution (60 wt%) in ethanol at a mass ratio of 8:1:1. The slurry was then pressed onto nickel foam at 10 MPa and dried at 80 °C overnight in an oven. The symmetric two-electrode cells were formed by placing two electrodes with exactly the same mass in a coin cell. Glassy fibrous films and 6 M KOH aqueous solution were used as separator and electrolyte respectively. The electrodes were soaked in electrolyte for 10 h before assembly. Finally, the cell was pressed at 10 MPa pressure for 10 s to complete the assembly.
2.4 Electrochemical characterization
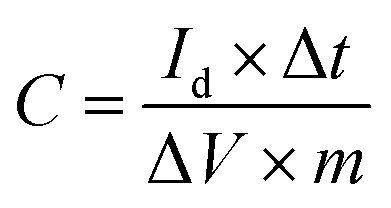
Electrochemical measurements of the carbon electrode in different aqueous solution were carried out on a CHI 660 E (Shanghai CHI Instruments Corporation, China) electrochemical workstation using a standard three-electrode system. The prepared electrode was used as working electrode while platinum foil was used as counter electrode. Hg/HgO electrode was used as reference electrode in KOH aqueous solution while Hg/Hg2SO4 was used in H2SO4 and Na2SO4 aqueous solution, respectively. Cyclic voltammetry (CV) was performed at scan rates of 5–2000 mV s−1. Galvanostatic charge/discharge (GCD) tests were done at different densities. Electrochemical impedance spectroscopy (EIS) measurements were performed in a frequency range of 0.05 Hz to 100 kHz at open-circuit potential, using an AC perturbation of 5 mV. Electrochemical measurements on the symmetric two-electrode cells were done using a Neware battery testing system (CT-3008, NEWARE Electronics Corporation, China).The specific capacitance of the electrodes was determined from galvanostatic measurement based on the following equation:7
 | (1) |
The energy density E and power density P were calculated according to the following equations:
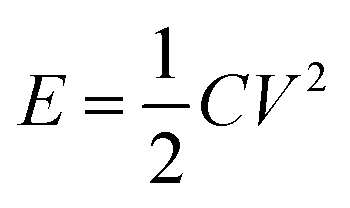 | (2) |
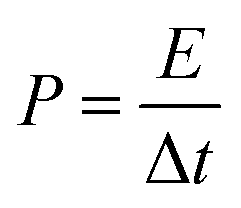 | (3) |
3. Results and discussion
3.1 Characterization of porous carbon
The transformation of sodium lignosulfonate into hierarchically S-doped porous carbon mainly containing carbonization and acid washing is depicted in Scheme 1. To investigate the effect of carbonization temperature on sulfur content and combination type, we obtained S-PC-L-700, S-PC-L-800, and S-PC-L-900 by carbonization of sodium lignosulfonate at 700, 800, and 900 °C respectively. The control sample, PC-S-900, was also obtained by carbonization of sucrose at 900 °C. Fig. 1 shows the morphological characterization results and microstructure of S-PC-L-900. The sample possesses a typical free-standing 2D architecture consisting of many overlapped and scrolled nanosheets, as shown in Fig. 1c. The FE-SEM images (Fig. 1a and b) illustrate the high porosity and unique hierarchical porous network with a sponge-like structure inside the sample, indicating packing of the nanosheets. Besides the numerous mesopores and micropores, there are random macropores ranging from 50–300 nm inside S-PC-L-900 (Fig. 1d and e). Fig. 1e is the high-resolution TEM (HRTEM) image of the area marked 1 in Fig. 1d, which shows feeble lattice fringes of the nanosheet resulting from structural defects in the carbon crystal lattice due to the large atomic size of S.38 Fig. 1e suggests that the nanosheet consists of a few coupled layers with a d spacing of 0.38 nm, which is slightly larger than that of graphite (0.33 nm). This may due to the incorporation of the large heteroatoms (O and S) and carbon matrixes that protrude out of the graphene plane and increase the bond length.39 The selected-area electron diffraction pattern of S-PC-L-900 (inset of Fig. 1e) shows a typical dispersive ring-like pattern indicating the polycrystalline nature of the sample. The pattern arises from the merging of the diffraction spots because of the large number of layers in the selected area.40,41 EDS elemental mapping (Fig. 1f) shows that C, O and S are homogeneously distributed throughout the entire area of the samples. Similar morphologies of S-PC-L-800 may also be observed (Fig. S1c and f†); for PC-S-900 and S-PC-L-700, no sponge-like structure and fewer macropores can be observed in the HRSEM images (Fig. S1a and b†) and HRTEM images (Fig. S1d and e†) respectively. The surfaces are smooth and some fragments assemble in S-PC-L-700.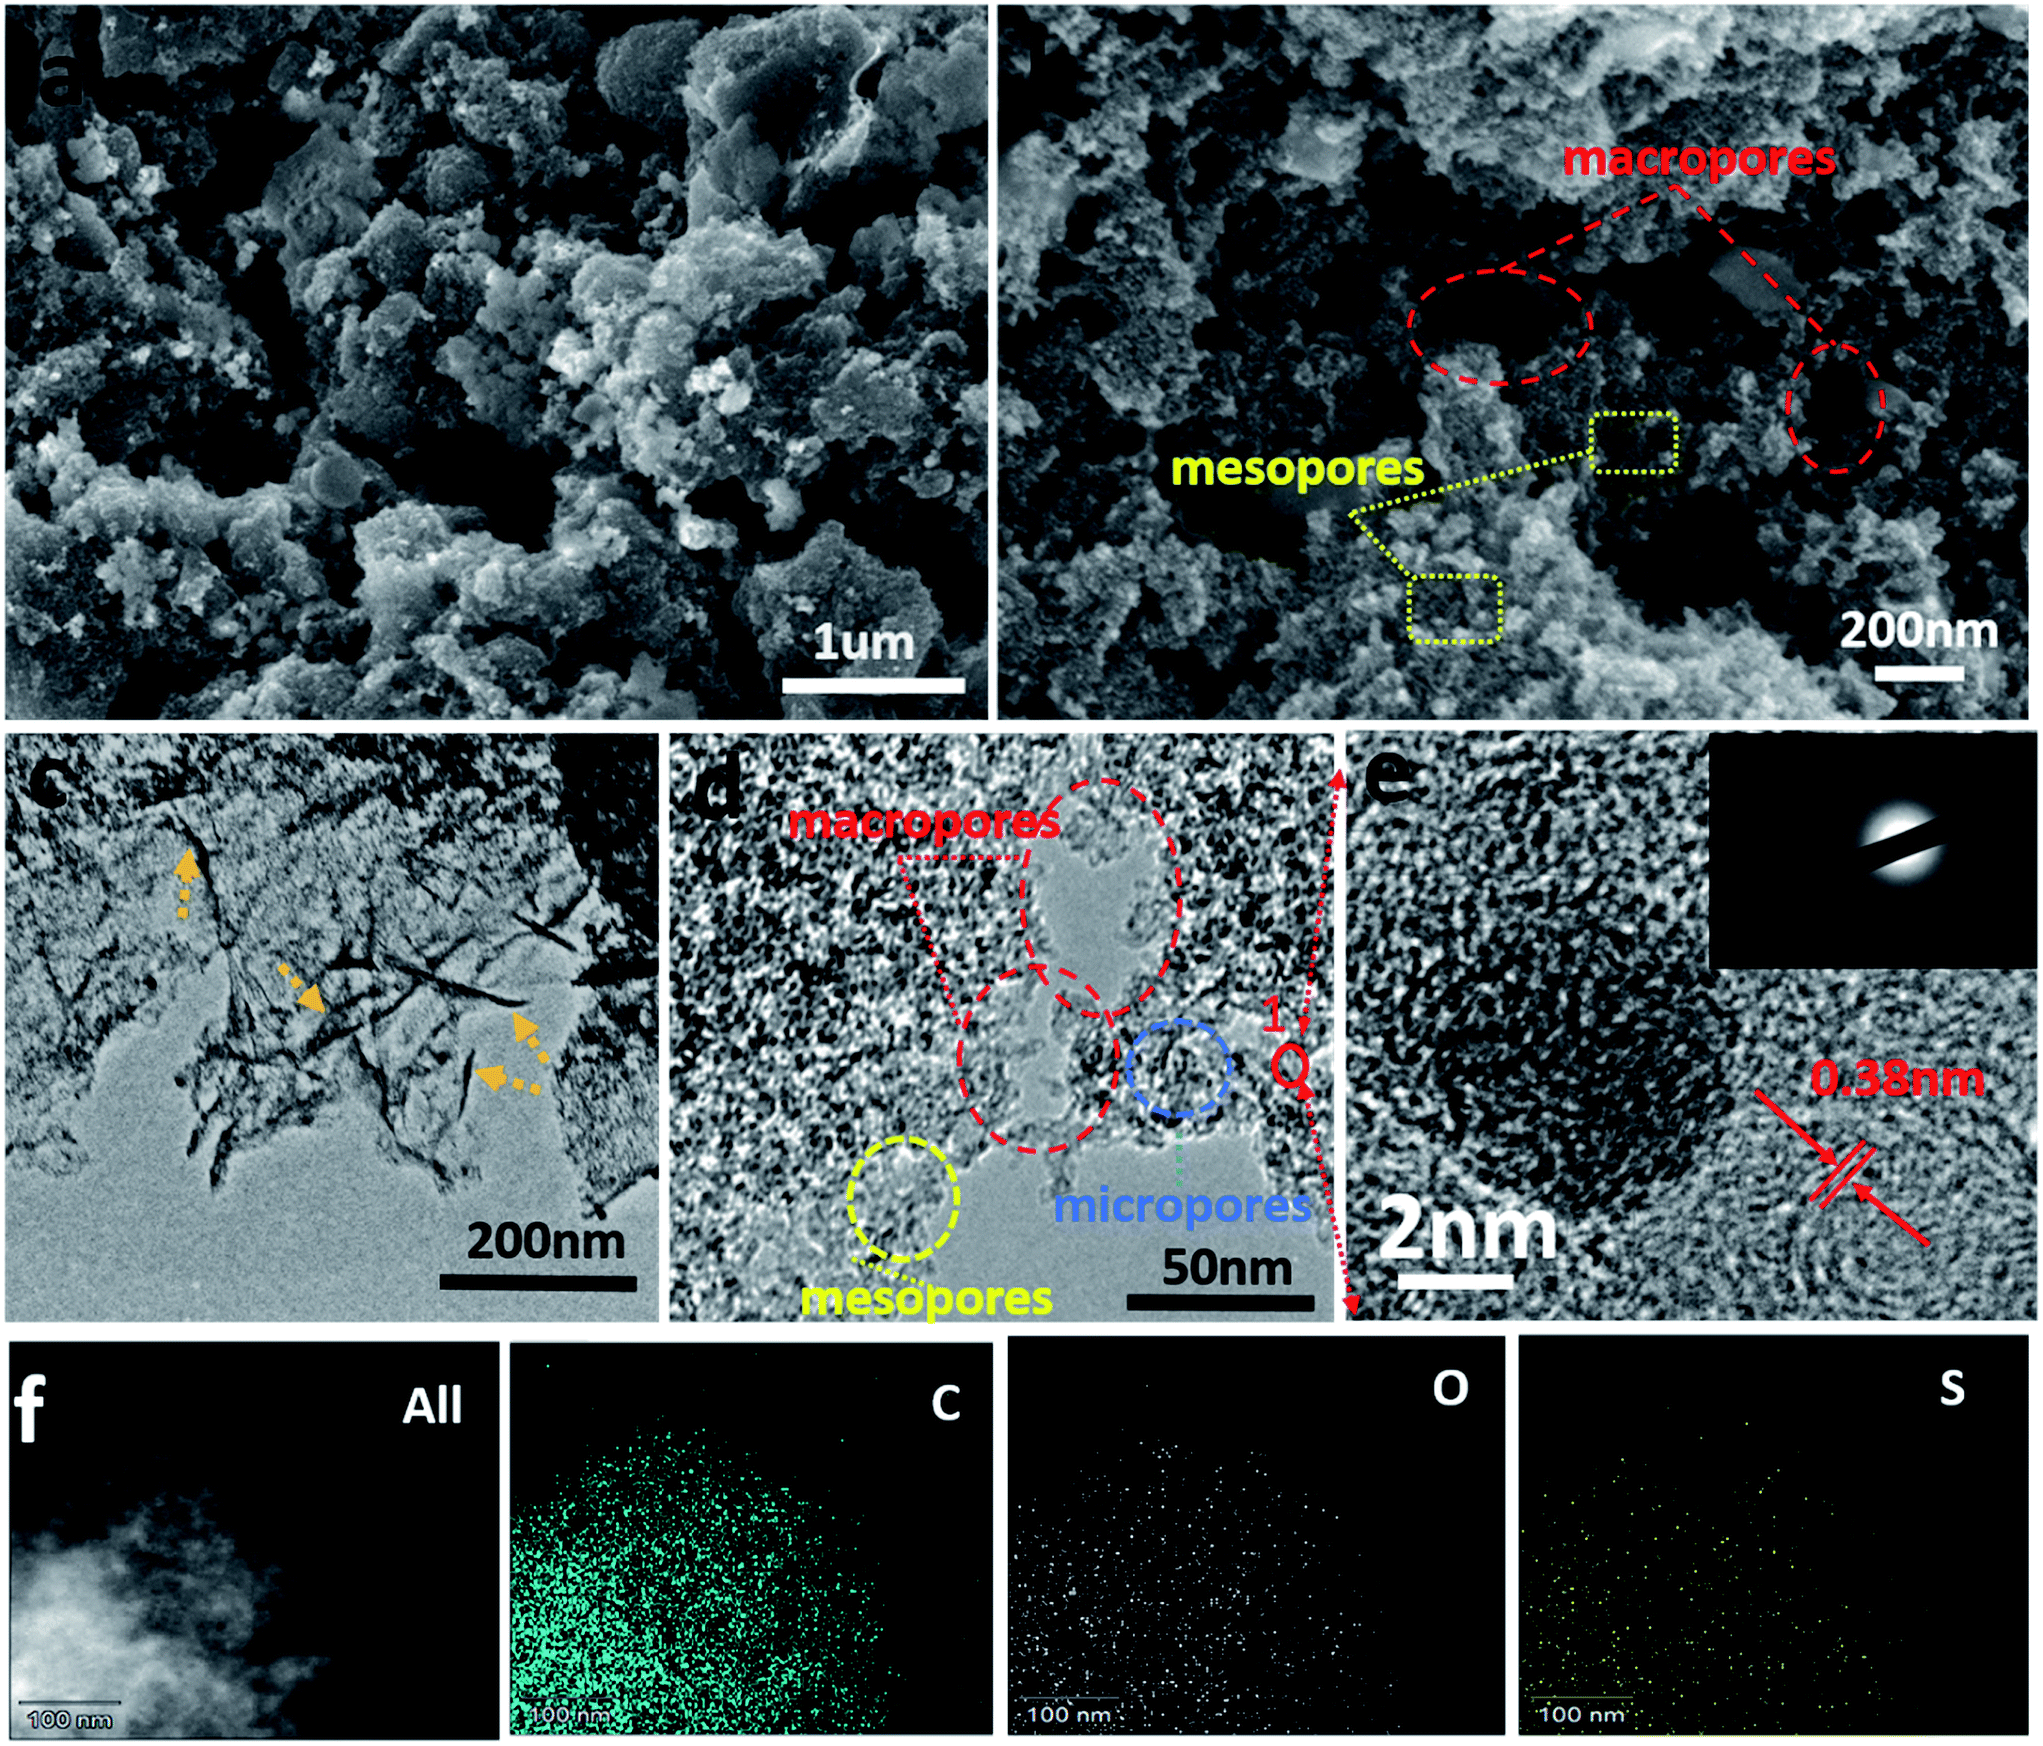 | ||
| Fig. 1 Morphological characterization results for S-PC-L-900. (a and b) FE-SEM, (c and d) FE-TEM, (e) high-resolution FE-SEM images, (f) EDS elemental maps. Red, yellow, and blue rings in (b) and (d) indicate the macropores, mesopores, and micropores of S-PC-L-900 respectively; the orange arrows in (c) show the graphene-like sheet wrinkle of S-PC-L-900; the inset in (e) is the SAED pattern of the area labeled 1 in panel (d). | ||
The XRD spectrum of all samples (Fig. S2†) reveal two broad peaks at 2θ angles of 23° and 43°, which are due to the amorphous carbon structure (002) and ordered hexagonal carbon structure (100), respectively. This result reveals the formation of the amorphous structure of porous carbon even at high carbonization temperature. This feature is consistent with the porous structure shown in Fig. 1.
Nitrogen adsorption–desorption analysis was used to determine the surface area and pore size distribution. As shown in Fig. 2a, all samples exhibit typical type IV isotherms with hysteresis loops. However, the remaining samples show similar hysteresis loops in the medium-pressure regions, while S-PC-L-900 show both medium- and high-pressure regions. The curve at a relative pressure of 0.45–0.75 can be classified as a typical model for mesoporous materials while that above 0.75 can be attributed to the multilayer adsorption in the macropores.42 It improves the abundance of macropores formed in S-PC-L-900, consistent with the SEM images. Fig. 2b shows the pore size distributions of samples. PC-S-900 has mesopore distributions similar to those of S-PC-L-700. The mesopore size distributions of the S-PC-L samples become broader and obviously shift to larger pore diameters with increasing carbonization temperature. The micropore volume of all the samples are similar.
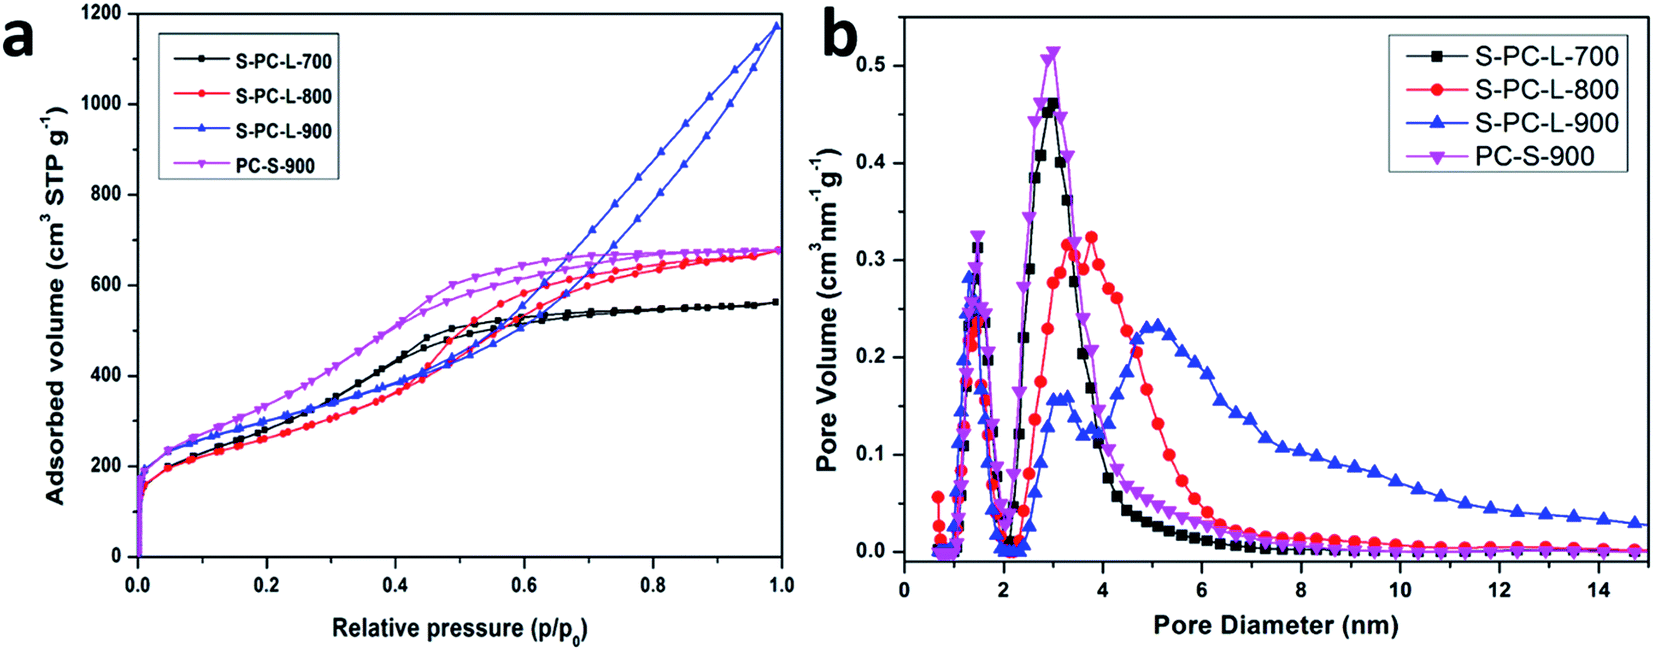 | ||
| Fig. 2 (a) Nitrogen adsorption–desorption isotherms; (b) pore size distributions of the samples calculated by non local density functional theory (NLDFT). | ||
The physicochemical properties of all samples are compiled in Table 1. PC-S-900 has the highest specific surface area (1330 m2 g−1). All S-PC-L samples have similar specific surface areas (1105, 952, and 1054 m2 g−1 for the S-PC-L-700, -800, and -900, respectively). However, the S-PC-L-900 had the highest total pore volume (1.73 cm3 g−1) and average pore diameter (7.33 nm). It is possible that the carbon network is not fully developed at low carbonization temperature, resulting in low pore volume and porosity (Fig. S1†). With the increase in carbonization temperature, carbon particles can form an interconnected sponge-like structure, as shown in Fig. 1b.43
| Samples | SBETa (m2 g−1) | Total pore volumeb (cm3 g−1) | Average pore diameterb (nm) | Element analysis | XPSc | ||||
|---|---|---|---|---|---|---|---|---|---|
| C% | H% | S% | C% | O% | S% | ||||
| a Brunauer–Emmett–Teller (BET) surface area.b Density functional theory (DFT).c Weight percentage of C, O, and S obtained from XPS. | |||||||||
| PC-S-900 | 1330 | 1.15 | 4.51 | 93.1 | 0.8 | 0.4 | 97.7 | 2.3 | 0 |
| S-PC-L-700 | 1105 | 0.96 | 5.42 | 73.4 | 0.2 | 6.8 | 87.9 | 5.4 | 6.7 |
| S-PC-L-800 | 952 | 1.03 | 6.30 | 72.0 | 0.3 | 5.7 | 89.2 | 5.6 | 5.2 |
| S-PC-L-900 | 1054 | 1.73 | 6.69 | 73.3 | 0.3 | 2.9 | 91.8 | 5.6 | 2.5 |
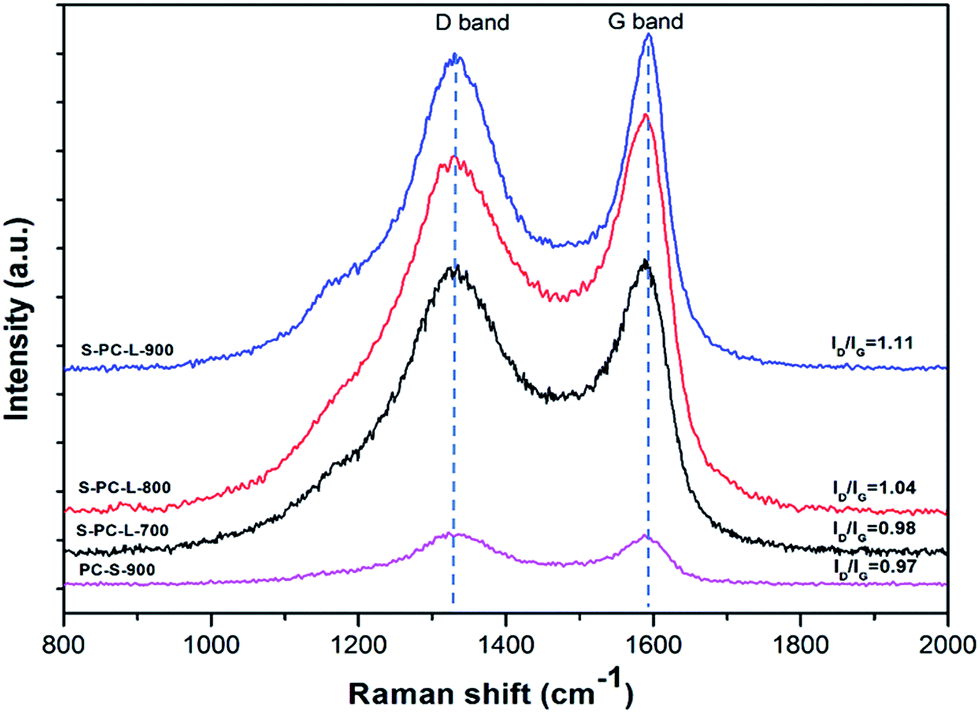
Further structural information on the samples was obtained by Raman spectra analysis. Two typical peaks at 1335 and 1590 cm−1 for all samples can be observed; these correspond to D and G bands, respectively (Fig. 3). The G band is associated with ideal graphitic carbon structure, whereas the D band corresponds to disordered carbon.43 The ratios of the G band to the D band (IG/ID) for S-PC-L-700, -800, and -900 are 0.98, 1.04, and 1.11, respectively. This is due to the higher carbonization temperature, which contributes to the formation of graphitic sp2 carbons.8
 | ||
| Fig. 3 Raman spectra of the samples. | ||
In order to explore the structural properties of the samples, four different peaks in the Raman spectra were obtained at 1163, 1332, 1499, and 1590 cm−1, which correspond to D4, D1, D3, and G bands, respectively (Fig. S3a–c†). D1 and D4 bands indicate disordered graphitic carbon while the D3 band indicates amorphous carbon.44,45 As shown in Fig. S3d,† the percentage of amorphous carbon decreases while percentage of ideal graphitic carbon increases with increasing carbonization temperature. The results demonstrate that higher carbonization temperature can induce graphitization.46
X-ray photoelectron spectroscopy (XPS) was utilized to obtain chemical composition of the elements. The high-resolution C 1s spectrum of S-PC-L-900 (Fig. 4a), -700 (Fig. S4a†), and -800 (Fig. S4c†) can be fitted with peaks at 284.8 eV (corresponding to C–C and C–S), 286.5 eV (C–O and C–S), 287.2 eV (C![[double bond, length as m-dash]](https://www.rsc.org/images/entities/char_e001.gif) O), 289.1 eV (–CO2−), and 291.2 eV (π–π*).47,48 The appearance of the π–π* shakeup satellite shows carbonization and aromatization features, which suggest good electrical conductivity of the materials.49 Fig. 4b is the corresponding high-resolution S 2p spectrum of S-PC-L-900, which can be deconvoluted into two types of doubles centered at 164 eV (S 2p3/2) and 165.3 eV (S 2p1/2) characteristic of thiophene sulfur (such as C–S–C).50,51 The peak at 168.8 eV corresponding to sulfone bridges (C–SOx–C) is also observable. The percentage of thiophene S increases while the sulfone S decreases with increasing carbonization temperature (Fig. 4b, S4b and d†). Element analysis reveals that S-PC-L carbonized at 700 °C contains 6.8 wt% sulfur (Table 1). With the increase in carbonization temperature to 800 °C and 900 °C, the S content decreases to 5.7 and 2.9 wt%, respectively. This may due to the decrease in sulfate, which is unstable at high temperature.50 Comparison by elemental analysis using XPS reveals that the bulk S content of the samples is higher than the surface content. This is understandable in that the surface functionalities have greater chance of elimination during carbonization.46
O), 289.1 eV (–CO2−), and 291.2 eV (π–π*).47,48 The appearance of the π–π* shakeup satellite shows carbonization and aromatization features, which suggest good electrical conductivity of the materials.49 Fig. 4b is the corresponding high-resolution S 2p spectrum of S-PC-L-900, which can be deconvoluted into two types of doubles centered at 164 eV (S 2p3/2) and 165.3 eV (S 2p1/2) characteristic of thiophene sulfur (such as C–S–C).50,51 The peak at 168.8 eV corresponding to sulfone bridges (C–SOx–C) is also observable. The percentage of thiophene S increases while the sulfone S decreases with increasing carbonization temperature (Fig. 4b, S4b and d†). Element analysis reveals that S-PC-L carbonized at 700 °C contains 6.8 wt% sulfur (Table 1). With the increase in carbonization temperature to 800 °C and 900 °C, the S content decreases to 5.7 and 2.9 wt%, respectively. This may due to the decrease in sulfate, which is unstable at high temperature.50 Comparison by elemental analysis using XPS reveals that the bulk S content of the samples is higher than the surface content. This is understandable in that the surface functionalities have greater chance of elimination during carbonization.46
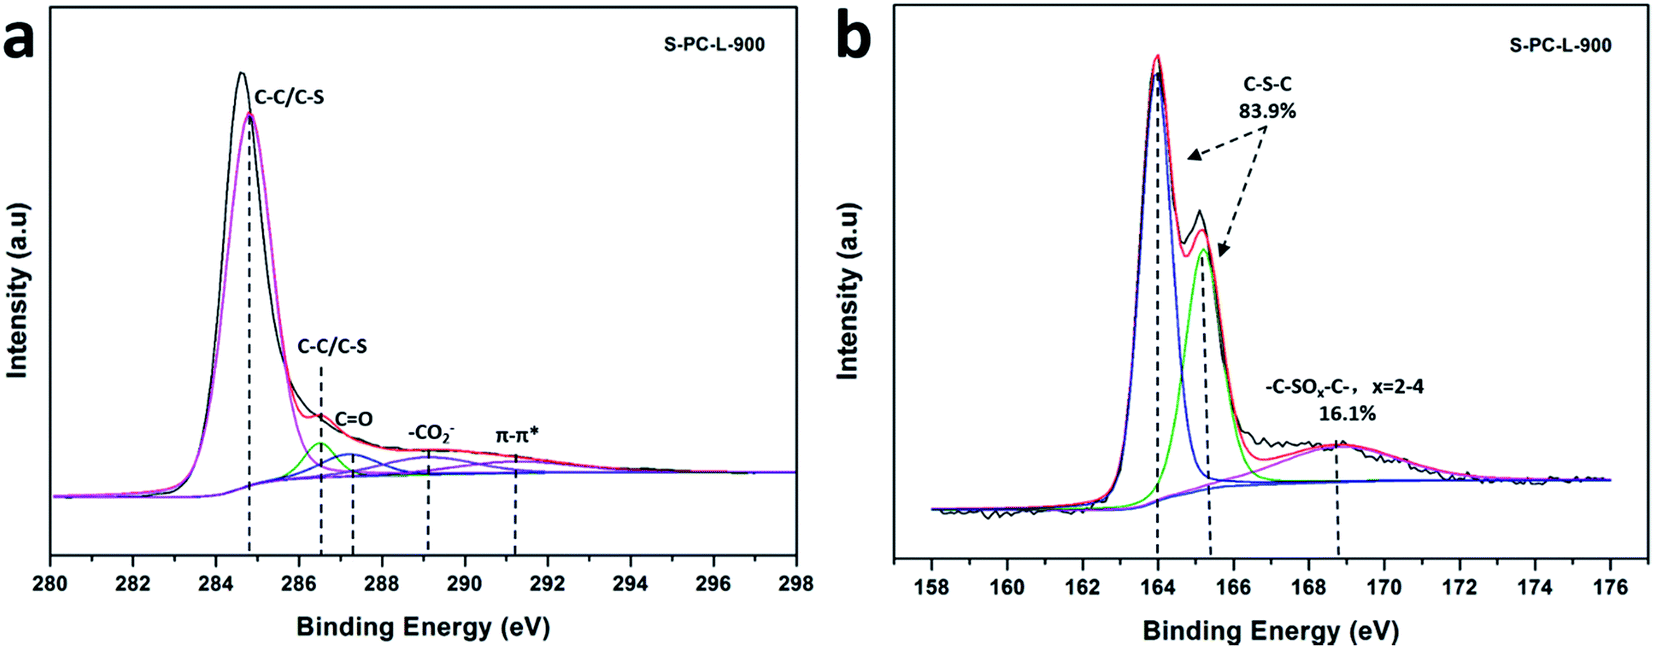 | ||
| Fig. 4 High-resolution C 1s (a) and S 2p (b) XPS spectra of S-PC-L-900. | ||
3.2 Electrochemical performance
The electrochemical performance of the samples was analyzed using 6 M KOH aqueous electrolyte in a three-electrode system. Fig. 5a shows the CV measurements at a scan rate of 50 mV s−1 in the potential range of −1 to 0 V. The CV curves for S-PC-L-700 exhibits a CV curve that is markedly more distorted than those of other samples. It may due to the low pore volume and abundant amorphous carbon. The samples of S-PC-L-800, -900, and PC-S-900 exhibit a nearly rectangular shape, which is characteristic of ideal supercapacitors.52 S-PC-L-900 shows the highest specific capacitance and obvious redox peaks as compared with the other samples. This may have resulted from the higher percentage of graphitic carbons and thiophene sulfur of S-PC-L-900. The decrease in inactive species (sulfate) may lead to exposure of more reversible pseudo-sites, which can further improve the capacitor performance.42 Firstly, higher electron density could be located at the surface because of the electron-rich sulfur. The enhanced electric dipole moment enlarged the total polarization, resulting the larger electrolyte dielectric constant. Secondly, a series of redox faradic reactions are carried out on the S-doped carbon at the additional sulfone and sulfoxide species. The pseudo-capacitive properties are related with oxidized sulfur species but facilitated by thiophene sulfur.53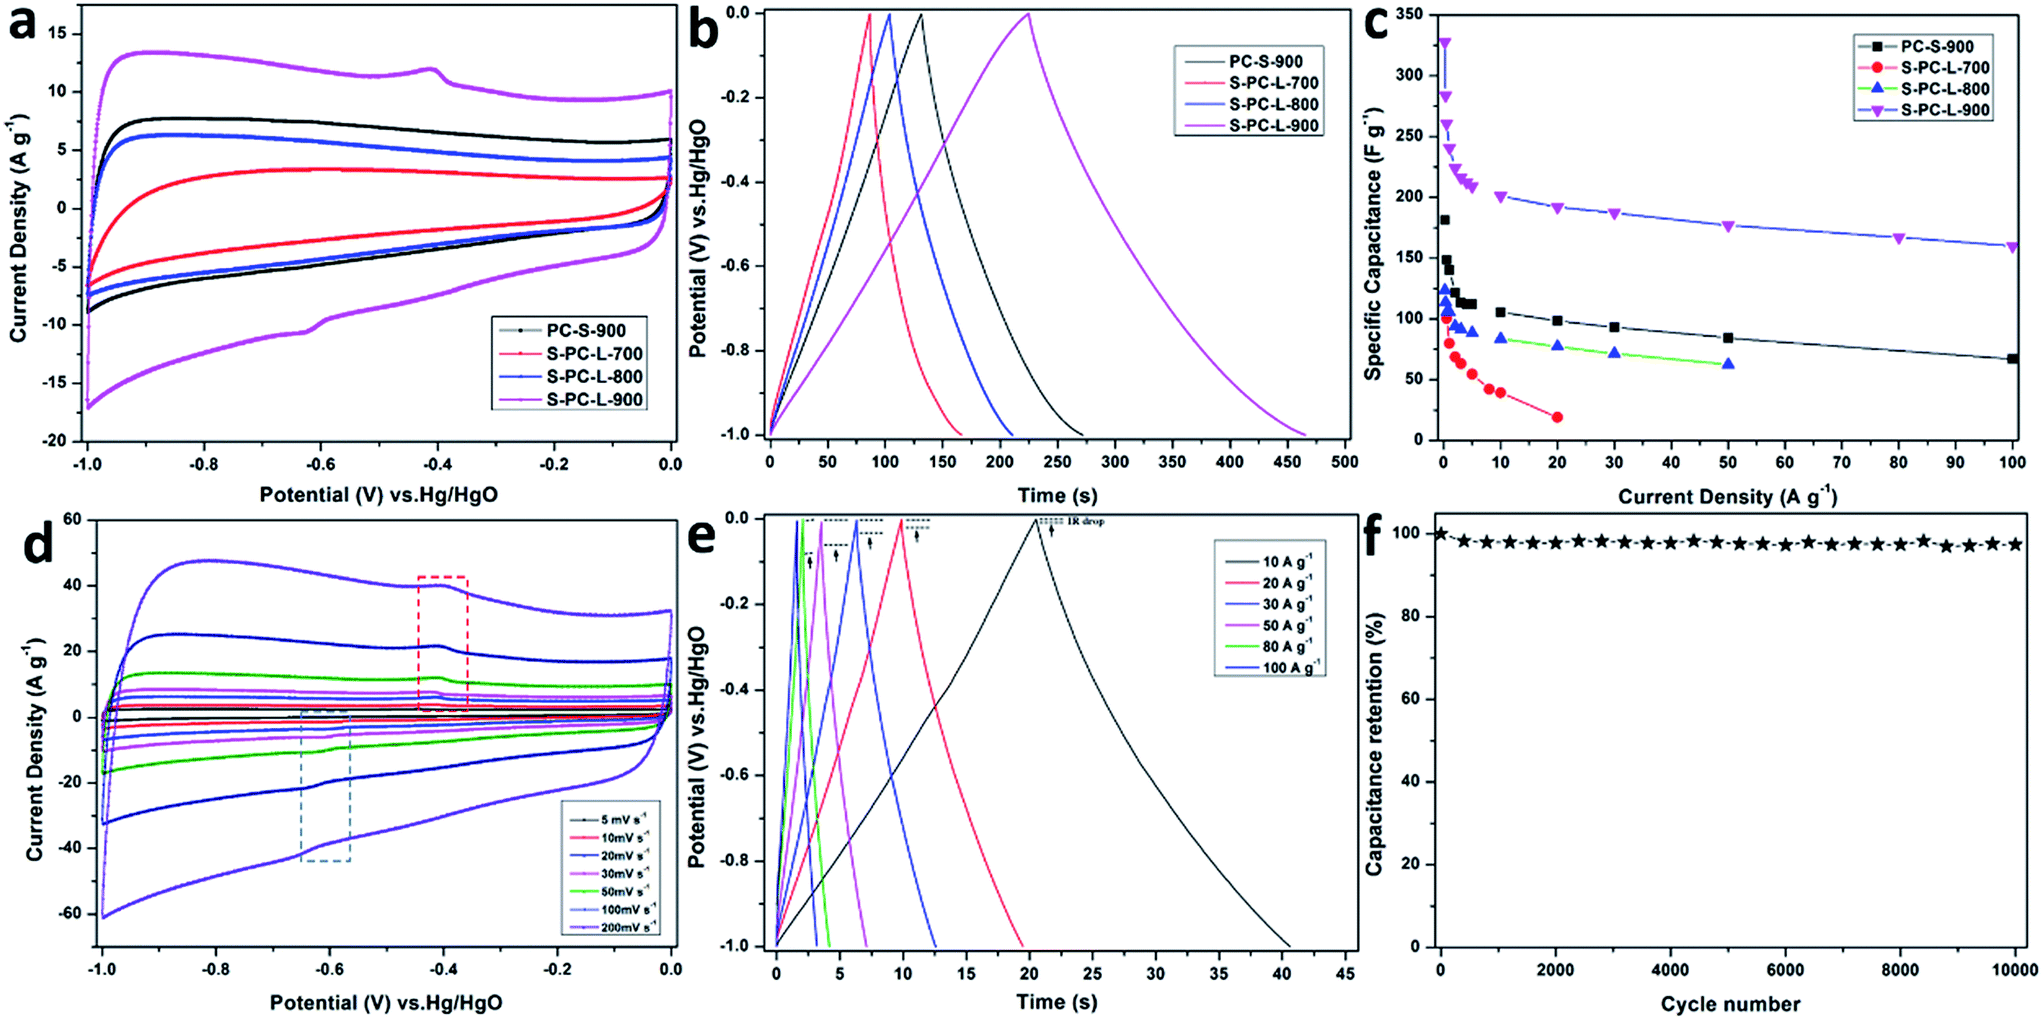 | ||
| Fig. 5 Electrochemical performance of the samples in 6 M KOH aqueous electrolyte in a three-electrode system. (a) CV curves at 50 mV s−1, (b) galvanostatic charge–discharge curves at 1 A g−1, (c) specific capacitance at various current densities, (d) CV curves of S-PC-L-900 at various scan rates, (e) galvanostatic charge–discharge curves of S-PC-L-900 at various current densities, and (f) capacitance retention of S-PC-L-900 versus number of cycles at 200 mV s−1. | ||
CV curves of all samples at scan rates from 5 to 200 mV s−1 are shown in Fig. 5d and S6a–c.† The results indicate that the CV curves of S-PC-L-700 are distorted from the rectangular shape. On the contrary, the CV curves of S-PC-L-800, -900, and PC-S-900 maintain a rectangular shape at various scan rates. The rectangular shape at 200 mV s−1 and magnified CV curve area of S-PC-L-900 suggest high capacity for charge storage and remarkable rate performance. As shown in the GCD curves of the samples at a current density of 1 A g−1 (Fig. 5b), S-PC-L-900 shows the longest charge–discharge time.
GCD curves of samples of S-PC-L-900, -800, and PC-S-900 at high current density (10 to 100 A g−1; Fig. 5e, S5e and f†) are highly linear and symmetrical, indicating that they have excellent electrochemical reversibility and columbic efficiency. Compared with that of the other samples, the IR drop of S-PC-L-900 is inconspicuous even at high current. This may due to the low internal series resistance, which can be demonstrated by EIS (Fig. S6†). GCD curves for S-PC-L-700 (Fig. S5d†) are extremely unsymmetrical, indicating inferior electrochemical property. Fig. 5c plots the gravimetric specific capacitance of all samples versus current density. S-PC-L-900 has the largest specific capacitance. The specific capacitances of S-PC-L-900 are 328, 260, 241, and 210 F g−1 at current densities of 0.2, 0.5, 1, and 5 A g−1, respectively. Otherwise, a specific capacitance of 192 F g−1 is obtainable even at 20 A g−1, showing excellent rate performance (73% capacitance retention after current density expending 40 times). The specific capacitance of S-PC-L-900 is almost twice that of PC-S-900 (98.4 F g−1 at 20 A g−1; 66% capacitance retention) and more than double that of S-PC-L-800 (77.2 F g−1 at 20 A g−1; 73% capacitance retention). These results indicate that introduction of sulfur7 and increasing the number of macropores increase the capacitive performance. The hierarchically S-doped macroporous frameworks can provide short and unimpeded diffusion channels for electrolyte ions even at high current density. Moreover, the cycling stability can be improved by the hierarchically S-doped macroporous frameworks. As shown in Fig. 5f, the capacitance retention for S-PC-L-900 remains 97% after 10000 cycles at a scan rate of 200 mV s−1, indicating excellent cycling stability. Besides, we also investigate the capacitive performance of S-PC-L-900 in H2SO4 and Na2SO4 aqueous electrolyte. The CV curves of S-PC-L-900 show a rectangular shape at a scan rate of 50 mV s−1 (Fig. S7a†) and GCD curves are linear and symmetrical at current densities of 1 A g−1 (Fig. S7b†). The results indicate that the S-PC-L-900 has good capacity for charge storage in both H2SO4 and Na2SO4 aqueous electrolyte. However, the S-PC-L-900 shows higher capacity in H2SO4 aqueous electrolyte than Na2SO4 aqueous electrolyte while both lower compared with KOH aqueous electrolyte (Fig. S7c†).
In order to investigate the capacitive performance of the electrode in a complete cell, a symmetric supercapacitor was assembled by employing two S-PC-L-900 specimens in 6 M KOH aqueous electrolyte. Fig. 6a shows the CV curves of S-PC-L-900 at scan rates of 10 to 1000 mV s−1. Even at very high scan rate (1000 mV s−1), the CV curve is still rectangular, indicating ideal capacitive behavior and rate performance. Furthermore, the GCD curves (Fig. 6b) of the S-PC-L-900 supercapacitor even at extremely high current density (inset, 5–30 A g−1) exhibit ideal symmetrical triangle without obvious IR drop, indicating excellent electrochemical reversibility and low internal resistance.10 The corresponding specific capacitance of S-PC-L-900 based on CV and GCD curves is shown in Fig. S8.† The maximum capacitance is 40.0 F g−1 at 10 mV s−1 and 49.8 F g−1 at 0.2 A g−1, respectively, higher than those for carbon-based symmetric supercapacitors.7
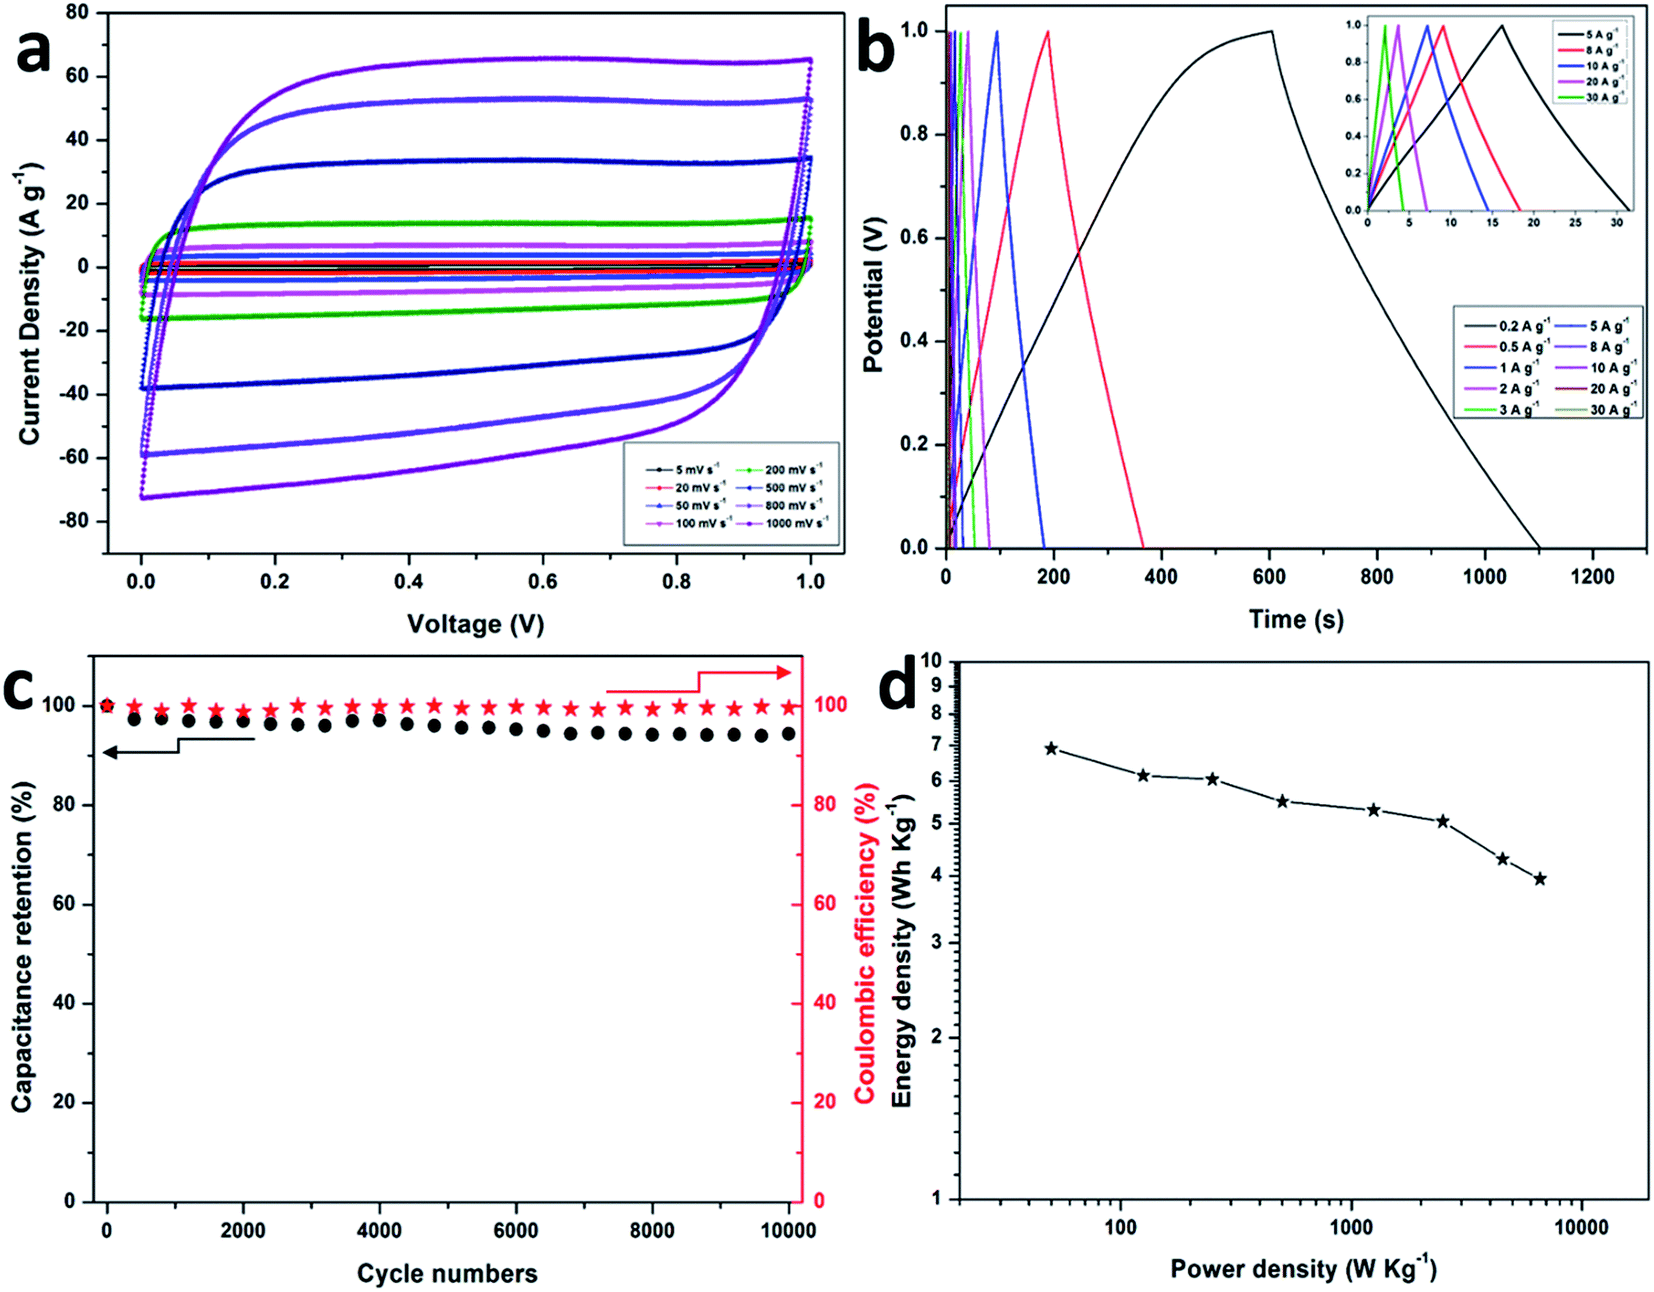 | ||
| Fig. 6 Electrochemical performance of the S-PC-L-900 in 6 M KOH aqueous electrolyte in a two-electrode system. (a) CV curves at scan rates of 5 to 1000 mV s−1. (b) GCD curves at current densities of 0.2 to 30 A g−1; the inset shows GCD curves at current densities of 5 to 30 A g−1. (c) Capacitance retention and coulombic efficiency versus the number of cycles at 2 A g−1. (d) Ragone plots of the S-PC-L-900 symmetric cell. | ||
To obtain further insight into the electrochemical stability of the as-prepared S-PC-L-900 hybrid, the capacitor in 6 M KOH electrolyte was measured at 2 A g−1 over 10000 cycles. As shown in Fig. 6c, the capacitance deterioration of S-PC-L-900 capacitor is less than 6% after 10000 cycles, and the coulombic efficiency remains at nearly 100%. Moreover, the S-PC-L-900 capacitor shows a high energy density (6.9 W h kg−1) at a power density of 50 W kg−1 (Fig. 6d), higher than that of previously reported carbon-based supercapacitors.10,54 The power densities of the carbon-based supercapacitors are shown in Fig. 6d. This improved performance can be explained by the S-doped macroporous structure, which could serve as ion-buffering reservoirs and affect ion pathways.55
4. Conclusions
In summary, we have fabricated hierarchically S-doped porous carbon through a simple template technique using by-products lignin as carbon and sulfur precursor. The obtained carbon sheet consists of interconnected open macropores, mesopores, and micropores. Because of its high surface area and wide pore size distribution, the as-obtained S-PC-L-900 exhibits a high specific capacitance (328 F g−1) at 0.2 A g−1, as well as excellent rate performance (73% capacitance retention after current density increase from 0.5 to 20 A g−1) and cycling stability (97% capacitance retention after 10000 cycles). Furthermore, the symmetric supercapacitor based on S-PC-L-900 delivers a high energy density (6.9 W h kg−1) at 50 W kg−1. This high electrocapacitive performance indicates that our hierarchically S-doped porous carbon provide a low-cost and ecofriendly biomaterial for next-generation energy storage applications.
Acknowledgements
This work is financially supported by the link project of the National Natural Science Foundation of China and Guangdong Province (No. U1401246), the Science and Technology Program of Guangdong Province of China (Grant No. 2014B010106005, 2015B010135011, 2015A050502047, 2016A020221031), the Science and Technology Program of Guangzhou City of China (Grant No. 201508030018, 2016201604030040), the National Nature Science Foundation of China Key Projects of Guangdong Joint Fund (U1401246) and the National Nature Science Foundation of China (51276044, 51302043).References
- Y. Sun, Q. Wu and G. Shi, Energy Environ. Sci., 2011, 4, 1113 CAS.
- Y. Meng, Y. Zhao, C. Hu, H. Cheng, Y. Hu, Z. Zhang, G. Shi and L. Qu, Adv. Mater., 2013, 25, 2326 CrossRef CAS PubMed.
- C. Long, X. Chen, L. Jiang, L. Zhi and Z. Fan, Nano Energy, 2015, 12, 141 CrossRef CAS.
- F. Zhang, T. Zhang, X. Yang, L. Zhang, K. Leng, Y. Huang and Y. Chen, Energy Environ. Sci., 2013, 6, 1623 CAS.
- H. Jiang, S. Lee and C. Li, Energy Environ. Sci., 2013, 6, 41 CAS.
- S. Faraji and F. N. Ani, J. Power Sources, 2014, 263, 338 CrossRef CAS.
- Y. Li, G. Wang, T. Wei, Z. Fan and P. Yan, Nano Energy, 2016, 19, 165 CrossRef CAS.
- Y. S. Yun, M. H. Park, S. J. Hong, M. E. Lee, Y. W. Park and H. J. Jin, ACS Appl. Mater. Interfaces, 2015, 7, 3684 CAS.
- J. Yin, D. Zhang, J. Zhao, X. Wang, H. Zhu and C. Wang, Electrochim. Acta, 2014, 136, 504 CrossRef CAS.
- Q. Xie, A. Zheng, S. Zhai, S. Wu, C. Xie, Y. Zhang and Y. Guan, J. Solid State Electrochem., 2016, 20, 449 CrossRef CAS.
- C. Portet, G. Yushin and Y. Gogotsi, J. Electrochem. Soc., 2008, 155, A531 CrossRef CAS.
- M. Lee, G. Kim, H. Don Song, S. Park and J. Yi, Nanotechnology, 2014, 25, 345601 CrossRef PubMed.
- B. Xu, S. Hou, G. Cao, F. Wu and Y. Yang, J. Mater. Chem., 2012, 22, 19088 RSC.
- O. Ioannidou and A. Zabaniotou, Renewable Sustainable Energy Rev., 2007, 11, 1966 CrossRef CAS.
- D. Jiménez-Cordero, F. Heras, M. A. Gilarranz and E. Raymundo-Piñero, Carbon, 2014, 71, 127 CrossRef.
- X. He, P. Ling, M. Yu, X. Wang, X. Zhang and M. Zheng, Electrochim. Acta, 2013, 105, 635 CrossRef CAS.
- Y. Liu, Z. Shi, Y. Gao, W. An, Z. Cao and J. Liu, ACS Appl. Mater. Interfaces, 2016, 8, 28283 CAS.
- H. Pińkowska, P. Wolak and A. Złocińska, Chem. Eng. J., 2012, 187, 410 CrossRef.
- R. J. A. Gosselink, W. Teunissen, J. E. G. van Dam, E. de Jong, G. Gellerstedt, E. L. Scott and J. P. M. Sanders, Bioresour. Technol., 2012, 106, 173 CrossRef CAS PubMed.
- S. Some, J. Kim, K. Lee, A. Kulkarni, Y. Yoon, S. Lee, T. Kim and H. Lee, Adv. Mater., 2012, 24, 5481 CrossRef CAS PubMed.
- H. L. Poh, P. Šimek, Z. Sofer and M. Pumera, ACS Nano, 2013, 7, 5262 CrossRef CAS PubMed.
- H. Liu, Y. Liu and D. Zhu, J. Mater. Chem., 2011, 21, 3335 RSC.
- X. Yu and H. S. Park, Carbon, 2014, 77, 59 CrossRef CAS.
- C. Long, D. Qi, T. Wei, J. Yan, L. Jiang and Z. Fan, Adv. Funct. Mater., 2014, 24, 3953 CrossRef CAS.
- J. S. Han, H. S. Kim and J. Neggers, Advances in Difference Equations, 2012, 2012, 19 CrossRef.
- L. F. Chen, Z. H. Huang, H. W. Liang, H. L. Gao and S. H. Yu, Adv. Funct. Mater., 2014, 24, 5104 CrossRef CAS.
- Z. Yang, H. Nie, X. Chen, X. Chen and S. Huang, J. Power Sources, 2013, 236, 238 CrossRef CAS.
- Y. Yan, Y. Yin, S. Xin, Y. Guo and L. Wan, Chem. Commun., 2012, 48, 10663 RSC.
- L. Yue, H. Zhong, D. Tang and L. Zhang, J. Solid State Electrochem., 2013, 17, 961 CrossRef CAS.
- G. Hasegawa, M. Aoki, K. Kanamori, K. Nakanishi, T. Hanada and K. Tadanaga, J. Mater. Chem., 2011, 21, 2060 RSC.
- W. Si, J. Zhou, S. Zhang, S. Li, W. Xing and S. Zhuo, Electrochim. Acta, 2013, 107, 397 CrossRef CAS.
- M. Sevilla, A. B. Fuertes and R. Mokaya, Int. J. Hydrogen Energy, 2011, 36, 15658 CrossRef CAS.
- Z. Yang, Z. Yao, G. Li, G. Fang, H. Nie, Z. Liu, X. Zhou, X. Chen and S. Huang, ACS Nano, 2012, 6, 205 CrossRef CAS PubMed.
- F. Shahzad, P. Kumar, S. Yu, S. Lee, Y. Kim, S. Man and C. Min, J. Mater. Chem. C, 2015, 3, 9802 RSC.
- M. Sevilla and A. B. Fuertes, ACS Nano, 2014, 8, 5069 CrossRef CAS PubMed.
- T. Liu, E. Liu, R. Ding, Z. Luo, T. Hu and Z. Li, Electrochim. Acta, 2015, 173, 50 CrossRef CAS.
- D. Kawashima, T. Aihara, Y. Kobayashi, T. Kyotani and A. Tomita, Chem. Mater., 2000, 12, 3397 CrossRef CAS.
- W. Gao, X. Feng, T. Zhang, H. Huang, J. Li and W. Song, ACS Appl. Mater. Interfaces, 2014, 6, 19109 CAS.
- F. Shahzad, P. Kumar, Y. H. Kim, S. M. Hong and C. M. Koo, ACS Appl. Mater. Interfaces, 2016, 8, 9361 CAS.
- K. Krishnamoorthy, M. Veerapandian, K. Yun and S.-J. Kim, Carbon, 2013, 53, 38 CrossRef CAS.
- Y. Zhan, J. Huang, Z. Lin, X. Yu, D. Zeng, X. Zhang, F. Xie, W. Zhang, J. Chen and H. Meng, Carbon, 2015, 95, 930 CrossRef CAS.
- W. Chen, J. Shi, T. Zhu, Q. Wang, J. Qiao and J. Zhang, Electrochim. Acta, 2015, 177, 327 CrossRef CAS.
- W. Chaikittisilp, M. Hu, H. Wang, H. Huang, T. Fujita, K. C.-W. Wu, L. Chen, Y. Yamauchi and K. Ariga, Chem. Commun., 2012, 48, 7259 RSC.
- A. Sadezky, H. Muckenhuber, H. Grothe, R. Niessner and U. Pöschl, Carbon, 2005, 43, 1731 CrossRef CAS.
- Z. Yang, J. Guo, S. K. Das, Y. Yu, Z. Zhou, H. D. Abruna and L. A. Archer, J. Mater. Chem. A, 2013, 1, 1433 CAS.
- Z. Li, Z. Xu, X. Tan, H. Wang, C. M. B. Holt, T. Stephenson, B. C. Olsen and D. Mitlin, Energy Environ. Sci., 2013, 6, 871–878 CAS.
- W. Ai, Z. Luo, J. Jiang, J. Zhu, Z. Du, Z. Fan, L. Xie, H. Zhang, W. Huang and T. Yu, Adv. Mater., 2014, 26, 6186 CrossRef CAS PubMed.
- M. Seredych, E. Rodríguez-Castellón, M. J. Biggs, W. Skinner and T. J. Bandosz, Carbon, 2014, 78, 540 CrossRef CAS.
- S.-A. A. Wohlgemuth, R. J. White, M.-G. G. Willinger, M.-M. M. Titirici and M. Antonietti, Green Chem., 2012, 14, 1515 RSC.
- S. Zhang, F. Yao, L. Yang, F. Zhang and S. Xu, Carbon, 2015, 93, 143 CrossRef CAS.
- S. Gao, H. Liu, K. Geng and X. Wei, Nano Energy, 2015, 12, 785 CrossRef CAS.
- R. B. Rakhi, W. Chen, D. Cha and H. N. Alshareef, J. Mater. Chem., 2011, 21, 16197 RSC.
- X. Zhao, Q. Zhang, C. M. Chen, B. Zhang, S. Reiche, A. Wang, T. Zhang, R. Schlögl and D. Sheng Su, Nano Energy, 2012, 1, 624 CrossRef CAS.
- T. Y. Kim, H. W. Lee, M. Stoller, D. R. Dreyer, C. W. Bielawski, R. S. Ruoff and K. S. Suh, ACS Nano, 2011, 5, 436 CrossRef CAS PubMed.
- B. G. Choi, M. Yang, W. H. Hong, J. W. Choi and Y. S. Huh, ACS Nano, 2012, 6, 4020 CrossRef CAS PubMed.
Footnote |
| † Electronic supplementary information (ESI) available. See DOI: 10.1039/c7ra00767a |
| This journal is © The Royal Society of Chemistry 2017 |