 Open Access Article
Creative Commons Attribution 3.0 Unported Licence
Effect of calcination temperature on the structure and catalytic performance of copper–ceria mixed oxide catalysts in phenol hydroxylation
Othmane Amadinea,
Younes Essamlalia,
Aziz Fihria,
Mohamed Larzekc and
Mohamed Zahouily *ab
*ab
aMAScIR Foundation, VARENA Center, Rabat Design, Rue Mohamed El Jazouli, Madinat El Irfane 10100-Rabat, Morocco. E-mail: m.zahouily@mascir.com
bLaboratoire de Matériaux, Catalyse et Valorisation des RessourcesNaturelles, URAC 24, Faculté des Sciences et Techniques, Université; Hassan II-Mohammedia, B.P. 146, 20650, Morocco
cMohammed VI PolytechnicUniversity, Lot 660-Hay Moulay Rachid, 43150 Ben Guerir, Morocco
First published on 21st February 2017
Abstract
We report on highly active CuO@CeO2 catalysts prepared by the surfactant-template method and calcined at different temperatures. Then the obtained catalysts were characterized by means of various analytical techniques. Our findings show that the BET surface area and pore volume of the CuO@CeO2 catalyst measured by N2 adsorption–desorption are decreasing with the elevation of calcination temperature. From the results of XRD and XPS, we determined the oxidation state of copper in the copper–ceria mixed oxide catalysts. The CuO@CeO2 catalysts displayed good catalytic activity for the phenol hydroxylation using H2O2 as an oxidant. Moreover, we found that the catalytic activity is improved for high calcining temperature and the optimum conditions were obtained when the catalyst CuO@CeO2 is calcined at 800 °C, which lead to higher phenol conversion of 54.62% with 92.87% of selectivity for catechol and hydroquinone. More importantly, the catalyst seems to be easily recovered by simple centrifugation. The results of catalyst recycling illustrated that the catalytic activity remained high even after five cycles with slight Cu leaching and slight loss of activity. Finally, a possible mechanism in phenol hydroxylation by H2O2 over CuO@CeO2 catalyst was also proposed.
1. Introduction
The degradation of phenol in wastewater using oxidation processes has attracted increasing interest compared to other traditional physico-chemical treatments such as adsorption and flocculation. The hydroxylation of phenol leads to hydroquinone (HQ) and catechol (CAT) formation, which are used as raw materials in synthesizing many valuable products namely photographic film developers, antioxidants, polymerization inhibitors, medicines, and cosmetic products.1,2 Over the years, phenol hydroxylation has been widely investigated using classical catalysts such as soluble iron and cobalt salts in the Brichima process3 and strong homogeneous acids such as phosphoric and perchloric acids in Rhone-Poulenc process.4 However, these processes have many disadvantages regarding to solvents toxicity and catalysts recyclability as well as low yield to dihydroxybenzenes. To overcome these issues, heterogeneous catalysis was proposed to be a promising alternative. Therefore, the design of suitable heterogeneous catalysts for hydroxylation reaction has gained interest of scientific community. Recently the hydroxylation of phenol has been developed using various heterogeneous catalysts such hydrotalcite,5,6 metallic nanoparticles,7 zeolites,8,9 metal oxides10 and mesoporous materials.11 Nevertheless, some of these catalytic systems possess slow activity and low stability and require additional energy sources such as ultraviolet or visible light irradiation making this process costly.12–14 Besides, the ceria has attracted great interest in heterogeneous catalysis due to its wide accessibility, no toxicity and excellent stability.15–19 The ceria can act as catalyst by itself or as support for other active phases, due to the high oxygen mobility originating from storing and releasing O2 through the Ce4+/Ce3+ redox couple.20,21 This oxide has been widely used as catalyst or support catalyst for various chemical transformations.15–19 Moreover, the catalytic activity could be significantly enhanced if other metal ions such as Cu ions were doped into the CeO2 because of the strong interaction of ceria with Cu ions.19 The CuO@CeO2 mixed oxides have become then an efficient catalyst for various reactions, such as the combustion of methane, water–gas shift,22 preferential CO oxidation,22 NO reduction.23 Actually, many investigations about the roles played by ceria and copper species in CuO@CeO2 catalysts have been extensively studied, and it was found that the active species sites for reactants as well as the roles of the Cu and CeO2 were distinctive in different reactions. Ce species might not be a simple spectator but rather play a direct role in the catalytic process.24,25 The ceria species could hinder Cu sintering, form strong interactions at CuO–CeO2 structures and enhance the thermal stability.26 In addition, many studies demonstrated that the Cu partly integrated into CeO2 lattice could form a Cu–O–Ce solid solution along with the formation of oxygen vacancies, which promoted the Ce3+/Ce4+ redox cycle and oxygen mobility.27 Keeping that in mind, the possible synergetic effects that could be a consequence of highly dispersed Ce and Cu oxides entrapped in the matrix of CuO@CeO2 structure, increasing the number of active sites leading to efficient catalytic activity for the activation of H2O2. In this study, we examined the synthesis and characterization of CuO@CeO2 mixed oxides and their applications as efficient reusable heterogeneous catalysts for the phenol hydroxylation in presence of H2O2 as an oxidant under mild reaction conditions (Scheme 1). The solid catalysts were characterized by various techniques, such as nitrogen adsorption–desorption isotherm, scanning and transmission electronic microscopy, FTIR, XRD, and XPS. The effect of calcination temperature on the structure, composition and on the catalytic performance was investigated in this study.2. Experimental
2.1 Preparation of CuO@CeO2 catalysts
The CuO@CeO2 mixed oxides was prepared by the co-precipitation method. In typical procedure 3.1761 g of cetyltrimethyl ammonium bromide (CTAB) was dissolved in deionized water of 200 mL, followed by the addition 7.5688 g of Ce(NO3)3·6H2O and 1.1406 g of Cu(NO3)2·3H2O. Subsequently, the mixture was stirred for 30 min, after which a solution of aqueous ammonia was added until a basic pH (≥11) under continuous stirring. The reaction took place under vigorous stirring during 4 h, at 90 °C. The obtained solid was collected by centrifugation, and washed thoroughly with water and ethanol. The solid was dried overnight at 100 °C under vacuum then calcined at the desired temperatures for 12 h. The copper loading on the copper–ceria mixed oxide catalysts was 4.6 wt%.2.2 Characterization of CuO@CeO2
Thermo-gravimetric analysis (TGA) was conducted under air in a TA Instrument Q500 apparatus, with a 10 °C min−1 ramp between 25 and 1000 °C. Fourier transform infrared (FT-IR) spectra of samples in KBr pellets was measured on a Bruker Vector 22 spectrometer. X-ray diffraction patterns were obtained at room temperature on a Bruker AXS D-8 diffractometer using Cu–K radiation in Bragg–Brentano geometry (−2). TEM micrographs were obtained on a Tecnai G2 microscope at 120 kV. High-resolution transmission electron microscopy analysis was carried out on a Jeol 2100F microscope, equipped with a high-resolution pole piece, field emission gun and operating at 200 kV. The gas adsorption data was collected using a Micromeritics 3Flex Surface characterization analyzer, using N2. Prior to N2 sorption, all samples were degassed at 150 °C overnight. The specific surface areas were determined from the nitrogen adsorption/desorption isotherms (at −196 °C), using the BET (Brunauer–Emmett–Teller) method. Pore size distributions were calculated from the N2 adsorption isotherms with the “classic theory model” of Barrett, Joyner and Halenda (BJH).28 XPS studies were carried out in a Kratos Axis Ultra DLD spectrometer equipped with a monochromatic Al-KX-ray source (1486.6 eV) operating at 150 W, a multi-channel plate and delay line detector under 1.0 × 10⁻⁹ Torr vacuum. The survey and high-resolution spectra were collected at fixed analyzer pass energies of 160 and 20 eV respectively. The instrument work function was calibrated to give an Au 4f7/2 metallic gold binding energy of 83.95 eV. The spectrometer dispersion was adjusted to give a binding energy of 932.63 eV for metallic Cu 2p3/2. Samples were mounted in floating mode in order to avoid differential charging; charge neutralization was required for all samples. The electronic binding energy of C 1s (284.80 eV) was used as the internal standard. The data was analyzed with commercially available software, Casa XPS. The individual peaks were fitted by a Gaussian (70%)–Lorentzian (30%) (GL30) function after Shirley-type background subtraction. The copper was determined by inductively coupled plasma atomic emission spectroscopy (ICP-AES) from JabinYvan.2.3 Hydroxylation of phenol
The catalytic phenol hydroxylation was performed in thermo-stated equipped with magnetic stirrer and a reflux condenser. The reactor was charged with a mixture of 0.47 g of phenol, 0.05 g of CuO@CeO2 and 10 mL of deionized water. Under stirring to ensure the sufficient dispersion of the catalyst. After drop-wise addition of H2O2 (the molar ratio of phenol/H2O2 was 3/1), the resulting mixture was heated at 80 °C for 3 h under stirring. The reaction products were identified, and quantified by high-performance liquid chromatography (HPLC Shimadzu Kyoto, Japon) equipped with a reversed-phase C18 column (150 mm L × 4.6 mm × 5 μm) using the methanol/water ((40/60), volume ratio) as the mobile phase at the flow rate of 0.5 mL min−1 with UV detection at 190 nm.3. Results and discussion
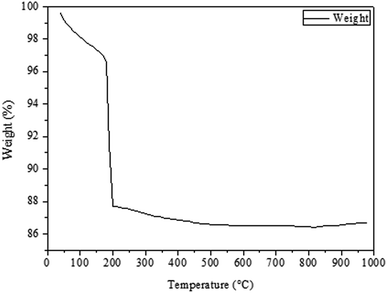
Fig. 1 shows the TGA curve of the dried CuO@CeO2 sample prepared by the co-precipitation method (Fig. 1a). It can be seen there are two weight losses. A first weight loss centered at 50 °C relates to the loss of water molecules physisorbed on the surface of CuO@CeO2. A second large weight loss between 150 and 500 °C, which can be attributed to the degradation organic molecules (Fig. 1b). Almost no weight loss and no thermal effect were observed at above 500 °C, which indicates that no thermal decomposition occurs above this temperature. Hence, we decided to calcine the as prepared CuO@CeO2 samples at 400, 500, 600, 700, and 800 °C for 12 h under flowing air.Fig. 2 shows the XRD patterns of CuO@CeO2 catalysts calcined at different temperatures. For comparison, all the catalysts exhibited the typical patterns of cubic phase of ceria with cubic fluorite structure and the space group Fm3m (JCPDS card no. 34-0394). No crystalline phase attributed to CuO or Cu species was observed in CuO@CeO2 catalysts, probably due to the small amount of copper or the formation of a solid solution Cu–O–Ce or combination between these two phenomena.29,30 With the increment of the calcination temperature, the diffraction peaks of CeO2 phase became more narrow and intense, as a result of a characteristic change in average crystalline size. The average crystallite sizes of all the samples estimated according to Scherrer equation are given in Table 1. It is clear that the crystallite size values of the samples are found to increase from 8 to 28.7 nm with increasing in calcination temperatures from 400 to 800 °C. This increase in crystallite size may be attributed to the Oswald ripening process assisted by the elevated temperature, this a diffusion process where the particles are getting bigger and bigger at the expense of small particles as described elsewhere.31 Compared to XRD patterns of the pure CeO2, the diffraction peaks of the CuO@CeO2 samples shifted to lower angles (inset, Fig. 2). The lattice constants of the samples were further calculated for comparison and the results are also listed in Table 1. It can be seen that the calculated lattice constants of all the samples were much higher than that of pure CeO2 (5.4043 Å). The preserving of the crystallographic structure of the ceria and the increment of the lattice parameter indicating more copper species were incorporated into the CeO2 lattice and thus more amounts of oxygen vacancies were formed in the catalyst.32,33 It should be noted that the XRD patterns of the three samples calcined from 600 to 800 °C displayed a slight shift in the CeO2 diffraction peaks to higher 2θ values (Fig. 2b), which indicates the lattice expansion. The lattice parameter of CeO2 also decreased from 0.4086 to 0.4064 nm for the samples calcined in this temperature range. The decrease in the lattice parameter of the samples may be related to the fact that Cu2+ has been substituted into the CeO2 lattice and altered the unit cell parameter of CeO2 because of the smaller ionic radius of Cu2+ (0.72 Å) than that of Ce4+ (0.97 Å).34,35
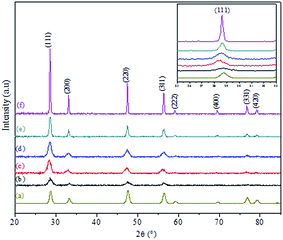 | ||
| Fig. 2 XRD patterns of (a) CeO2 and CuO@CeO2 calcined samples: (b) 400 °C, (c) 500 °C, (d) 600 °C, (e) 700 °C and (f) 800 °C. | ||
| Samples | Cell parameter (Å) | Crystallite sizea (nm) | Particles sizeb (nm) | Surface area (m2 g−1) | Pore volume (cm3 g−1) | Pore diameter (nm) |
|---|---|---|---|---|---|---|
| a Calculated from the Scherer's equation.b Evaluated by TEM. | ||||||
| CeO2 | 5.4043 | 6.5 | — | 132 | 0.4834 | 11.5 |
| CuO@CeO2-400 °C | 5.4050 | 8 | 6.7 | 144 | 0.3778 | 12.63 |
| CuO@CeO2-500 °C | 5.4091 | 9 | 8.9 | 153 | 0.4231 | 12.59 |
| CuO@CeO2-600 °C | 5.4086 | 9.5 | 9.4 | 136 | 0.3354 | 12.49 |
| CuO@CeO2-700 °C | 5.4068 | 21.2 | 19.2 | 32 | 0.1085 | 9.87 |
| CuO@CeO2-800 °C | 5.4064 | 27.8 | 26 | 8 | 0.0998 | 9.69 |
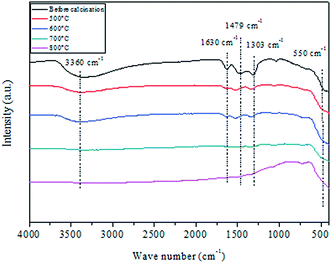
Fig. 3 shows FTIR spectra in the 400–4000 cm−1 range of CuO@CeO2 before and after thermal treatment at different temperatures ranging from 400–800 °C. The five spectra show a group of strong intense bands at 3360 and 1630 cm−1 which may be attributed to the –OH stretching vibration and to the H2O bending vibration, respectively.36,37 The band centered at 1479 cm−1 can be attributed to the CH3 organic group derived from the CTAB surfactant. The fingerprint of ceria is assigned in FTIR spectroscopy to the Ce–O–Ce stretching vibration, which is detected toward 400 cm−1.38,39 Indeed, that all spectra are similar in the existence of the characteristic band, indicating that the base framework of the structure does not change when ceria is loaded with copper species. Finally, all absorption bands corresponding to vibrations of water molecules adsorbed (3360 and 1630 cm−1) and residual nitrate in 1303 cm−1, disappeared after calcination at 700 °C, which indicates that the organic component has been removed from the CuO@CeO2 sample.
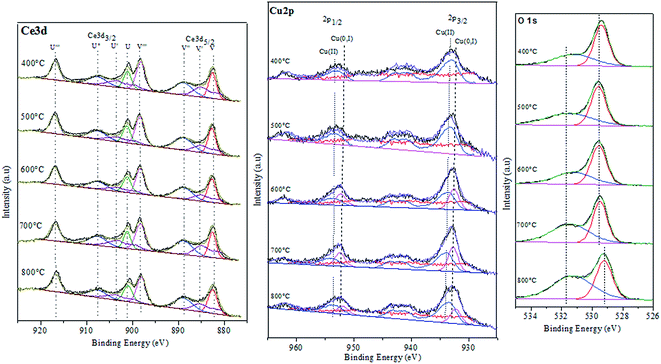
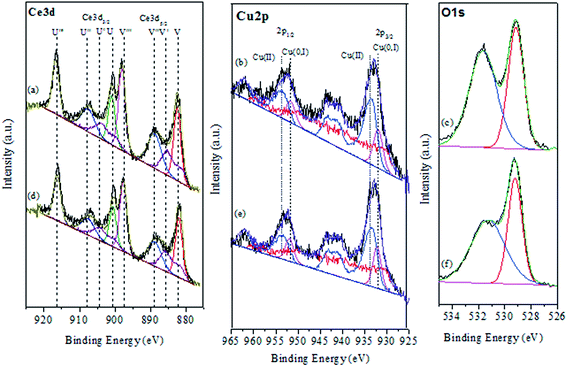
To investigate chemical states and the compositions in the content on the surface of the CuO@CeO2 calcined at different temperatures, the XPS measurements were carried out and the XPS spectra of Ce 3d, Cu 2P, and O 1s were obtained, as shown in Fig. 4. The relative concentration of different oxidation states of Ce, Cu and O are summarized in Table 2. As shown in Fig. 4a the Ce 3d XPS spectra indicated the existence of two oxidation states of cerium Ce4+ and Ce3+. The main peaks located at 917.2 (u′′′) and 898 eV (v′′′) are associated with the final state of the 3d104f0 configuration of Ce4+ ions.40 While, the peaks located at 904.1 (u′) and 885.5 eV (v′) corresponding to the initial electronic state 3d104F1 of Ce3+ ions.41 The corresponding Cu 2p XPS spectra for all of the CuO@CeO2 samples are shown in Fig. 4b. Based on the peak-fitting deconvolution of the main peak of the Cu 2p3/2 we note the existence of a peak at 933.5 eV characteristic of divalent cations Cu2+ in all of the samples. In addition, we observed the appearance of a peak located at 932.5 eV for the sample calcined at a temperature above 600 °C. This peak could be attributed to the reduction of Cu2+ to Cu+. The formation of this species is favored by the presence of Ce3+, which facilitating the redox equilibrium (Ce3+ + Cu2+ ↔ Ce4+ + Cu+).42 Indeed, the reduction of Cu2+ to Cu+ indicating the presence of a strong interaction between Cu clusters and CeO2.43 The fitting procedures of the O 1s of the CuO@CeO2 samples are shown in Fig. 4c. The O 1s spectrum reveals the presence of two peaks, which the first peak located between 529 and 530 eV is generally characteristic of the lattice oxygen forming the fluorite structure with cerium. While the second peak at about 531.5 eV can be attributed to the chemisorbed oxygen by the material as the carbonate or hydroxyl groups.44 Moreover, we observed that there is a slight shift of the peaks characteristic of oxygen structure of CuO@CeO2 towards lower energies when the temperature calcination increase from 400 to 800 °C, which indicates the appearance of a new chemical environment for oxygen. The formation of this Ce–O–Cu can be responsible for the observed shift.45
| Samples | Surface element (%) | |||
|---|---|---|---|---|
| Ce3+ | Ce4+ | Cu2+ | Cu+ | |
| CuO@CeO2-400 °C | 25 | 75 | 100 | — |
| CuO@CeO2-500 °C | 20 | 80 | 100 | — |
| CuO@CeO2-600 °C | 20 | 80 | 50.28 | 49.72 |
| CuO@CeO2-700 °C | 25 | 75 | 48.57 | 51.43 |
| CuO@CeO2-800 °C | 20 | 80 | 62.71 | 37.29 |
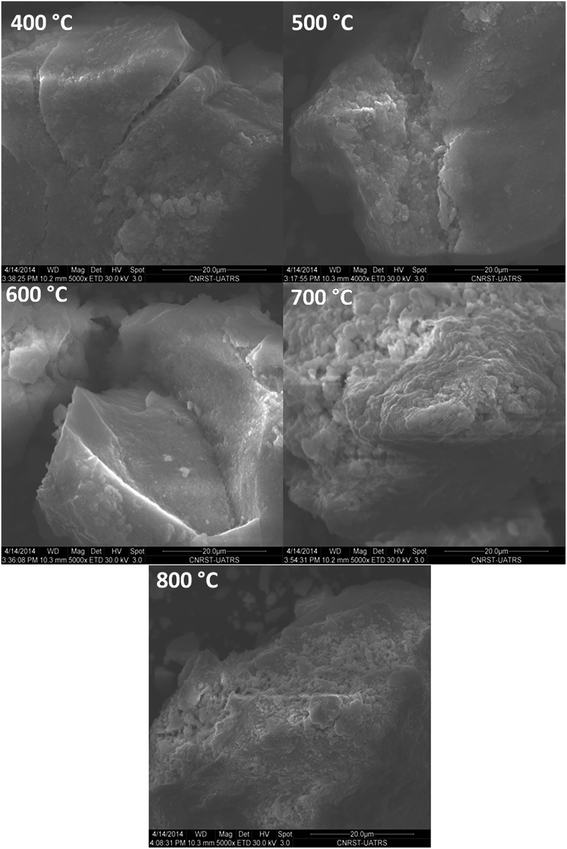
The morphology of the surface of CuO@CeO2 calcined at different temperatures was investigated by SEM. As shown in Fig. 5, homogeneous microstructures were observed for all the materials consisting of crystallites having various size and forms with an irregular surface roughness. Additionally, the calcination temperature didn't clearly influence on the morphology of CuO@CeO2 samples.
The typical TEM images of the prepared CuO@CeO2 at different calcination temperatures and the particles sizes of all the samples calculated by TEM are given in Fig. 6a–m and Table 1, respectively. The micrographs obtained for the CuO@CeO2 samples calcined at 400 and 500 °C show well-dispersed particles where smaller particle sizes can be observed ranging from 6.7 to 26 nm. However, the particle size of CuO@CeO2 increased significantly with increasing the calcination temperature from 500 to 800 °C. When calcination temperature rose to 800 °C (Fig. 6m), the CuO@CeO2 particles seem to be agglomerated and forming heterogeneous aggregates of nanoparticles and the mean particle diameter increased from 6.7 to 26 nm. This observation can be explained by the Ostwald ripening process where small nanoparticles merge to form large nanoparticles. This above finding indicated that the particle size was dependent on calcination temperature, which was also in agreement with the result of XRD pattern.
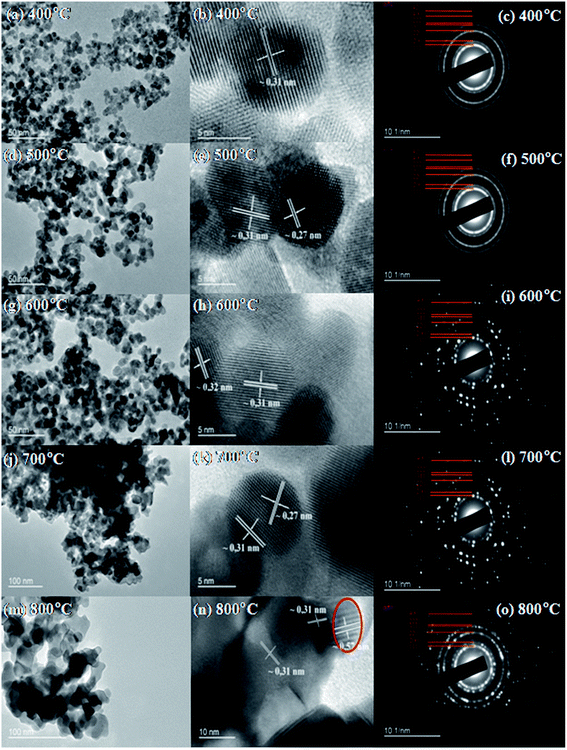 | ||
| Fig. 6 Representative TEM (a–m), HRTEM (b–n) images and SAED (c–o) pattern of calcined CuO@CeO2 samples. | ||
The HR-TEM technique was also used in order to analyze mostly the local structure and the inter-planar distances of the CuO@CeO2 calcined at a different temperature. The images (b)–(n) in Fig. 6 show the representative HR-TEM images of CuO@CeO2. These images show the arrangement of nanoparticles in this structure, which is characterized by its special egg or ellipsoid shape. The lattice spacing was determined to be 0.31 nm which correspond to the lattice d(111) interplant spacing of the fluorite structure of ceria. These analyses corroborate what is observed by the SEAD (Fig. 6c–o).
Fig. 7a shows the isotherms for the CuO@CeO2 samples calcined in the temperature range of 400 to 800 °C. The N2 adsorption–desorption isotherms of CuO@CeO2 are assigned to type IV isotherms with the H4 type of hysteresis according to IUPAC classification,46,47 which characteristic of a material mesoporous. In addition, we observed that there is a decrease in the volume of nitrogen adsorbed with increasing calcination temperature, which leads to a reduction in the BET surface area. The BET surface area, pore volume and pore diameter of the CuO@CeO2 samples calcined at different temperatures are summarized in Table 1. It can be seen that there is a continuous increase in the BET surface area and the pore volume from 144 to 153 m2 g−1 and 0.3778 to 0.4231 cm3 g−1 with increasing the calcination temperature from 400 to 500 °C respectively, which can be explained by the elimination of organic matter in our samples. However, when the temperature increase from 500 to 800 °C the surface area and pore volume decrease from 153 to 8 m2 g−1 and 0.4231 to 0.0998 cm3 g−1 respectively. The subsequent decline in the surface area upon thermal treatment at a higher temperature could be due to the increase in particle size and the degree of agglomeration of CuO@CeO2 samples under an effect of temperature. Indeed, the corresponding pore size distribution of CuO@CeO2 calcined at different temperatures was calculated by the BJH method and was plotted in Fig. 8b. The materials presented mesopores width distribution in the range between 12.63 and 9.69 nm. Furthermore, the pore size distribution of CuO@CeO2 shows an increase from 12.59 to 12.63 nm during the calcination of CuO@CeO2 at 500 °C. When the calcined temperature increased from 500 to 800 °C, the pore size distribution of CuO@CeO2 decreased from 12.63 to 9.69 nm. These results can be due to the particle agglomeration, which leads to sintering to form pores of smaller sizes.
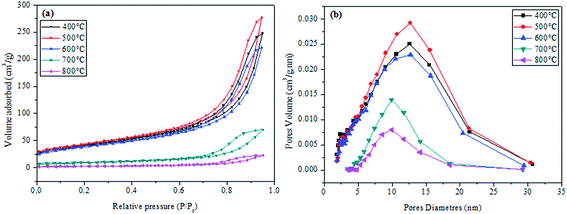 | ||
| Fig. 7 Nitrogen adsorption/desorption isotherms of calcined CuO@CeO2 samples (a), and BJH pore size distribution (b). | ||
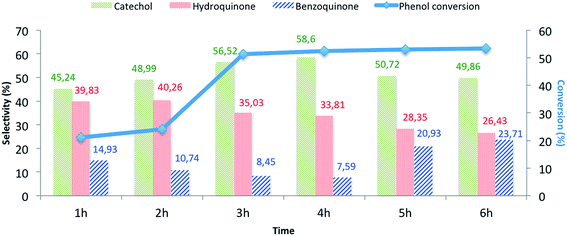 | ||
| Fig. 8 The influence of the reaction time on the phenol hydroxylation over CuO@CeO2-800 °Ca. aReaction conditions: phenol, 5 mmol; H2O2, 5 mmol; catalyst, 50 mg; water, 10 mL; time, 3 h; 80 °C. | ||
CuO@CeO2 samples were evaluated as heterogeneous catalysts for the phenol hydroxylation with aqueous hydrogen peroxide as oxidant. Phenol conversion and selectivity of catechol and hydroquinone are summarized in Table 3. Initially, the reaction conducted without a catalyst and no activity was observed despite a prolonged reaction time (Table 3, entry 1). It can be seen that the phenol conversion is very low when CeO2 was used as a catalyst (Table 3, entry 2), whereas CuO@CeO2-400 °C exhibited high catalytic activity for phenol hydroxylation under the same conditions, indicating that the phenol hydroxylation is very sensitive to the presence of copper species (Table 3, entry 3). Subsequently, the influence of the calcination temperatures of the CuO@CeO2 on their catalytic activities was examined. Thus, we tested the reaction with CuO@CeO2 catalyst calcined at different temperatures namely CuO@CeO2-500 °C, CuO@CeO2-600 °C, CuO@CeO2-700 °C and CuO@CeO2-800 °C. According our experimental findings, we observed that the phenol conversion increased from 26.74 to 53.4% with the elevation of calcination temperature of CuO@CeO2 from 400 to 800 °C, respectively (Table 3, entries 3 and 7). Indeed, we can conclude that the catalytic activity of CuO@CeO2 in the hydroxylation of phenol reaction was not directly related to the surface area of CuO@CeO2, which decrease from 144 to 8 m2 g−1 for the catalyst CuO@CeO2 calcined at 400 and 800 °C, respectively. Therefore, we can conclude that the catalytic activity of CuO@CeO2 may be related to other parameters that play a role in monitoring the performance of this catalyst, such as the electronic exchange between the two redox pairs Cu+/Cu2+ and Ce3+/Ce4+ revealed by XPS and the presence of oxygen vacancies, which can be beneficial to high activity of CuO@CeO2 catalyst calcined at high temperature.48–50 It should be noted the phenol hydroxylation was also investigated using CuO@CeO2 catalyst prepared by co-precipitation without surfactant and calcined at 800 °C. However, under same conditions, the latter exhibited significantly lower catalytic activity since only 31% of phenol conversion was observed.
| Entry | Catalyst | Conversion (%) | Selectivity (%) | ||
|---|---|---|---|---|---|
| CAT | HQ | BQ | |||
| a Reaction conditions: phenol, 5 mmol; H2O2, 5 mmol; catalyst, 50 mg; water, 10 mL; time, 6 h; 80 °C. | |||||
| 1 | Without | n.r. | — | — | — |
| 2 | CeO2 | 2.32 | 70.12 | 25.21 | 4.67 |
| 3 | CuO@CeO2-400 °C | 26.74 | 39.63 | 32.73 | 10.62 |
| 4 | CuO@CeO2-500 °C | 27.59 | 44.78 | 48.2 | 7.01 |
| 5 | CuO@CeO2-600 °C | 30.08 | 51.85 | 32.86 | 7.22 |
| 6 | CuO@CeO2-700 °C | 46.62 | 54.24 | 26.68 | 6.06 |
| 7 | CuO@CeO2-800 °C | 53.40 | 61.86 | 32.43 | 5.71 |
The effects of the following reaction parameters: duration, reaction temperature, solvents and molar ratios of reactants on phenol hydroxylation in the presence of CuO@CeO2-800 °C catalyst were investigated. First, the effect of reaction time on conversion of phenol over CuO@CeO2-800 °C was studied and the results are presented in Fig. 8. It is worth mentioning that increasing the reaction time led to an increase in phenol hydroxylation reaching its highest level of 54.62% after 3 hours. Besides, the selectivity of the reaction for the dihydroxybenzene was observed to decrease with increasing time. This may be attributed to the oxidation of dihydroxybenzene to benzoquinone and subsequently to tar formation.51 This shows clearly that further increase of the reaction time won't be beneficial for this reaction.
The effect of reaction temperature was investigated from 50 to 100 °C to avoid decomposition H2O2 at high temperature5 and to prevent further oxidation of formed dihydroxybenzene to benzoquinone52 and the results are presented in Table 4. Based on the results obtained, the phenol conversion and selectivity for dihydroxybenzene increased with increasing temperature. These results could be explained by the high concentrations of free radicals formed at high temperature. At 80 °C, the phenol conversion reached a maximum of 54.62%.
| Entry | Temperature (°C) | Conversion (%) | Selectivity (%) | ||
|---|---|---|---|---|---|
| CAT | HQ | BQ | |||
| a Reaction conditions: phenol, 5 mmol; H2O2, 5 mmol; catalyst, 50 mg; water, 10 mL; time, 3 h. | |||||
| 1 | 50 | 20.10 | 55.24 | 34.48 | 10.27 |
| 2 | 60 | 34.12 | 58.27 | 33.99 | 7.73 |
| 3 | 70 | 41.54 | 60.14 | 33.29 | 6.57 |
| 4 | 80 | 54.62 | 61.86 | 32.43 | 5.71 |
| 5 | 90 | 54.50 | 62.65 | 31.96 | 5.39 |
| 6 | 100 | 55.06 | 60.50 | 33.02 | 6.48 |
The effect of the phenol/H2O2 molar ratios on the phenol hydroxylation was studied and the experimental findings are presented in Table 5. When decreasing the phenol/H2O2 molar from 3 to 0.5, the conversion of phenol and the selectivity for the dihydroxybenzene increased significantly. However, the addition of more hydrogen peroxide in presence of CuO@CeO2-800 °C is undesirable due to the oxidation reaction of dihydroxybenzene.53
| Entry | Molar ratio (PhOH![[thin space (1/6-em)]](https://www.rsc.org/images/entities/char_2009.gif) : :![[thin space (1/6-em)]](https://www.rsc.org/images/entities/char_2009.gif) H2O2) H2O2) |
Conversion (%) | Selectivity (%) | ||
|---|---|---|---|---|---|
| CAT | HQ | BQ | |||
| a Reaction conditions: sample of phenol reacted with H2O2 in different molar ratios over 50 mg of CuO@CeO2 in 10 mL of water at 30 °C for 3 h. | |||||
| 1 | 1![[thin space (1/6-em)]](https://www.rsc.org/images/entities/char_2009.gif) : :![[thin space (1/6-em)]](https://www.rsc.org/images/entities/char_2009.gif) 4 4 |
53.3 | 54.15 | 25.15 | 20.7 |
| 2 | 1![[thin space (1/6-em)]](https://www.rsc.org/images/entities/char_2009.gif) : :![[thin space (1/6-em)]](https://www.rsc.org/images/entities/char_2009.gif) 2 2 |
54.62 | 57.11 | 35.79 | 7.10 |
| 3 | 1![[thin space (1/6-em)]](https://www.rsc.org/images/entities/char_2009.gif) : :![[thin space (1/6-em)]](https://www.rsc.org/images/entities/char_2009.gif) 1 1 |
53.27 | 56.52 | 35.03 | 8.45 |
| 4 | 2![[thin space (1/6-em)]](https://www.rsc.org/images/entities/char_2009.gif) : :![[thin space (1/6-em)]](https://www.rsc.org/images/entities/char_2009.gif) 1 1 |
51.27 | 54.52 | 38.03 | 7.45 |
| 5 | 3![[thin space (1/6-em)]](https://www.rsc.org/images/entities/char_2009.gif) : :![[thin space (1/6-em)]](https://www.rsc.org/images/entities/char_2009.gif) 1 1 |
36.21 | 78.24 | 13.49 | 8.25 |
The influence of the solvent nature on the phenol hydroxylation was also investigated and the experimental findings are summarized in Table 6. It can be observed that when the reaction was performed in water, the reaction showed much higher conversion, but when the methanol and ethanol were used as solvents, the catalytic reaction gave low conversion. The difference in catalytic activity may be due to the high solubility of the phenol and H2O2 in water and the stability of the free radicals ˙OH in water compared to other organic solvents.5,54 Obviously, water is favorable for improving phenol conversion as well as obtaining good product selectivity.
| Entry | Solvent | Conversion (%) | Selectivity (%) | ||
|---|---|---|---|---|---|
| CAT | HQ | BQ | |||
| a Reaction conditions: phenol, 5 mmol; H2O2, 5 mmol; catalyst, 50 mg; time, 3 h; 80 °C. | |||||
| 1 | H2O | 54.62 | 56.68 | 35.03 | 8.45 |
| 2 | MeOH | 28.24 | 9 | — | 91 |
| 3 | EtOH | 15.64 | 7 | — | 93 |
The studies on the influence of the catalyst content on the phenol hydroxylation process were also investigated and the obtained findings are presented in Table 7. It was observed that the phenol conversion increased from 17.3 to 53.27% with increasing the content of the catalyst in the reaction mixture from 20 to 40 mg. The further increment of catalyst amount to 50 mg resulted in only a negligible increase in phenol conversion. It was believed that a large number of copper active sites increased the decomposition rate of H2O2, resulting in the decrease of H2O2 efficiency.55,56
| Entry | Catalytic amount (mg) | Conversion (%) | Selectivity (%) | ||
|---|---|---|---|---|---|
| CAT | HQ | BQ | |||
| a Reaction conditions: phenol, 5 mmol; H2O2, 5 mmol; water, 10 mL; time, 3 h; 80 °C. | |||||
| 1 | 20 | 17.3 | 58.04 | 30.15 | 11.81 |
| 2 | 40 | 53.27 | 56.52 | 35.03 | 8.45 |
| 3 | 50 | 54.62 | 58.68 | 34.19 | 7.13 |
| 4 | 60 | 56.71 | 63.31 | 31.52 | 5.16 |
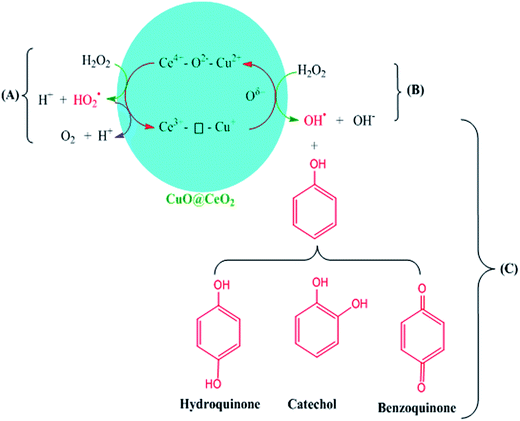
Therefore, the possible reaction mechanism in the presence of CuO@CeO2-800 °C is illustrated in Scheme 2. The Ce3+–⊡–Cu+ species are catalytically active centers for the phenol hydroxylation with H2O2 being used as the oxidizing agent. The ˙OH radicals were generated via the decomposition of H2O2 over Ce3+–⊡–Cu+ due to the existence of Ce3+/Ce4+ (Scheme 2B). The Ce3+–⊡–Cu+ was converted to Ce4+–O2−–Cu2+ simultaneously. The strong oxidative ˙OH radicals oxidized phenol to produce HQ and CAT (Scheme 2C). Meanwhile, Ce4+–O2−–Cu2+ was regenerated into the catalytic active Ce3+–⊡–Cu+ through a formation of oxygen vacancies, which is being beneficial for the production and stability of the Cu+.57 A side reaction (Scheme 2A) might occur along with the hydroxylation of phenol, where Ce4+–O2−–Cu2+ reacted with H2O2 to produce O2, leading to less utilization efficiency of H2O2.51,56
Catalyst stability, heterogeneity and leaching are the most important criteria to evaluate the sustainability of any catalytic system. After completion of the first reaction, the CuO@CeO2-800 °C catalyst was recovered by centrifugation and washed sequentially with water and dichloromethane and finally dried under vacuum over night. Utilizing the used catalyst, the above test reaction was performed again under the same condition. As shown in Fig. 9, the reused catalyst showed only slight deactivation in its activity after five cycle, which might be caused by gradual poisoning of the catalyst and the blocking of the pores of the catalyst by tar formed in the reaction.55,58
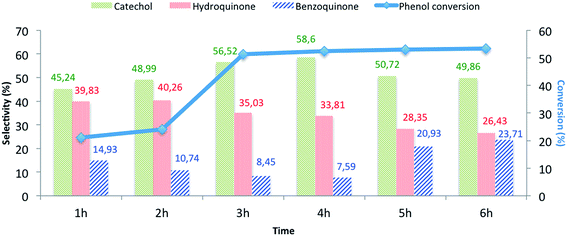 | ||
| Fig. 9 Reuse performance of CuO@CeO2-800 °C catalysta. aReaction conditions: phenol, 5 mmol; H2O2, 5 mmol; catalyst, 50 mg; water, 10 mL; time, 3 h; 80 °C. | ||
In order to clarify the behavior of CuO@CeO2-800 °C after recycling experiments, we examined the oxidation state of the catalyst after one catalytic cycle using XPS analysis (Fig. 10). The obtained results revealed that the oxidation state of cerium Ce4+/Ce3+ and copper Cu2+/Cu+ and their concentrations remain unchanged in comparison with XPS of fresh catalyst (Table 8). By cons, we note that there is a slight increase in the heart of O 1s peak intensity of CuO@CeO2-800 °C at about 531.5 eV. This increase may be due to the high concentration of oxygen adsorbed on the catalyst surface CuO@CeO2-800 °C by hydroxyl groups formed during the hydroxylation process.
| Samples | Surface element (%) | |||
|---|---|---|---|---|
| Ce3+ | Ce4+ | Cu2+ | Cu+ | |
| Before reaction | 20 | 80 | 62.71 | 37.29 |
| After reaction | 20 | 80 | 63.78 | 36.22 |
To investigate the heterogeneity of the catalyst and the metal leaching, the hydroxylation reaction of phenol was maintained for 1 h in the presence of CuO@CeO2-800 °C catalyst. After that, the catalyst was filtered and the filtrate obtained is stirred for additional 2 h at 80 °C, the portion containing the catalyst showed 22% of phenol conversion, while the catalyst-free portion showed no product, evidently proving the heterogeneity of the catalyst. Metal leaching was studied by ICP-AES analysis of the catalyst before and after the reaction. The copper concentration of the catalyst was found to 4.6% for fresh catalyst and 4.4% after one catalytic cycle in phenol hydroxylation, which confirms negligible copper leaching. The catalytic activity of CuO@CeO-800 °C catalyst was compared with reported homogeneous and heterogeneous copper-containing catalysts for phenol hydroxylation (Table 9). Indeed, our catalytic system exhibited higher catalytic activity in terms of phenol conversion.59–64
| Catalyst | Solvent | Phenol![[thin space (1/6-em)]](https://www.rsc.org/images/entities/char_2009.gif) : :![[thin space (1/6-em)]](https://www.rsc.org/images/entities/char_2009.gif) H2O2 ratio H2O2 ratio |
Temp (°C) | Time (min) | Conversion (%) | Ref. |
|---|---|---|---|---|---|---|
| a Tars formation. | ||||||
| CuO@CeO2-800 °C | Water | 1 | 80 | 180 | 54.62 | This work |
| CuAPO-11 | Water | 1 | 60 | 360 | 34.8 | 63 |
| CuFe2O4–RGO20 | Water | 1 | 55 | 30 | 35.5 | 64 |
| CuCl2–H4SiW12O40 | Water | 1 | 70 | 270 | 39 | 60 |
| CuUSY | Water | 1 | 60 | 120 | 9a | 61 |
| CuH B | Water | 1 | 60 | 120 | 35a | 61 |
| [Cu-Imace-H][NO3] | Water | 1 | 70 | 180 | 27 | 59 |
| LaCuO4 | Water | 1 | 70 | 120 | 50.9 | 62 |
| LaSrCuO4 | Water | 1 | 70 | 120 | 2.2 | 62 |
| CuO | Water | 1 | 70 | 120 | 11.7 | 62 |
4. Conclusion
In summary, in this work, the objective is to explore new routes to optimize the synthesis of CuO@CeO2 catalysts using the surfactant-template method. The calcination temperature seems to affect significantly the crystallite size, surface area, degree of dispersion of CuO@CeO2 species and their catalytic activity for phenol hydroxylation. In particular, CuO@CeO2 when it is calcined at 800 °C showed the highest phenol conversion and selectivity for HQ and CAT, which was ascribed to the higher electronic exchange between the two redox pairs Cu+/Cu2+ and Ce3+/Ce4+, and the lattice oxygen provided by Cu–O–Ce solid solution in CuO@CeO2 catalyst. Thereafter, the optimal reaction conditions were explored, and water was proved to be the optimum solvent of the reaction, which is environmentally friendly. The CuO@CeO2-800 °C catalyst exhibited good catalytic stability and selectivity on phenol hydroxylation. Additionally, our catalytic system exhibited higher catalytic activity in terms of phenol conversion compared to copper-containing catalysts reported in the literature. The decrease in the catalytic activity of CuO@CeO2-800 °C can be explained by a catalyst poisoning by tar, which is formed in situ during the reaction and get stuck on the catalyst surface even after washing.Acknowledgements
We thank MAScIR Foundation for funding and support. We acknowledge also the financial assistance of the CNRST.Notes and references
- L. Krumenacker, M. Constantini, P. Pontal and J. P. Sentenac, Kirk-Othmer Encyclopedia of Chemical Technology, ed. J. I. Kroschwitz and M. Howe-Grant, Wiley, New York, 4th edn, 1995, vol. 13, p. 996 Search PubMed.
- K. Tennakone, G. R. R. A. Kumara, A. R. Kumarasinghe, P. M. Sirimanne and K. G. U. Wijayantha, J. Photochem. Photobiol., A, 1996, 94, 217–220 CrossRef CAS.
- P. Minosci and F. Maggioni, Chim. Ind., 1977, 59, 239 Search PubMed.
- J. Varagnat, Ind. Eng. Chem. Prod. Res. Dev., 1976, 15, 212–215 CAS.
- A. Dubey, J. Mol. Catal. A: Chem., 2002, 181, 151–160 CrossRef CAS.
- A. Dubey, S. Kannan, S. Velu and K. Suzuki, Appl. Catal., A, 2003, 238, 319–326 CrossRef CAS.
- E. A. Karakhanov, A. L. Maximov, Y. S. Kardasheva, V. A. Skorkin, S. V. Kardashev, V. V. Predeina, M. Y. Talanova, E. Lurie-Luke, J. A. Seeley and S. L. Cron, Appl. Catal., A, 2010, 385, 62–72 CrossRef CAS.
- Y. Zuo, W. Song, C. Dai, Y. He, M. Wang and X. Wang, Appl. Catal., A, 2013, 453, 272–279 CrossRef CAS.
- B. Wang, M. Lin, B. Zhu, X. Peng, G. Xu and X. Shu, Catal. Commun., 2016, 75, 69–73 CrossRef CAS.
- L. Gou and C. J. Murphy, Chem. Commun., 2005, 5907–5909 RSC.
- Y. Jiang, K. Lin, Y. Zhang, J. Liu, G. Li, J. Sun and X. Xu, Appl. Catal., A, 2012, 445–446, 172–179 CrossRef CAS.
- T. Zhou, X. Lu, T.-T. Lim, Y. Li and F.-S. Wong, Chem. Eng. J., 2010, 156, 347–352 CrossRef CAS.
- T. Zhou, Y. Li, F.-S. Wong and X. Lu, Ultrason. Sonochem., 2008, 15, 782–790 CrossRef CAS PubMed.
- H.-S. Son, J.-K. Im and K.-D. Zoh, Water Res., 2009, 43, 1457–1463 CrossRef CAS PubMed.
- O. Amadine, H. Maati, K. Abdelouhadi, A. Fihri, S. El Kazzouli, C. Len, A. El Bouari and A. Solhy, J. Mol. Catal. A: Chem., 2014, 395, 409–419 CrossRef CAS.
- S. Mandal, C. Santra, K. K. Bando, O. O. James, S. Maity, D. Mehta and B. Chowdhury, J. Mol. Catal. A: Chem., 2013, 378, 47–56 CrossRef CAS.
- R. K. P. Purushothaman, J. van Haveren, D. S. van Es, I. Melián-Cabrera, J. D. Meeldijk and H. J. Heeres, Appl. Catal., B, 2014, 147, 92–100 CrossRef CAS.
- P. Lakshmanan, P. P. Upare, N.-T. Le, Y. K. Hwang, D. W. Hwang, U.-H. Lee, H. R. Kim and J.-S. Chang, Appl. Catal., A, 2013, 468, 260–268 CrossRef CAS.
- P.-O. Larsson and A. Andersson, Appl. Catal., B, 2000, 24, 175–192 CrossRef CAS.
- S. Scirè, C. Crisafulli, P. M. Riccobene, G. Patanè and A. Pistone, Appl. Catal., A, 2012, 417–418, 66–75 CrossRef.
- P. Bazin, O. Saur, O. Marie, M. Daturi, J. C. Lavalley, A. M. Le Govic, V. Harlé and G. Blanchard, Appl. Catal., B, 2012, 119–120, 207–216 CrossRef CAS.
- S. Sun, D. Mao and J. Yu, J. Rare Earths, 2015, 33, 1268–1274 CrossRef CAS.
- Q. Zhang, L. Xu, P. Ning, J. Gu and Q. Guan, Appl. Surf. Sci., 2014, 317, 955–961 CrossRef CAS.
- J. A. Rodriguez, S. Ma, P. Liu, J. Hrbek, J. Evans and M. Pérez, Science, 2007, 318, 1757–1760 CrossRef CAS PubMed.
- M. Manzoli, R. Di Monte, F. Boccuzzi, S. Coluccia and J. Kašpar, Appl. Catal., B, 2005, 61, 192–205 CrossRef CAS.
- M. Turco, C. Cammarano, G. Bagnasco, E. Moretti, L. Storaro, A. Talon and M. Lenarda, Appl. Catal., B, 2009, 91, 101–107 CrossRef CAS.
- F. Mariño, C. Descorme and D. Duprez, Appl. Catal., B, 2005, 58, 175–183 CrossRef.
- E. P. Barrett, L. G. Joyner and P. P. Halenda, J. Am. Chem. Soc., 1951, 73, 373–380 CrossRef CAS.
- A. Martínez-Arias, M. Fernández-García, O. Gálvez, J. M. Coronado, J. A. Anderson, J. C. Conesa, J. Soria and G. Munuera, J. Catal., 2000, 195, 207–216 CrossRef.
- G. Avgouropoulos and T. Ioannides, Appl. Catal., A, 2003, 244, 155–167 CrossRef CAS.
- B. Flageolet, P. Villechaise, M. Jouiad and J. Mendez, Superalloys 2004, Proc. Int. Symp., 10th, 2004, 371–379 CAS.
- R. Dziembaj, M. Molenda, L. Chmielarz, M. Drozdek, M. M. Zaitz, B. Dudek, A. Rafalska-Łasocha and Z. Piwowarska, Catal. Lett., 2010, 135, 68–75 CrossRef CAS.
- R. Si, J. Raitano, N. Yi, L. Zhang, S.-W. Chan and M. Flytzani-Stephanopoulos, Catal. Today, 2012, 180, 68–80 CrossRef CAS.
- X. Wang, J. A. Rodriguez, J. C. Hanson, D. Gamarra, A. Martínez-Arias and M. Fernandez-García, J. Phys. Chem. B, 2005, 109, 19595–19603 CrossRef CAS PubMed.
- P. Bera, K. R. Priolkar, P. R. Sarode, M. S. Hegde, S. Emura, R. Kumashiro and N. P. Lalla, Chem. Mater., 2002, 14, 3591–3601 CrossRef CAS.
- M. L. Dos Santos, R. C. Lima, C. S. Riccardi, R. L. Tranquilin, P. R. Bueno, J. A. Varela and E. Longo, Mater. Lett., 2008, 62, 4509–4511 CrossRef CAS.
- M. Zawadzki, J. Alloys Compd., 2008, 454, 347–351 CrossRef CAS.
- D. Andreescu, E. Matijević and D. V. Goia, Colloids Surf., A, 2006, 291, 93–100 CrossRef CAS.
- T. Wang and D. C. Sun, Mater. Res. Bull., 2008, 43, 1754–1760 CrossRef CAS.
- Y. Q. Song, Q. H. Yang, H. W. Zhang, L. Peng and L. R. Shah, J. Phys.: Conf. Ser., 2009, 152, 012038 CrossRef.
- H. Gu and M. D. Soucek, Chem. Mater., 2007, 19, 1103–1110 CrossRef CAS.
- L. Qi, Q. Yu, Y. Dai, C. Tang, L. Liu, H. Zhang, F. Gao, L. Dong and Y. Chen, Appl. Catal., B, 2012, 119–120, 308–320 CrossRef CAS.
- S.-P. Wang, X.-Y. Wang, J. Huang, S.-M. Zhang, S.-R. Wang and S.-H. Wu, Catal. Commun., 2007, 8, 231–236 CrossRef CAS.
- Y. Li, Y. Cai, X. Xing, N. Chen, D. Deng and Y. Wang, Anal. Methods, 2015, 7, 3238–3245 RSC.
- P. Sudarsanam, B. Mallesham, D. N. Durgasri and B. M. Reddy, RSC Adv., 2014, 4, 11322–11330 RSC.
- S. Gregg, Adsorption, surface area, and porosity, Academic Press, London, New York, 1982 Search PubMed.
- K. S. W. Sing, Pure Appl. Chem., 1985, 57, 603–619 CrossRef CAS.
- P. Bera, S. Mitra, S. Sampath and M. S. Hegde, Chem. Commun., 2001, 927–928 RSC.
- S. Zeng, Y. Wang, S. Ding, J. J. H. B. Sattler, E. Borodina, L. Zhang, B. M. Weckhuysen and H. Su, J. Power Sources, 2014, 256, 301–311 CrossRef CAS.
- L. Zhang, T. Chen, S. Zeng and H. Su, J. Environ. Chem. Eng., 2016, 4, 2785–2794 CrossRef CAS.
- C. Liu, Z. Zhao, X. Yang, X. Ye and Y. Wu, Chem. Commun., 1996, 1019–1020 RSC.
- J. S. Reddy, S. Sivasanker and P. Ratnasamy, J. Mol. Catal., 1992, 71, 373–381 CrossRef CAS.
- J. Guo and M. Al-Dahhan, Ind. Eng. Chem. Res., 2003, 42, 2450–2460 CrossRef CAS.
- X. Liang, R. Yang, G. Li and C. Hu, Microporous Mesoporous Mater., 2013, 182, 62–72 CrossRef CAS.
- H. Tang, Y. Ren, B. Yue, S. Yan and H. He, J. Mol. Catal. A: Chem., 2006, 260, 121–127 CrossRef CAS.
- F.-S. Xiao, J. Sun, X. Meng, R. Yu, H. Yuan, J. Xu, T. Song, D. Jiang and R. Xu, J. Catal., 2001, 199, 273–281 CrossRef CAS.
- P. Zhu, M. Liu and R. Zhou, Indian J. Chem., Sect. A: Inorg., Bio-inorg., Phys., Theor. Anal. Chem., 2012, 51, 1529–1537 Search PubMed.
- R. Yu, F.-S. Xiao, D. Wang, J. Sun, Y. Liu, G. Pang, S. Feng, S. Qiu, R. Xu and C. Fang, Catal. Today, 1999, 51, 39–46 CrossRef CAS.
- H. Zhang, X. Zhang, Y. Ding, L. Yan, T. Ren and J. Suo, New J. Chem., 2002, 26, 376–377 RSC.
- G. Yang, X. Hu, Y. Wu, C. Liu and Z. Zhang, Catal. Commun., 2012, 26, 132–135 CrossRef CAS.
- J. Wang, J.-N. Park, H.-C. Jeong, K.-S. Choi, X.-Y. Wei, S.-I. Hong and C. W. Lee, Energy Fuels, 2004, 18, 470–476 CrossRef CAS.
- C. Liu, Z. Zhao, X. Yang, X. Ye and Y. Wu, Chem. Commun., 1996, 1019 RSC.
- Q. Xingyi, Z. Lili, X. Wenhua, J. Tianhao and L. Rongguang, Appl. Catal., A, 2004, 276, 89–94 CrossRef.
- Y. Zhao, G. He, W. Dai and H. Chen, Ind. Eng. Chem. Res., 2014, 53, 12566–12574 CrossRef CAS.
| This journal is © The Royal Society of Chemistry 2017 |


