 Open Access Article
Creative Commons Attribution 3.0 Unported Licence
Photoinduced ROS regulation of apoptosis and mechanism studies of iridium(III) complex against SGC-7901 cells
Cheng Zhanga,
Shang-Hai Laia,
Hui-Hui Yanga,
De-Gang Xing*b,
Chuan-Chuan Zenga,
Bing Tanga,
Dan Wana and
Yun-Jun Liu *ac
*ac
aSchool of Pharmacy, Guangdong Pharmaceutical University, Guangzhou, 510006, P. R. China. E-mail: lyjche@gdpu.edu.cn
bSchool of Basic Course, Guangdong Pharmaceutical University, Guangzhou, 510006, P. R. China. E-mail: degangxing@126.com
cGuangdong Cosmetics Engineering & Technology Research Center, Guangzhou, 510006, P. R. China
First published on 23rd March 2017
Abstract
A new iridium(III) complex, [Ir(ppy)2(FBPIP)]PF6 (Ir-1), was synthesized and characterized. The cytotoxic activity of this complex against SGC-7901, PC-12, SiHa, HepG2, BEL-7402, A549, HeLa and normal LO2 cells was investigated using the MTT method. The complex showed no cytotoxic activity against the selected cell lines. However, upon irradiation, the complex displayed potent anti-proliferative activity toward SGC-7901 cells, with a low IC50 value of 6.1 ± 0.6 μM, and showed selectivity between cancer and normal cells. Apoptosis was assayed using the AO/EB staining method. The level of reactive oxygen species (ROS), mitochondrial membrane potential, autophagy and cell invasion were studied under a fluorescence microscope. The cell cycle distribution was studied by flow cytometry. The expression of caspase and Bcl-2 family proteins was investigated by western blot. Complex Ir-1 was shown to accumulate preferentially in the mitochondria of SGC-7901 cells and induced apoptosis via the mitochondrial pathway, which involved ROS generation, mitochondrial membrane potential depolarization, and Bcl-2 and caspase family member activation. These results demonstrate that the complex induces cancer cell apoptosis by acting on mitochondrial pathways.
1. Introduction
Bioinorganic chemistry is a fast-growing area of fascinating opportunities and creative power.1 A great number of transition metal ions play essential roles in biological processes and have been implicated in many diseases, including microbial infections, cancer, and neurodegenerative and autoimmune disorders.2,3 Due to the disadvantage of the dose-dependent side effects of cisplatin as well as the resistance of some carcinomas, it is understandable that a wide range of novel transition metal complexes have been screened for their use as therapeutic agents.4 Among all the transition metal complexes, ruthenium complexes appear to be particularly interesting compounds. Presently, one ruthenium(III) complex, namely KP1019 ([IndH][trans-RuCl4(Ind)2], where Ind = indazole), has successfully entered clinical trials.5 On the other hand, iridium-based compounds show a wide range of biological activities.6–18 Espinosa reported that iridium complexes inhibit cell growth through DNA interaction.19 Tris-cyclometalated iridium(III) complexes contain cationic peptides as inducers and detectors of cell death via a calcium-dependent pathway.20 Chao and Mao reported that Ir(III) complexes induce apoptosis through mitochondrial targets.14,15 In particular, induction of mitochondrial dysfunction has attracted great attention because the major function of mitochondria in human cells is to provide ATP by oxidative phosphorylation, and the mitochondrial respiratory chain is a major source of damaging free radicals. Therefore, the mitochondria are an important target for iridium complexes. To obtain more insight into the anticancer activity and further understanding of the anticancer mechanism of iridium complexes, in this article, a new cyclometalated iridium(III) complex, [Ir(ppy)2(FBPIP)]PF6 (Ir-1, ppy = 2-phenylpyridine, FBPIP = 2-(4-formyl)benzeno[4,5-f][1,10]phenanthroline, Scheme 1), was synthesized and characterized by elemental analysis, IR, ESI-MS, 1H NMR and 13C NMR. The in vitro cytotoxic activity of the complex against SGC-7901, PC-12, SiHa, HepG2, BEL-7402, A549, HeLa and normal LO2 cells was investigated using the MTT (3-(4,5-dimethylthiazole)-2,5-diphenyltetrazolium bromide) method. The results obtained demonstrated that the complex induced SGC-7901 cell apoptosis by acting on mitochondrial apoptosis pathways.2. Results and discussion
2.1. Synthesis and characterization
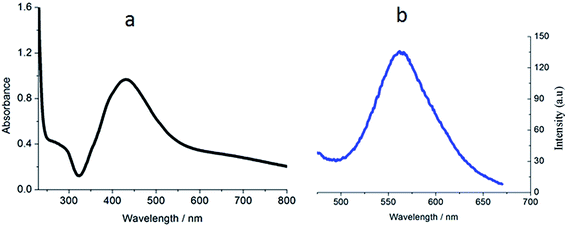
The ligand FBPIP was prepared according to the method described in the literature.21 The complex Ir-1 was synthesized by the direct reaction of [Ir(ppy)2Cl2]2 with FBPIP in a mixture of dichloromethane and methanol. The crude product was purified by column chromatography on neutral alumina. The obtained complex was characterized by elemental analysis, ESI-MS, IR, 1H NMR and 13C NMR. In the ESI-MS spectra, the peak at an m/z value of 824.5 corresponds to the ion peak of [M − PF6]+. In the IR spectra for Ir-1, the peak at 1696 cm−1 is attributed to C–H (formyl group) stretch vibration. In the 1H NMR spectrum, the peak at a chemical shift of 10.08 ppm is characteristic of the hydrogen of a formyl group, whereas the peak at 210.21 ppm in the 13C NMR spectrum is assigned to the carbon atom in the formyl group. The UV-Vis and luminescence spectra of the complex in PBS solution are shown in Fig. 1. The maximum absorbance of Ir-1 appears at 430 nm, and the complex can emit luminescence in PBS solution at ambient temperature, with a maximum appearing at 563 nm.2.2. The in vitro cytotoxicity assay using the MTT method
The in vitro cytotoxicity of Ir-1 against SGC-7901, PC-12, SiHa, BEL-7402, A549, HeLa, HepG2 and normal LO2 cells was determined using the MTT method. The 50% inhibitory concentrations (IC50), defined as the concentration required to reduce the size of the cell population by 50%, of the ligand and Ir-1 complex are listed in Table 1. As expected, the ligand FBPIP shows certain cytotoxic activity against the selected cell lines. It is unexpected to find that the Ir-1 complex displays no cytotoxicity in vitro without irradiation. However, when the cells are treated with Ir-1 and irradiation (7.03 J cm−3) for 45 min, Ir-1 exhibits high cytotoxic activity against SGC-7901, SiHa, A549 and BEL-7402 cells. In particular, Ir-1 exhibits the highest cytotoxicity against SGC-7901 cells, with an IC50 value of 6.1 ± 0.6 μM, among the selected cancer cells. Interestingly, the complex exhibits no or very weak cytotoxicity toward normal LO2 cells with or without irradiation. Comparing the IC50 values with those of cisplatin, the cytotoxic activity of Ir-1 is lower than that of cisplatin and [Ir(ppy)2(BTCP)]+ (IC50 = 3.9 ± 0.5 μM)3 toward SGC-7901 cells. Because SGC-7901 cells are sensitive to Ir-1 upon irradiation, this cell line was selected for the following experiments.| Complex | SGC-7901 | PC-12 | SiHa | HepG2 | BEL-7402 | A549 | HeLa | LO2 |
|---|---|---|---|---|---|---|---|---|
| a nd: not determined. | ||||||||
| FBPIP | 30.5 ± 3.4 | 44.6 ± 2.3 | nd | nd | 15.5 ± 1.6 | >200 | nd | >200 |
| Ir-1 | >200 | 113.7 ± 4.2 | >200 | >200 | >200 | >200 | >200 | >200 |
| Ir-1 (light) | 6.1 ± 0.6 | 92.1 ± 2.4 | 39.4 ± 2.6 | >200 | 35.5 ± 1.8 | 22.9 ± 1.2 | >200 | 53.7 ± 4.2 |
| Cisplatin | 3.6 ± 0.5 | 11.2 ± 0.7 | 13.6 ± 2.2 | 25.4 ± 3.3 | 11.1 ± 1.2 | 6.3 ± 1.1 | 7.4 ± 1.3 | nd |
2.3. Apoptosis assay using the AO/EB staining method
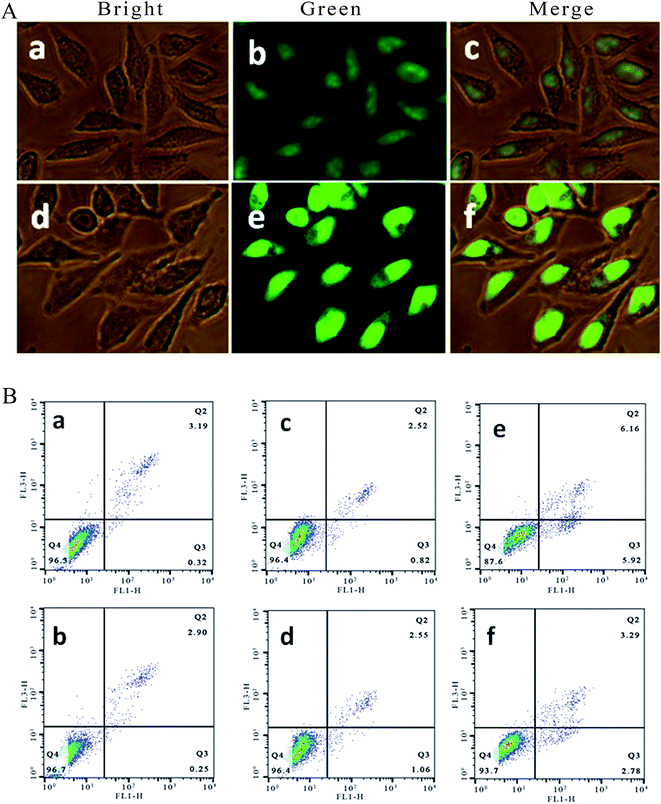
It is well known that acridine orange (AO) can stain living and apoptotic cells green, while ethidium bromide (EB) stains necrotic cells red. Apoptosis is primarily a physiological process necessary to remove individual cells that are no longer needed or that function abnormally.22 As shown in Fig. 2A, in the control ((a–c): (a) bright; (b) green; (c) merge), the living cells exhibit bright green fluorescence and retain their integrated morphology. After the SGC-7901 cells were exposed to 6.25 μM of Ir-1 for 24 h ((d–f): (d) bright; (e) green; (f) merge), apoptotic cells also displayed bright green fluorescence with apoptotic characteristics, such as nuclear shrinkage and chromatin condensation. These characteristics indicated that the Ir-1 complex can induce apoptosis in SGC-7901 cells. N-Acetylcysteine (NAC, 5 mM) is an inhibitor that inhibits the production of reactive oxygen species (ROS). To investigate the relation between apoptosis and ROS, apoptosis was also studied by flow cytometry. As shown in Fig. 2B, upon irradiation, in the control (a), the percentage of early apoptotic cells was 0.32%. In the presence of NAC (b), the percentage of early apoptotic cells was 0.25%. After SGC-7901 cells were treated with 6.25 μM of Ir-1 for 24 h, the percentage in the apoptotic cells was 0.82% without irradiation (c) and 5.92% upon irradiation (e). However, in the presence of NAC, the percentage of apoptotic cells was 1.06% ((d) without irradiation) and 2.78% ((f) with irradiation). Obviously, in the presence of NAC, the complex induces less apoptosis, i.e. low ROS levels cause the complex to produce less apoptosis. These results indicate that the apoptotic effect induced by the complex is closely related to ROS levels.2.4. Assay of intracellular ROS levels
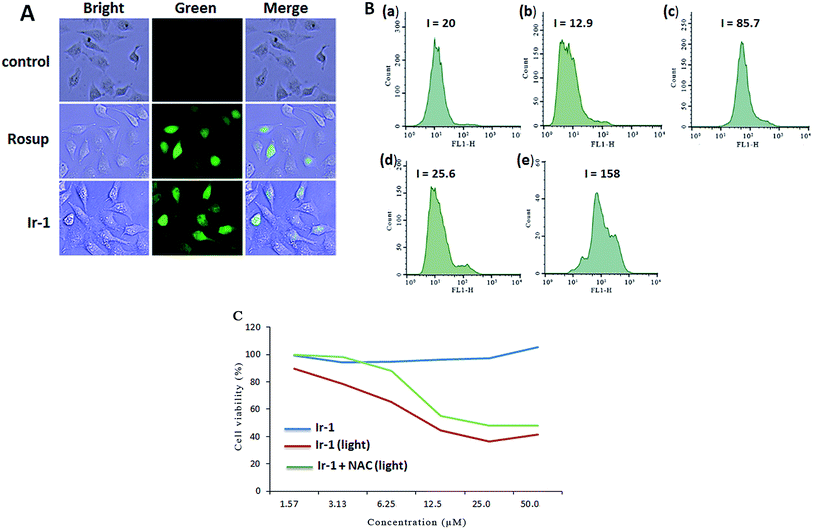
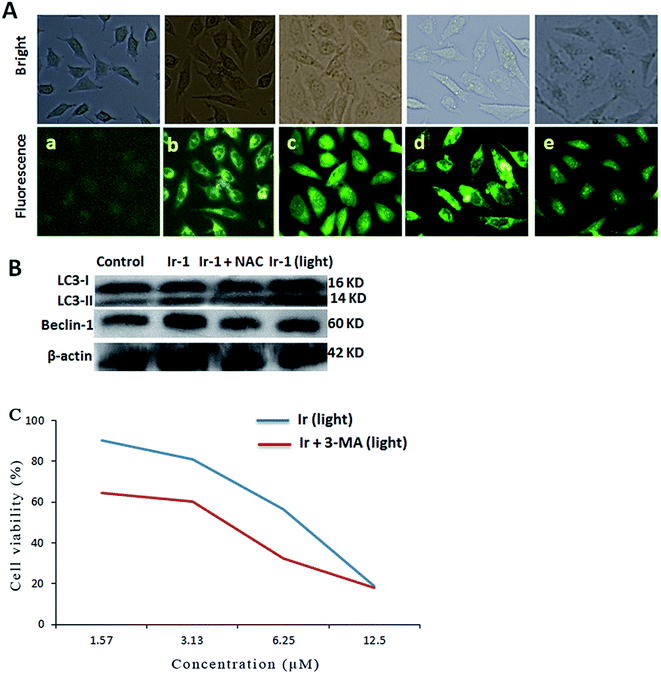
The apoptosis assays demonstrated that ROS can regulate the apoptotic effect. To quantitatively investigate the intracellular generation of ROS induced by different concentrations of complex Ir-1, ROS levels were detected using DCFH–DA dye as a fluorescent probe. In the presence of ROS, this dye is changed into a highly fluorescent compound (2′,7′-dichloro fluorescein, DCF). As shown in Fig. 3A, in the control (a), no obvious fluorescent points were observed. After the treatment of SGC-7901 cells with Rosup (b, positive control) and 6.25 μM of Ir-1 (c) for 24 h, the bright green fluorescent points were found. The fluorescence intensity of DCF is proportional to the amount of peroxide (ROS) produced by the cells.23 As shown in Fig. 3B, in the control ((a) with irradiation), the DCF fluorescence intensity is 20. After treating the SGC-7901 cells with 6.25 (b) and 12.5 μM (d) Ir-1 without irradiation for 24 h, the DCF fluorescence intensity is 12.9 and 25.6, respectively. However, upon irradiation for 45 min, the SGC-7901 cells that were exposed to 6.25 (c) and 12.5 (e) μM Ir-1 for 24 h displayed a DCF fluorescence intensity of 85.7 and 158.0, which is a DCF fluorescence intensity increase of 4.29 and 7.90 times relative to the original. Thus, we can conclude that it is difficult for Ir-1 to produce ROS without light, but upon irradiation, the complex can increase the intracellular ROS levels in a concentration-dependent manner. To further investigate the relationship between ROS levels and cell viability, SGC-7901 cells were treated with different concentrations of Ir-1 in the absence or presence of NAC (5 mM) upon irradiation for 24 h. As shown in Fig. 3C, Ir-1 can cause more cell death than Ir-1 + NAC. This demonstrates that ROS levels can regulate cell growth.2.5. Evaluation of the location of Ir-1 and mitochondrial membrane potential
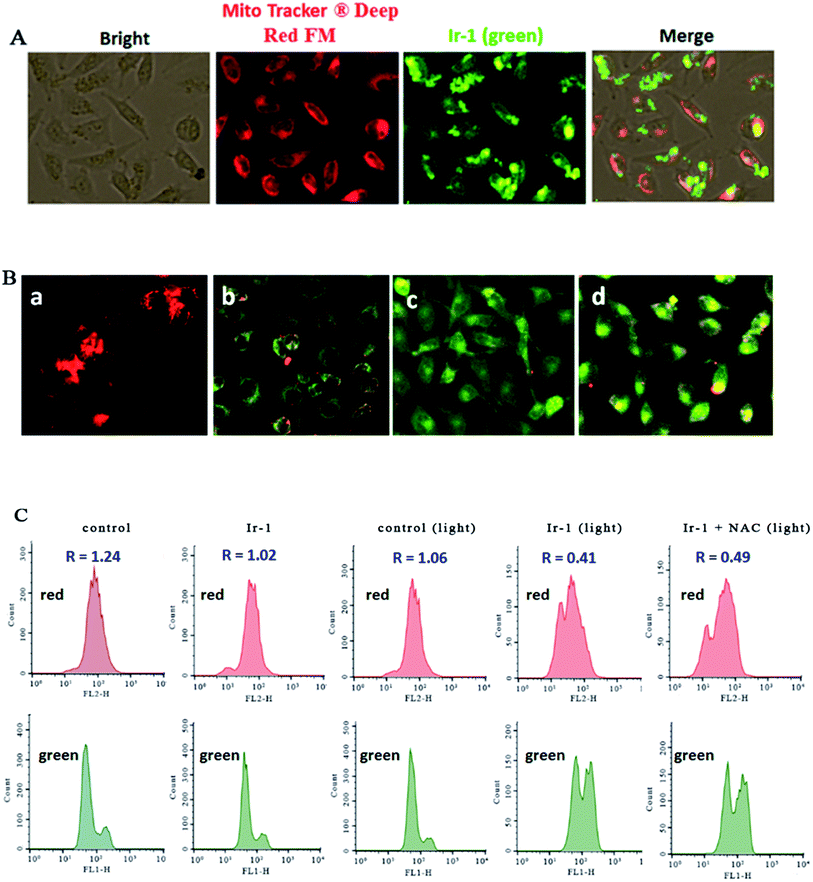
The location of the complex in the mitochondria was inspected using MitoTracker® Deep Red FM (ThermoFisher, 100 nM) as a fluorescent dye. As shown in Fig. 4A, in the control, the mitochondria were stained red. SGC-7901 cells were treated with 6.25 μM of Ir-1 for 4 h, and the complex emits bright green fluorescence. The merge of the red and green fluorescence images suggests that the complex can enter into the mitochondria. To further investigate whether or not cell apoptosis is accompanied by mitochondrial dysfunction, the mitochondrial membrane potential was detected using JC-1 as a fluorescent probe. It is well known that JC-1 forms aggregates and emits red fluorescence when the mitochondrial membrane potential is high. On the other hand, JC-1 exists as monomer and emits green fluorescence when the mitochondrial membrane potential is low. As shown in Fig. 4B, in the control (a), JC-1 emits red fluorescence corresponding to the high mitochondrial membrane potential. After SGC-7901 cells were exposed to cccp (b, positive control) and 6.25 (c) and 12.5 μM (d) for 24 h, JC-1 emits green fluorescence corresponding to low mitochondrial membrane potential. The ratio of the red/green fluorescence suggests the change of mitochondrial membrane potential. As shown in Fig. 4C, in the control (top and bottom), the ratio of red/green fluorescence is 1.24. After the SGC-7901 cells were incubated with 6.25 μM of Ir-1 (top and bottom) for 24 h, the ratio was 1.02. Upon irradiation for 30 min, in the control (light), the ratio was 1.06, while after treatment of the SGC-7901 cells with 6.25 μM Ir-1 (top and bottom) or Ir-1 + NAC (top and bottom), the ratios were 0.41 and 0.49, respectively. Comparing the ratios with the control, the ratios decrease, which indicates that the red fluorescence decreases and the green fluorescence increases. These results show that the complex can induce a decrease in the mitochondrial membrane potential. Moreover, in the presence of NAC, the ratio of red/green fluorescence decreases. This also demonstrates that the changes in mitochondrial membrane potential are closely related to ROS levels.2.6. Anti-metastatic studies
As a confirmatory efficacy test, the anti-invasive potential of different concentrations of Ir-1 toward invasive SGC-7901 cells was evaluated using a Matrigel assay. As shown in Fig. 5A and B, the translocated cells that migrated from the upper to the lower side of the filter were labeled with crystal violet dye. After SGC-7901 cells were exposed to 6.25 (b), 12.5 (c) and 25 μM (d) of Ir-1, a significant reduction in the number of invasive cells that penetrated the Matrigel was observed compared with the control (a). The percentage inhibition of cell invasion is shown in Fig. 5C. When the concentration of Ir-1 reaches 50 μM, the percentage inhibition of cell invasion reaches 73.1%. This concentration of Ir-1 can effectively inhibit cell migration. Furthermore, the anti-metastatic effect of Ir-1 is concentration-dependent.2.7. Autophagy induced by the Ir-1 complex
Autophagy is the process of sequestering cytoplasmic proteins into lytic components and is characterized by the formation and promotion of AVOs (acidic vesicular organelles).24,25 The autophagy induced by the complex was investigated using monodansylcadaverine (MDC) as a fluorescent probe. MDC is a specific in vivo marker for autophagic vacuoles.26 As shown in Fig. 6A, in the control (a), no obvious green spots were observed. After treatment of the SGC-7901 cells with Ir-1 (6.25 μM) with (d) or without (b) irradiation, MDC emits a number of green spots, which indicates that the complex induces autophagy with the formation of autophagic vacuoles. However, in the presence of NAC (5 mM), which is an inhibitor of ROS, the mixture of Ir-1 + NAC without (c) and with (e) irradiation can also induce SGC-7901 cell autophagy, but autophagy occurs at the autophagosome stage. One of the hallmarks of autophagy is the conversion of the soluble form of LC3 (LC3-I) to the lipidated and autophagosome-associated form (LC3-II).27 As shown in Fig. 6B, the conversion of LC3-I into LC3-II and an increase in the amount of LC3-II were observed. Moreover, upon irradiation, the Ir-1 complex can induce more effective autophagy than without light. Comparing the amount of LC3-II induced by Ir-1 and Ir-1 + NAC, Ir-1 induces a higher expression than Ir-1 + NAC under identical conditions. Thus, NAC can inhibit SGC-7901 cell autophagy. Similar results were found for the expression of beclin-1. Autophagy can prevent or induce cell death. To investigate whether the complex prevents or induces cell death, the cell viability was determined using the MTT method in the presence of 3-MA. SGC-7901 cells were exposed to different concentrations of Ir-1 or Ir-1 + 3-MA upon irradiation for 24 h. As shown in Fig. 6C, the cell viability with Ir-1 is higher than that with Ir-1 + 3-MA, which suggests that the complex protects the cell and does not induce cell death.2.8. Cell cycle distribution studies
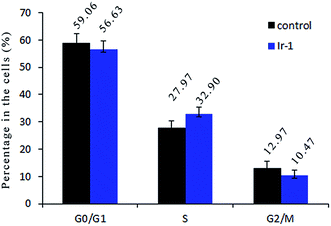
Inhibition of cancer cell proliferation by cytotoxic drugs could be the result of induction of apoptosis or cell cycle arrest, or a combination of these. Cell cycle distribution was investigated by flow cytometry in propidium iodide (PI) stained cells. It is well known that among the cell cycle regulating mechanisms, arrest in the S phase is related to cellular damage.28 As shown in Fig. 7, in the control, the percentage of cells in the S phase is 27.97%. After treatment of the SGC-7901 cells with Ir-1 for 24 h, cell cycle distribution analysis reveals that the percentage of cells in the S phase is 32.90%. An increase of 4.93% in the percentage of cells in the S phase was observed, which is accompanied by a concomitant decrease in the fraction of G0/G1 and G2/M cells. The data show that the complex inhibits SGC-7901 cell growth during the S phase.2.9. The expression of Bcl-2 family proteins induced by Ir-1
The activation of caspase 3 as an “effector caspase” serves as an important event in the apoptotic pathway. To study the effect of Ir-1 on the expression of caspase 3, SGC-7901 cells were incubated with 6.25 μM of Ir-1 in the absence or presence of NAC with or without irradiation for 24 h. As shown in Fig. 8, upon irradiation, Ir-1 can increase the expression levels of caspase 3, and Ir-1 induces more expression than Ir-1 + NAC. In apoptotic cells, Bcl-2 and Bax are two members of the Bcl-2 protein family that regulate the balance between cell proliferation and apoptosis. The anti-apoptotic protein Bcl-2 can block the release of cytochrome c from the mitochondria, whereas pro-apoptotic protein Bax induces the release of cytochrome c and other pro-apoptotic factors from the mitochondria.29 Upon irradiation, Fig. 8 shows that Ir-1 can down-regulate the expression of the Bcl-2 protein, and up-regulate the expression of the Bak and Bax proteins. In the presence of NAC, Ir-1 induces less expression of Bcl-2 family proteins compared with cells induced by Ir-1 alone. The results indicate that the expression levels of Bcl-2 family proteins induced by the Ir-1 complex can be regulated by ROS levels.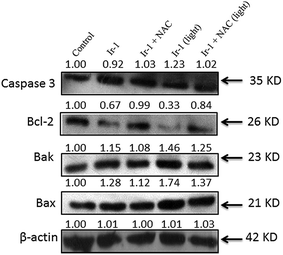 | ||
| Fig. 8 Western blot analysis of caspase 3, Bcl-2, Bak and Bax in SGC-7901 cells treated with 6.25 μM of Ir-1 in the absence and presence of NAC for 24 h. β-Actin was used as an internal control. | ||
3. Conclusions
A new iridium(III) polypyridyl complex, [Ir(ppy)2(FBPIP)]PF6, has been synthesized and characterized. Upon irradiation, this complex shows high cytotoxicity. In particular, the complex can effectively inhibit cell growth in SGC-7901 cells. ROS assays demonstrate that the complex can increase ROS levels. In the presence of NAC, the cell viability of SGC-7901 cells decreases. The complex can induce a decrease in the mitochondrial membrane potential and inhibit cell growth at the S phase. In addition, Ir-1 can cause autophagy at different stages in the presence of 3-MA with or without irradiation. Furthermore, autophagy enhances the cell viability. Western blot analysis indicates that the complex can down-regulate the expression of Bcl-2 and up-regulate the expression of pro-apoptotic proteins Bak and Bax. In summary, the anticancer activity of the Ir-1 complex is closely related to the ROS levels. The complex induces apoptosis through a ROS-mediated mitochondrial dysfunction pathway. This work will be helpful for designing and synthesizing iridium complexes as potential anticancer drugs.4. Experimental
4.1. Materials and methods
All reagents and solvents were purchased commercially and used without further purification unless otherwise noted. Ultrapure MilliQ water was used in all experiments. DMSO and RPMI 1640 were purchased from Sigma. 1,10-Phenanthroline was obtained from the Guangzhou Chemical Reagent Factory. The cancer cell lines SGC-7901 (human gastric adenocarcinoma), HeLa (human cervical cancer), PC-12 (pheochromocytoma), BEL-7402 (human hepatocellular carcinoma), SiHa (human cervical carcinone), A549 (human lung carcinoma) and HepG2 (human hepatocellular carcinoma), and normal LO2 cells (human liver cells) were purchased from the American Type Culture Collection. IrCl3·3H2O was purchased from the Kunming Institution of Precious Metals.Microanalysis (C, H, and N) was carried out with a PerkinElmer 240Q elemental analyzer. Electrospray ionization mass spectra (ESI-MS) were recorded on a LCQ system (Finnigan MAT, USA) using acetonitrile as the mobile phase. The spray voltage, tube lens offset, capillary voltage and capillary temperature were set at 4.50 kV, 30.00 V, 23.00 V and 200 °C, respectively, and the quoted m/z values are for the major peaks in the isotope distribution. 1H NMR and 13C NMR spectra were recorded on a Varian-500 spectrometer with DMSO-d6 as a solvent and tetramethylsilane (TMS) as an internal standard at 500 MHz at room temperature.
4.2. Synthesis of complex [Ir(ppy)2(FBPIP)]PF6 (Ir-1)
A mixture of cis-[Ir(ppy)2Cl2]2 (0.15 g, 0.14 mmol)30 and FBPIP21 (0.091 g, 0.28 mmol) in a mixture of 21 mL of dichloromethane and methanol (vCH2Cl2![[thin space (1/6-em)]](https://www.rsc.org/images/entities/char_2009.gif) :
:![[thin space (1/6-em)]](https://www.rsc.org/images/entities/char_2009.gif) vCH3OH = 2
vCH3OH = 2![[thin space (1/6-em)]](https://www.rsc.org/images/entities/char_2009.gif) :
:![[thin space (1/6-em)]](https://www.rsc.org/images/entities/char_2009.gif) 1) was refluxed under argon for 6 h to give a clear yellow solution. Upon cooling, a yellow precipitate was obtained by dropwise addition of saturated aqueous NH4PF6 solution with stirring at room temperature for 2 h. The crude product was purified by column chromatography on neutral alumina with a mixture of CH2Cl2/acetone (1
1) was refluxed under argon for 6 h to give a clear yellow solution. Upon cooling, a yellow precipitate was obtained by dropwise addition of saturated aqueous NH4PF6 solution with stirring at room temperature for 2 h. The crude product was purified by column chromatography on neutral alumina with a mixture of CH2Cl2/acetone (1![[thin space (1/6-em)]](https://www.rsc.org/images/entities/char_2009.gif) :
:![[thin space (1/6-em)]](https://www.rsc.org/images/entities/char_2009.gif) 3, v/v) as eluent. The yellow band was collected. The solvent was removed under reduced pressure and a yellow powder was obtained. Yield: 70%. Anal. calc. for C42H28N6OIrPF6: C, 52.01; H, 2.91; N, 8.66%. Found: C, 52.23; H, 3.02; N, 8.53%. IR (KBr, cm−1): 3044m, 1696s, 1607s, 1549m, 1479s, 1452w, 1424w, 1363m, 1309m, 1212m, 1193m, 1172m, 1071w, 1032w, 1015m, 952s, 838m, 805m, 738m, 703m, 645s, 623s. 1H NMR (DMSO-d6): δ 10.08 (s, 1H), 9.23 (d, 1H, J = 8.0 Hz), 9.16 (d, 2H, J = 8.5 Hz), 8.57 (s, 1H), 8.52 (d, 2H, J = 8.5 Hz), 8.28 (d, 2H, J = 6.0 Hz), 8.15 (t, 2H, J = 5.0 Hz), 8.08 (dd, 2H, J = 5.0, J = 5.0 Hz), 7.98 (d, 4H, J = 6.5 Hz), 7.89 (d, 2H, J = 7.5 Hz), 7.53 (d, 4H, J = 8.0 Hz), 7.08 (t, 2H, J = 6.5 Hz), 7.00 (d, 2H, J = 5.5 Hz). 13C NMR: (DMSO-d6, 125 MHz, ppm): 210.21, 166.91, 150.46, 149.12, 148.20, 144.22, 144.03, 138.68, 136.56, 132.19, 131.22, 130.30, 129.91, 126.93, 125.06, 123.83, 122.80, 122.35, 119.97. ESI-MS (DMSO): m/z 824.5 ([M − PF6]+).
3, v/v) as eluent. The yellow band was collected. The solvent was removed under reduced pressure and a yellow powder was obtained. Yield: 70%. Anal. calc. for C42H28N6OIrPF6: C, 52.01; H, 2.91; N, 8.66%. Found: C, 52.23; H, 3.02; N, 8.53%. IR (KBr, cm−1): 3044m, 1696s, 1607s, 1549m, 1479s, 1452w, 1424w, 1363m, 1309m, 1212m, 1193m, 1172m, 1071w, 1032w, 1015m, 952s, 838m, 805m, 738m, 703m, 645s, 623s. 1H NMR (DMSO-d6): δ 10.08 (s, 1H), 9.23 (d, 1H, J = 8.0 Hz), 9.16 (d, 2H, J = 8.5 Hz), 8.57 (s, 1H), 8.52 (d, 2H, J = 8.5 Hz), 8.28 (d, 2H, J = 6.0 Hz), 8.15 (t, 2H, J = 5.0 Hz), 8.08 (dd, 2H, J = 5.0, J = 5.0 Hz), 7.98 (d, 4H, J = 6.5 Hz), 7.89 (d, 2H, J = 7.5 Hz), 7.53 (d, 4H, J = 8.0 Hz), 7.08 (t, 2H, J = 6.5 Hz), 7.00 (d, 2H, J = 5.5 Hz). 13C NMR: (DMSO-d6, 125 MHz, ppm): 210.21, 166.91, 150.46, 149.12, 148.20, 144.22, 144.03, 138.68, 136.56, 132.19, 131.22, 130.30, 129.91, 126.93, 125.06, 123.83, 122.80, 122.35, 119.97. ESI-MS (DMSO): m/z 824.5 ([M − PF6]+).
4.3. In vitro cytotoxicity assay
MTT assay procedures were used.31 Cells were placed in 96-well microassay culture plates (8 × 10³ cells per well) and grown overnight at 37 °C in a 5% CO2 incubator. The tested complex was dissolved in DMSO and then added to the wells to achieve final concentrations ranging from 10−6 to 10−4 M. Control wells were prepared by addition of culture medium (100 μL). The plates were incubated at 37 °C in a 5% CO2 incubator for 48 h. Upon completion of the incubation, stock MTT dye solution (20 μL, 5 mg mL−1) was added to each well. After 4 h, buffer (100 μL) containing dimethylformamide (50%) and sodium dodecyl sulfate (20%) was added to solubilize the MTT formazan. The optical density of each well was measured with a microplate spectrophotometer at a wavelength of 490 nm. The IC50 values were determined by plotting the percentage of viable cells versus concentration on a logarithmic graph and reading off the concentration at which 50% of cells remain viable relative to the control. Each experiment was repeated at least three times to obtain mean values.4.4. Apoptosis assay using AO/EB staining methods
SGC-7901 cells were seeded onto chamber slides in six-well plates at a density of 2 × 10⁵ cells per well and incubated for 24 h. The cells were cultured in RPMI (Roswell Park Memorial Institute) 1640 medium supplemented with 10% fetal bovine serum (FBS) and incubated at 37 °C in 5% CO2. The medium was removed and replaced with medium (final DMSO concentration, 0.05% v/v) containing the complex (6.25 μM) for 24 h. The medium was removed again, and the cells were washed with ice-cold phosphate buffered saline (PBS), and fixed with formalin (4%, w/v). The cell nuclei were counterstained with acridine orange (AO) and ethidium bromide (EB) (AO: 100 μg mL−1, EB: 100 μg mL−1) for 10 min. The cells were then observed and imaged under a fluorescence microscope (Nikon, Yokohama, Japan) with excitation at 350 nm and emission at 460 nm.4.5. Reactive oxygen species (ROS) detection
SGC-7901 cells were seeded into six-well plates (Costar, Corning Corp, New York) at a density of 2 × 10⁵ cells per well and incubated for 24 h. The cells were cultured in RPMI 1640 medium supplemented with 10% FBS and incubated at 37 °C in 5% CO2. The medium was removed and replaced with medium (final DMSO concentration, 0.05% v/v) containing different concentrations of the complex for 24 h. The medium was removed again. The fluorescent dye 2′,7′-dichlorodihydrofluorescein diacetate (DCHF-DA, 10 μM) was added to the medium to cover the cells. The treated cells were then washed with cold PBS–EDTA twice, and collected by trypsinization and centrifugation at 1500 rpm for 5 min, and the cell pellets were suspended in PBS–EDTA. The DCF fluorescence intensity was determined by flow cytometry.4.6. Location assay of the complex in the mitochondria
SGC-7901 cells were placed in 24-well microassay culture plates (4 × 10⁴ cells per well) and grown overnight at 37 °C in a 5% CO2 incubator. 6.25 μM of the complex was added to the wells at 37 °C in a 5% CO2 incubator for 4 h and further co-incubated with MitoTracker Deep Red FM (150 nM) at 37 °C for 0.5 h. Upon completion of the incubation, the wells were washed three times with ice-cold PBS. After discarding the culture medium, the cells were imaged under a fluorescence microscope.4.7. Mitochondrial membrane potential assay
SGC-7901 cells were treated for 24 h with different concentrations of the complex in 12-well plates and were then washed three times with cold PBS. The cells were detached with trypsin–EDTA solution. The collected cells were incubated for 20 min with 1 μg mL−1 of JC-1 (5,5′,6,6′-tetrachloro-1,1′,3,3′-tetraethyl-imidacarbocyanine iodide) in culture medium at 37 °C. The cells were then immediately centrifuged to remove the supernatant. The cell pellets were suspended in PBS. The ratio of red/green fluorescence intensity was determined by flow cytometry.4.8. Cell cycle arrest by flow cytometry
SGC-7901 cells were seeded into six-well plates (Costar, Corning Corp, New York) at a density of 2 × 10⁵ cells per well and incubated for 24 h. The cells were cultured in RPMI 1640 medium supplemented with 10% FBS and incubated at 37 °C in 5% CO2. The medium was removed and replaced with medium (final DMSO concentration, 0.05% v/v) containing the complex (6.25 μM). After incubation for 24 h, the cell layer was trypsinized and washed with cold PBS and fixed with 70% ethanol. 20 μL of RNAse (0.2 mg mL−1) and 20 μL of propidium iodide (0.02 mg mL−1) were added to the cell suspensions and they were incubated at 37 °C for 30 min. Then the samples were analyzed with a FACSCalibur flow cytometer. The number of cells analyzed for each sample was 10![[thin space (1/6-em)]](https://www.rsc.org/images/entities/char_2009.gif) 000.32
000.32
4.9. Autophagy induced by the complex
SGC-7901 cells were seeded onto chamber slides in 12-well plates and incubated for 24 h. The cells were cultured in RPMI 1640 medium supplemented with 10% FBS and incubated at 37 °C in 5% CO2. The medium was removed and replaced with medium (final DMSO concentration, 0.05% v/v) containing different concentrations of the complex for 24 h. The medium was removed again, and the cells were washed with ice-cold PBS twice. Then the cells were stained with MDC (monodansylcadaverine) solution (50 μM) for 10 min and washed with PBS twice. The cells were observed and imaged under a fluorescence microscope. The effect of the complex on the expression of LC3 and beclin-1 proteins was assayed by western blot.4.10. The effect of autophagy on cell viability
Cell viability was determined using the MTT method. Cells were placed in 96-well microassay culture plates (8 × 10⁴ cells per well) and cultured overnight at 37 °C in a 5% CO2 incubator. The cells were pretreated with or without 3-methyladenine (3-MA, 3 mM) for 3 h, followed by different concentrations of Ir-1 for 24 h. After incubation, the cells were incubated with MTT (0.5 mg mL−1) for 4 h at 37 °C. Upon completion of the incubation, 100 μL of DMSO was added to solubilize the MTT formazan. The optical density of each well was then measured with a microplate spectrophotometer at a wavelength of 490 nm. The viability (%) of cell growth was calculated using the formula: (A490 (treatment group)/A490 (control)) × 100, where A490 (treatment group) is the mean OD value of cells treated with the complex and A490 (control) is the mean OD value of untreated cells. Each experiment was repeated at least three times to obtain mean values.4.11. Matrigel invasion assay
A BD Matrigel invasion chamber was used to investigate cell invasion according to the manufacturer's instructions. SGC-7901 cells (4 × 10⁴) in serum free medium containing different concentrations of the complex were seeded into the top chamber of the two-chamber Matrigel system. RPMI 1640 medium (20% FBS) was added into the lower chamber. The cells were allowed to invade for 24 h. After incubation, non-invading cells were removed from the upper surface and cells on the lower surface were fixed with 4% paraformaldehyde and stained with 0.1% crystal violet. The membranes were photographed and the invading cells were counted under a light microscope. The mean values from three independent assays were calculated.4.12. The expression of caspases and Bcl-2 family proteins
SGC-7901 cells were seeded into 3.5 cm dishes for 24 h and incubated with 6.25 μM of the complex in the presence of 10% FBS. The cells were harvested in lysis buffer. After sonication, the samples were centrifuged for 20 min at 13![[thin space (1/6-em)]](https://www.rsc.org/images/entities/char_2009.gif) 000g. The protein concentration of the supernatant was determined by BCA (bicinchoninic acid) assay. Sodium dodecyl sulfate–polyacrylamide gel electrophoresis was performed by loading equal amounts of protein per lane. The gels were then transferred to poly(vinylidene difluoride) membranes (Millipore) and blocked with 5% non-fat milk in TBST (20 mM Tris–HCl, 150 mM NaCl, 0.05% Tween 20, pH 8.0) buffer for 1 h. Then the membranes were incubated with primary antibodies at 1
000g. The protein concentration of the supernatant was determined by BCA (bicinchoninic acid) assay. Sodium dodecyl sulfate–polyacrylamide gel electrophoresis was performed by loading equal amounts of protein per lane. The gels were then transferred to poly(vinylidene difluoride) membranes (Millipore) and blocked with 5% non-fat milk in TBST (20 mM Tris–HCl, 150 mM NaCl, 0.05% Tween 20, pH 8.0) buffer for 1 h. Then the membranes were incubated with primary antibodies at 1![[thin space (1/6-em)]](https://www.rsc.org/images/entities/char_2009.gif) :
:![[thin space (1/6-em)]](https://www.rsc.org/images/entities/char_2009.gif) 5000 dilutions in 5% non-fat milk overnight at 4 °C, and washed four times with TBST for a total of 30 min. After this, the membranes were incubated with secondary antibodies conjugated with horseradish peroxidase at 1
5000 dilutions in 5% non-fat milk overnight at 4 °C, and washed four times with TBST for a total of 30 min. After this, the membranes were incubated with secondary antibodies conjugated with horseradish peroxidase at 1![[thin space (1/6-em)]](https://www.rsc.org/images/entities/char_2009.gif) :
:![[thin space (1/6-em)]](https://www.rsc.org/images/entities/char_2009.gif) 5000 dilution for 1 h at room temperature and then washed four times with TBST. The blots were visualized using Amersham ECL Plus western blotting detection reagents according to the manufacturer's instructions. To assess the presence of comparable amounts of protein in each lane, the membranes were stripped finally to detect the β-actin. The gray values were calculated using BandScan.
5000 dilution for 1 h at room temperature and then washed four times with TBST. The blots were visualized using Amersham ECL Plus western blotting detection reagents according to the manufacturer's instructions. To assess the presence of comparable amounts of protein in each lane, the membranes were stripped finally to detect the β-actin. The gray values were calculated using BandScan.
5. Data analysis
All data were expressed as mean ± SD. Statistical significance was evaluated using t-tests. Differences were considered to be significant when the *P value was less than 0.05.Acknowledgements
This work was supported by the Natural Science foundation of Guangdong Province (No. 2016A030313728) and the Project of Innovation for Enhancing Guangdong Pharmaceutical University, Provincial Experimental Teaching Demonstration Center of Chemistry & Chemical Engineering.References
- G. Jaouen, Bioorganometallics, Wiley-VCH, Weinheim, 1st edn, 2005 Search PubMed.
- H. Kozłowski, A. Janicka-Kłos, J. Brasun, E. Gaggelli, D. Valensin and G. G. Valensin, Coord. Chem. Rev., 2009, 253, 2665–2685 CrossRef.
- C. X. Zhang and S. J. Lippard, Curr. Opin. Chem. Biol., 2003, 7, 481–489 CrossRef CAS PubMed.
- G. Ludwig, S. Mijatović, I. RanCelović, M. Bulatović, D. Miljković, D. Maksimović-Ivanić, M. Korb, H. Lang, D. Steinborn and G. N. KaluCerović, Eur. J. Med. Chem., 2013, 69, 216–222 CrossRef CAS PubMed.
- X. Meng, M. L. Leyva, M. Jenny, I. Gross, S. Benosman, B. Fricker, S. Harlepp, P. Hébraud, A. Boos, P. Wlosik, P. Bischoff, C. Sirlin, M. Pfeffer, J. P. Loeffler and C. Gaiddon, Cancer Res., 2009, 69, 5458–5466 CrossRef CAS PubMed.
- C. Zhang, S. H. Lai, C. C. Zeng, B. Tang, D. Wan, D. G. Xing, Y. J. Liu and J. Biol, Inorg. Chem., 2016, 21, 1047–1060 CAS.
- Z. Liu, L. Salassa, A. Habtemariam, A. M. Pizarro, G. J. Clarkson and P. J. Sadler, Inorg. Chem., 2011, 50, 5777–5783 CrossRef CAS PubMed.
- H. Y. Huang, L. Yang, P. Y. Zhang, K. Q. Qiu, J. J. Huang, Y. Chen, J. J. Diao, J. K. Liu, L. N. Ji, J. G. Long and H. Chao, Biomaterials, 2016, 83, 321–331 CrossRef CAS PubMed.
- Z. Z. Wu, J. J. Mu, Q. Wang, X. Chen, L. Jensen, C. Q. Yi and M. J. Li, J. Organomet. Chem., 2015, 791, 175–182 CrossRef CAS.
- R. Cao, J. L. Jia, X. C. Ma, M. Zhou and H. Fei, J. Med. Chem., 2013, 56, 3636–3644 CrossRef CAS PubMed.
- G. L. Zhang, H. Y. Zhang, Y. Gao, R. Tao, L. J. Xin, J. Y. Yi, F. Y. Li, W. L. Liu and J. Qiao, Organometallics, 2014, 33, 61–68 CrossRef CAS.
- K. Y. Zhang, H. W. Liu, M. C. Tang, A. W. T. Choi, N. Y. Zhu, X. G. Wei, K. C. Lau and K. W. Lo, Inorg. Chem., 2015, 54, 6582–6593 CrossRef CAS PubMed.
- J. X. Ru, L. P. Guan, X. L. Tang, W. Tou, X. Yao, W. M. Chen, Y. M. Liu, G. L. Zhang, W. S. Liu, Y. Meng and C. M. Wang, Inorg. Chem., 2014, 53, 11498–11506 CrossRef CAS PubMed.
- R. Y. Ye, C. P. Tan, L. N. Ji and Z. W. Mao, Dalton Trans., 2016, 45, 13042–13051 RSC.
- C. Z. Jin, J. P. Liu, Y. Chen, G. Y. Li, R. L. Guan, P. Y. Zhang, L. N. Ji and H. Chao, Dalton Trans., 2015, 44, 7538–7547 RSC.
- Q. Jiang, M. Wang, L. F. Yang, H. Chen and L. Q. Mao, Anal. Chem., 2016, 88, 10322–10327 CrossRef CAS PubMed.
- L. Tabrizi and H. Chiniforoshan, Dalton Trans., 2017, 46, 2339–2349 RSC.
- S. K. Tripathy, U. De, N. Dehury, P. Laha, M. K. Panda, H. S. Kim and S. Patra, Dalton Trans., 2016, 45, 15122–15136 RSC.
- J. Ruiz, V. Rodríguez, N. Cutillas, K. G. Samper, M. Capdevila, Ò. Palacios and A. Espinosa, Dalton Trans., 2012, 41, 12847–12856 RSC.
- Y. Hisamatsu, A. Shibuya, N. Suzuki, T. Suzuki, Y. Abe and S. Aoki, Bioconjugate Chem., 2015, 26, 857–879 CrossRef CAS PubMed.
- H. Chao, R. H. Li, C. W. Jiang, H. Li, L. N. Ji and X. Y. Li, J. Chem. Soc., Dalton Trans., 2001, 12, 1920–1926 RSC.
- D. Vinatier, P. H. Dufour and D. Subtil, Apoptosis: A programmed cell death involved in ovarian and uterine physiology Apoptosis: A programmed cell death involved in ovarian and uterine physiology, Eur. J. Obstet. Gynecol. Reprod. Biol., 1996, 67, 85–102 CrossRef CAS.
- S. N. Hajare, M. Subramanian, S. Gautam and A. Sharma, Biochimie, 2013, 95, 1722–1731 CrossRef CAS PubMed.
- Y. Chen, E. McMillan-Ward, J. Kong, S. J. Israels and S. B. Gibson, Cell Death Differ., 2008, 15, 171–182 CrossRef CAS PubMed.
- T. Kanzawa, I. M. Germano, T. Komata, H. Ito, Y. Kondo and S. Kondo, Cell Death Differ., 2004, 11, 448–457 CrossRef CAS PubMed.
- A. Biederbick, H. F. Kern and H. P. Elsasser, Eur. J. Cell Biol., 1995, 66, 3–14 CAS.
- D. C. Rubinsztein, J. E. Gestwicki, L. O. Murphy and D. J. Klionsky, Nat. Rev. Drug Discovery, 2007, 6, 304–312 CrossRef CAS PubMed.
- J. Yuan, Z. N. Lei, X. Wang, F. Zhu and D. B. Chen, Metallomics, 2015, 7, 896–907 RSC.
- H. Kashkar, K. Wiegmann, B. Yazdanpanah, D. Haubert and M. Kronke, J. Biol. Chem., 2005, 280, 20804–20813 CrossRef CAS PubMed.
- S. Sprouse, K. A. King, P. J. Spellane and R. J. Watts, J. Am. Chem. Soc., 1984, 106, 6647–6653 CrossRef CAS.
- T. Mosmann, J. Immunol. Methods, 1983, 65, 55–63 CrossRef CAS PubMed.
- K. K. Lo, T. K. Lee, J. S. Lau, W. L. Poon and S. H. Cheng, Inorg. Chem., 2008, 47, 200–208 CrossRef CAS PubMed.
| This journal is © The Royal Society of Chemistry 2017 |


