
 Open Access Article
 This Open Access Article is licensed under a Creative Commons Attribution-Non Commercial 3.0 Unported Licence
Controlling structural and magnetic properties of IONPs by aqueous synthesis for improved hyperthermia†
Debora Bonvin a,
Alla Arakcheeva‡
b,
Angel Millánc,
Rafael Piñolc,
Heinrich Hofmanna and
Marijana Mionić Ebersold*ade
a,
Alla Arakcheeva‡
b,
Angel Millánc,
Rafael Piñolc,
Heinrich Hofmanna and
Marijana Mionić Ebersold*ade
aPowder Technology Laboratory, Institute of Materials, Ecole Polytechnique Fédérale de Lausanne, Switzerland
bPhase Solutions Ltd, Lausanne, Switzerland
cInstituto de Ciencia de Materiales de Aragón, CSIC, Universidad de Zaragoza, Spain
dDepartment of Radiology, University Hospital (CHUV), University of Lausanne (UNIL), Switzerland. E-mail: Marijana.Mionic-Ebersold@chuv.ch
eCenter of Biomedical Imaging (CIBM), Lausanne, Switzerland
First published on 24th February 2017
Abstract
Iron oxide nanoparticles (IONPs) were synthesized by a novel aqueous synthesis route which combines co-precipitation (CP) and hydrothermal (HT) treatment, termed CP + HT, and compared with IONPs obtained by the standard CP method. Properties of both types of IONPs, including their morphology, diameters, composition, structure and crystallinity, as well as magnetic properties and toxicity were studied and correlated with the synthesis route. Their potential application as mediators for hyperthermia treatment has been evaluated by the specific absorption rate (SAR). Studies showed that IONPs obtained by a novel CP + HT route have a more controlled morphology, structure and crystallinity, leading to better magnetic properties and SAR as compared to IONPs synthesized by CP. Reported IONPs are also not toxic as shown by two assays in two cell lines. These results suggest that our IONPs are suitable for biomedical applications, especially as mediators for the hyperthermia treatment.
Introduction
Magnetic nanoparticles (MNPs) are widely used for numerous applications from solid state1 to biomedical ones.2–4 MNPs also have a large, unexploited potential for diagnostics, especially as MRI contrast agents, and for therapy, for instance via magnetically-induced hyperthermia.5 These possibilities are currently driving many research goals.6–11 Some of the most studied MNPs are iron oxide nanoparticles (IONPs), because of their biocompatibility, metabolization in the body, and versatile synthesis and properties.12 Magnetite (Fe3O4) has larger values for all desirable magnetic properties than maghemite (γ-Fe2O3); however the latter is preferred for biomedicine because the presence of Fe2+ in the former promotes oxidative stress.13 Moreover, superparamagnetic IONPs are favoured over ferromagnetic ones, since the latter fosters thrombosis and agglomeration.14One of the promising minimally-invasive cancer treatments is magnetically-mediated hyperthermia based on the sensitivity of cancer cells to temperatures ∼41 °C (ref. 15 and 16) generated by MNPs, located in tumour tissues, all placed in a homogeneous alternating magnetic field with frequency f and amplitude H.17,18 Due to both the maximal energy to which humans can be exposed and to temperature fluctuations, there is a limit for the product f·H, which is for the smaller exposed volume (like in a coil of 10 cm in diameter) ∼5 × 10⁹ A m−1 s−1.19,20 The heat generated by MNPs induces either directly cell death or tissue sensitization to increase the efficacy of other anti-cancer therapies. The heating ability of MNPs is quantified by the rate of heat dissipation per unit mass of MNPs; this is termed the specific absorption rate (SAR). Currently, one of the main obstacle for clinical applications of hyperthermia is that successful hyperthermia treatment requires large amounts of IONPs injected directly to the targeted site, as employed by Magforce.21 This excludes systemic injection, which would for example be essential for treating inaccessible metastases. Thus, there is a need to develop MNPs which have both higher SAR values for improved treatment with reduced injected dose, and which are effective under the clinically allowed f·H conditions.
Besides f and H, SAR is also a complicated non-linear function of the anisotropy constant K, the magnetic volume Vm, and the saturation magnetization Ms, where optimization of the first two variables has the largest effect on increasing SAR.22,23 The anisotropy constant has different contributions, among which the shape anisotropy has been mostly used for K increase in MNPs. Typically, the magnetic volume is smaller than the MNPs' volume due to structurally disordered in the “bulk” of a MNP and/or at the surface layer having disordered spins. Besides this, the optimal magnetic volume for SAR maximization in ideal spherical IONPs was calculated to correspond to an IONP diameter of ∼19 nm for an applied frequency of 300 kHz and magnetic field strengths of 2500–9000 A m−1.15,23 Unfortunately, using co-precipitation (CP), the most common method to synthesize IONPs, the control over their size and size distribution is thermodynamically limited.24 In the other frequently used synthesis method, the hydrothermal method (HT), the size control can be achieved by the choice of the synthesis parameters, such as the choice of organic solvent(s) and/or surface-capping agent(s), high temperature and/or pressure.25 Indeed, regardless of the synthesis route, these parameters are used to control all MNPs' variables important for SAR (shape, magnetic volume, structural order and magnetic properties). However, these synthesis parameters, along with frequently used toxic molecules/ions, are often noncompliant with regulations in nanomedicine,26 thus impairing clinical translation of numerous reported MNPs with properties showing great potential. For instance, among natural products magnetosomes obtained from AMB-1 magnetotactic bacteria have the highest reported SAR for ferrimagnetic IONPs of 875 W gFe−1 (obtained at 183 kHz and 32 kA m−1, f·H = 5.86 × 10⁹ A m−1 s−1).27 Among numerous other previous studies, the highest SAR of 509 W gFe−1 for engineered IONPs in the clinical limit (at f·H = 4.8 × 10⁹ A m−1 s−1) has been reported for 19 nm nanocubes synthesized by a non-aqueous thermal decomposition.28 The highest SAR by microwave-based method was 430 W gFe−1 for citric acid coated multi-core IONPs of 17 nm at 10.5 kA m−1 and 950 kHz.29 On the other side, γ-Fe2O3 IONPs synthesized by the aqueous routes such as CP or HT without capping agents typically have SAR values well below 100 W gFe−1 in the clinically relevant conditions.30,31
From the above, we identified the goal of developing IONPs with controlled properties to act as efficient mediators for hyperthermia treatment by increased SAR. Further, these IONPs would need to be synthesized in conditions that enable translational research (e.g. no toxic molecules/ions, no organic solvent(s), no capping agent(s), minimal elevated temperature and/or pressure). Achieving this goal requires not only detailed understanding of structural–properties relationships, but further correlation of these to the synthesis mechanism in order that the important IONP variables can be controlled.
Here, we report a study of the structure–properties relation in IONPs synthesized by our novel aqueous synthesis route which combines CP and HT treatment, termed CP + HT. This led to IONPs with an optimal set of properties including shape, size (volume), structural order, crystallinity, and saturation magnetization, as well as favourable chemical composition and single domain IONPs. Consequently, our IONPs obtained by the novel aqueous synthesis route CP + HT have increased SAR values as compared to IONPs obtained by CP. Moreover, these results were obtained under conditions facilitating clinical translation, and thus have real potential for the hyperthermia treatment.
Experimental
Synthesis of IONPs
Characterisation of IONPs
D = Kλ/[(π/180)(Bobs2 − Bstd2)1/2![[thin space (1/6-em)]](https://www.rsc.org/images/entities/char_2009.gif) cosθ] cosθ] |
The contribution of the lattice strain into the line broadening is only 0.5–1.6% Bobs in the analysed sample. This contribution affects the average size value beyond the estimation accuracy. The log-normal distribution function has been used for the estimation of the crystallite size distribution:
| F(x) = [1/(xσ√2π)]exp{−[ln(x/m)]2/2σ2} |
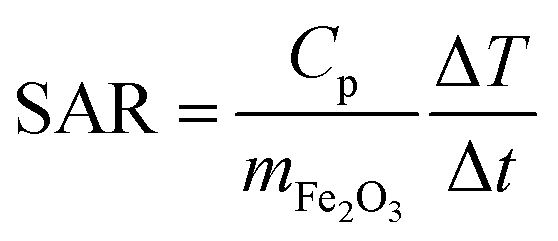
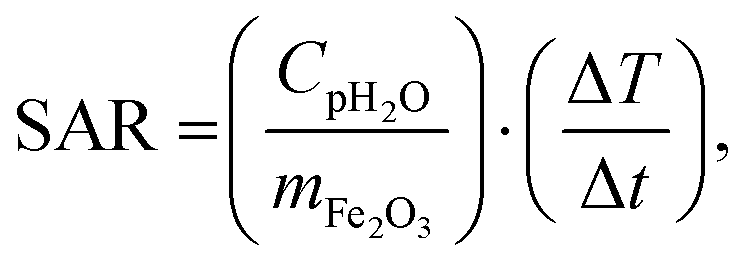
000 Hz have been performed as a function of temperature, and AC susceptibility measurements at 300 K have been performed as a function of frequency in a PPMS 9T equipment from Quantum Design. M(H) hysteresis cycles were measured in a MPMS 5S equipment also from Quantum Design. The magnetic measurements were carried out in double gelatin capsules loaded with 100 μl of the as prepared sample suspensions. The diamagnetic contribution of the container and the water was also measured and subtracted from the total magnetization.where Cp is the effective specific heat capacity ((Cp(H2O) × mH2O/mtot) + (Cp(Fe2O3) × mFe2O3/mtot)), mtot the total mass of the sample, mFe2O3 the mass of magnetic material in the sample and ΔT/Δt the slope of the linear part of the heating curve. SAR values are given as the mean of three measurements.
Results and discussion
IONPs were synthesized by our novel aqueous synthesis method which combines standard CP and HT treatment, and thus named CP + HT.34 In our previous study, we optimized the synthesis parameters, such as the Fe3+/Fe2+ ratio, base concentration, temperature, synthesis duration, that allowed us control over the size, shape and phase of these IONPs.34 Briefly, stoichiometric amounts of Fe2+ and Fe3+ salts were co-precipitated in alkaline milieu and subsequently hydrothermally treated for 24 h. Subsequent oxidation yielded preferred γ-Fe2O3 IONPs which were then characterized without size separation, corresponding to IONPs' sample CP + HT. In order to assess if IONPs obtained by this novel synthesis route had advantageous properties with respect to IONPs synthesized by standard CP,32,33 we studied and compared the properties of both types of IONPs, novel CP + HT and standard CP.Morphology and composition
Representative transmission electron microscopy (TEM) micrographs of IONPs in samples CP and CP + HT are shown in Fig. 1 (a and b, respectively). The difference in the shape of IONPs in these samples can be seen. IONPs in sample CP had irregular shapes with a tendency towards spherical one (Fig. 1a and insert). On the contrary, the IONPs in sample CP + HT had clearly defined and mostly faceted surfaces, and also, defined shapes (typically rectangular or ellipsoidal and spherical). Moreover, as expected, IONPs in sample CP + HT exposed to HT treatment resulted in larger particles. The primary particle diameter or equivalent diameter, often termed “TEM diameter”, dT, was calculated from 1000 manually measured IONPs' Feret diameters from representative TEM micrographs (see the Experimental section for calculation details). Fig. 1c shows a distribution of the obtained dT. The average dT were (9.0 ± 2.5) nm and (18.1 ± 4.9) nm for IONPs in samples CP and CP + HT, respectively. Besides dT, the hydrodynamic diameter, dH, is also important especially for biomedical applications where IONPs are suspended in liquid. An insert in Fig. 1c shows a number weighted distribution of the obtained dH. The average dH measured by dynamic light scattering (DLS) were (16.1 ± 4.5) nm and (30.2 ± 9.1) nm from number weighted distributions of IONPs in samples CP and CP + HT, respectively (and from volume weighted distributions dH were (22.5 ± 13.9) nm and (40.5 ± 16.5) nm, respectively). The measured dH of IONPs is consistent with the corresponding dT, indicating typically up to two IONPs per agglomerate. This means that our non-coated IONPs do not strongly aggregate, a property that is preferable for biomedicine. All values obtained for IONPs in sample CP are consistent with previously reported values.32,33 Evidently, the change in the synthesis route not only reflects a difference in shape of IONPs, but also brings an expected change in the diameter of IONPs.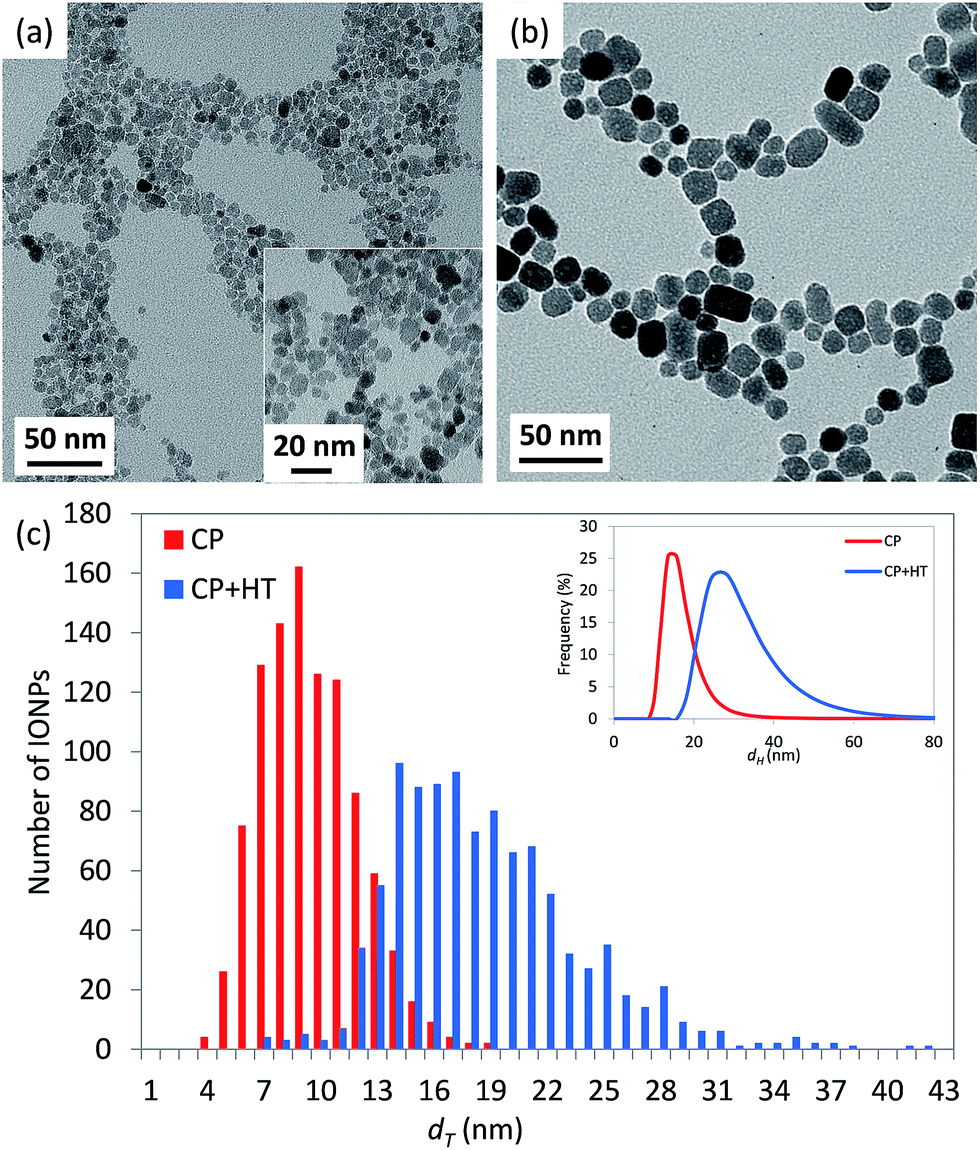 | ||
| Fig. 1 Representative TEM micrographs of IONPs in samples CP (a) and CP + HT (b). Insert in (a) shows TEM micrograph of the same sample with higher magnification. (c) Shows distribution of the primary particle diameter (“TEM diameter”, dT) and an insert shows a number weighted distribution of the hydrodynamic diameter, dH, for both samples. | ||
Concerning the composition, infra-red (IR) spectra are often used to discriminate between γ-Fe2O3 and Fe3O4, since the latter displays one distinct peak at 571 cm−1. In contrast, γ-Fe2O3 displays several bands between 800 and 400 cm−1 and the number of these bands increases with higher ordering of vacancies.38,39 The IR spectra of the IONPs both as a suspension and as powders (see Fig. S1a and b†) showed multiple bands between 800 and 400 cm−1, which indicate a structure close to vacancy ordered γ-Fe2O3. The structure of the IONPs was also evaluated by X-ray photoelectron spectroscopy (XPS), with the spectra confirming no structural difference between the samples. In addition, the core-level spectra in the Fe 2p regions correspond to γ-Fe2O3 40 (spectra are given in Fig. S2†). Moreover, we have performed UV-vis absorption measurement of IONPs suspensions and the obtained spectra (see Fig. S3†) for samples CP and CP + HT showed a small change in the absorption band maxima (from smaller to larger IONPs' samples, from 227 nm to 232 nm, respectively) with peak broadening for the second sample associated to corresponding diameter broadening. Both, small peak shift and peak broadening were previously observed in transition metal oxides MNPs (especially in a systematic study of UV-vis absorption spectra of MNPs with different shape and size).41–43
Structure analysis
Standard powder X-ray diffraction does not allow for distinguishing between different possible γ-Fe2O3 structures. Therefore, the structure of IONPs in our samples was studied by the synchrotron radiation powder diffractometry at the Swiss-Norwegian beam-line (ESRF, Grenoble). For the powder XRD pattern of IONPs in sample CP, all diffraction reflections of γ-Fe2O3 can be fitted using the magnetite space group Fd![[3 with combining macron]](https://www.rsc.org/images/entities/char_0033_0304.gif) m with the cubic unit cell parameter a = 8.3512(2) Å and no superstructure reflections are observed (the powder XRD profiles, experimental, calculated and different, are shown in Fig. S4†); for characteristics of the structural parameters see Table S1.† Refinement of the Fe atom occupation in octahedron (85.5%) and tetrahedron (100%) positions of the magnetite structure leads to the composition Fe2.03(2)O3. Several single diffraction reflections selected for the crystalline diameter estimation (see Table S2†) point to isotropic crystalline diameter with the average value of (9.4 ± 0.1) nm. This value is in agreement with the dT of (9.0 ± 2.5) nm determined from the TEM study.
m with the cubic unit cell parameter a = 8.3512(2) Å and no superstructure reflections are observed (the powder XRD profiles, experimental, calculated and different, are shown in Fig. S4†); for characteristics of the structural parameters see Table S1.† Refinement of the Fe atom occupation in octahedron (85.5%) and tetrahedron (100%) positions of the magnetite structure leads to the composition Fe2.03(2)O3. Several single diffraction reflections selected for the crystalline diameter estimation (see Table S2†) point to isotropic crystalline diameter with the average value of (9.4 ± 0.1) nm. This value is in agreement with the dT of (9.0 ± 2.5) nm determined from the TEM study.
On the other side, the structure of IONPs in sample CP + HT turns to be much more complex than in the previous case of CP sample. In fact, the obtained powder XRD pattern of the former sample (Fig. 2) shows one phase – maghemite, γ-Fe2O3, and the majority of the diffraction maxima can be fitted using the magnetite space group Fdm with the cubic unit cell parameter a = 8.3551(3) Å. However, three weak reflections, 101, 102 and 112, (marked red in Fig. 2) violate the glide planes d. Hence, the cubic subgroup P4332, which is non-centrosymmetric and free of the d-planes, has been used for the deeper structure investigation. This space group allows distinguishing between Fe-octahedral positions, being of 62% and 95% occupancy (octa-positions 4b and 12d, respectively), while the tetrahedron position shows of 98.5% occupancy (see a scheme of regular structure in section normal to [1−10] given in Fig. S5a†). The composition has been refined as Fe2.06(2)O3. For this model (Model I in Fig. S5†), residual electron density map (REDM) calculated in the vicinity of Fe and O atoms contains a set of regularly distributed significant extra maxima, which are not associated with the regular structure (Fig. S5b† left panel). The extra maxima have been interpreted as a contribution of enantiomorphous distribution of Fe atoms linked by the inversion centre with the main structure at the same close packing of O atoms (Fig. S5b† right panel). An inclusion of 2% enantiomorphic contribution (Model II in Fig. S5†) removes the extra-maxima from REDM (Fig. S5b† right panel) and better fits the powder XRD profile (experimental, calculated and different are given in Fig. S6†). Characteristics of the structural parameters are given in Table S3.† Some domains of maghemite contain areas with a statistical distribution of Fe atoms corresponding either to the main or to the enantiomorphic modifications. The close packing of O-atoms is homogeneous in each domain, i.e. common for both Fe distributions. In average, about 2% Fe atoms match their enantiomorphous distribution. A few possible intergrowth schemes are proposed and shown in Fig. S7.† Interestingly, one very weak diffuse reflection points to a tendency to form a superstructure. This reflection can be indexed as 202 in the tetragonal unit cell with atet = acub and ctet = 3ccub (insert in Fig. 2). The average crystallite diameter was estimated equal to (17.4 ± 0.1) nm with practically isotropic variation from 16.6 nm to 18.5 nm depending on the crystallographic direction (see Table S8†). These values are in agreement with the dT of (18.1 ± 4.9) nm determined by TEM.
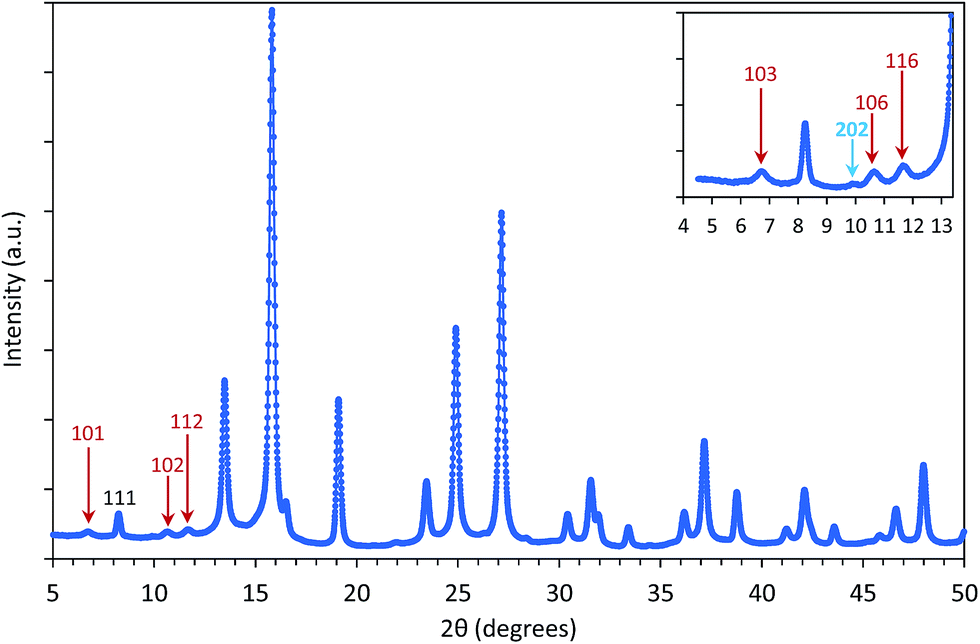 | ||
| Fig. 2 The powder XRD profile of IONPs in sample CP + HT. Profile fit in space group P4332 with the unit cell parameter a = 8.3552(4) Å. The reflection incompatible with the space group Fdm are indicated by red arrows. In insert, reflections are indexed in tetragonal unit cell with the triple c-parameter: atet = acub and ctet = 3ccub. Blue arrow points to diffuse reflection 202. | ||
The iron vacancies distribution in the octahedral sites in γ-Fe2O3, and their degree of ordering have been the focus of studies over several decades.44–46 In the case that cation vacancies are randomly distributed over the octahedral sites, the space group is Fdm as in magnetite, Fe3O4.12 However, if the iron vacancies are not distributed over all 16 octahedral sites and instead are constrained only to Wyckoff 4b sites, the symmetry in such γ-Fe2O3 is P4332.46 That was firstly proposed by Braun44 based on the extra reflections in the powder diffraction pattern, as we observe in sample CP + HT. Even further, as firstly proposed by Oosterhout and Rooijmans45 complete ordering of iron atoms would result in a spinel tetragonal superstructure with spinel cubic cell tripled along the c axis, e.g. c = 3a, as we also observe in our sample CP + HT. Thus, we observe different iron vacancies ordering in IONPs in our samples. In sample CP, iron vacancies are randomly distributed over all octahedral sites and thus, the space group Fdm could be used. This is in agreement with previous studies which reported that very small NPs of γ-Fe2O3 do not show vacancy ordering.12,46,47 On the contrary, for IONPs in sample CP + HT, space group P4332 has been found implying iron vacancies ordering even with a tendency to form superstructure. The same observation was previously reported for IONPs with crystalline diameter larger than 64 nm or 84 nm.47 This higher order in the structure of IONPs that we found in the second sample can be associated to the novel synthesis route which includes a HT step that allows for crystallisation and hence, equilibration of iron vacancies.
Magnetic properties
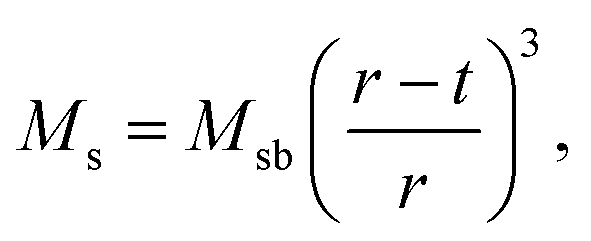
For applications of NPs in hyperthermia treatment, it is crucial to control magnetic properties of the materials, and therefore, detailed characterization of magnetic properties was done for IONPs.From the measurement of magnetisation as a function of magnetic field strength, H (M(H) curves are given in Fig. 3a), (mass) saturation magnetisation, Ms, can be obtained as a plateau where value of M saturates. In our samples CP and CP + HT (Fig. 3a) Ms of IONPs were 65.5 A m2 kgFe2O3−1 and 72 A m2 kgFe2O3−1, respectively. The obtained Ms values are lower than Ms of bulk γ-Fe2O3, 74 A m2 kg−1.48 This is often explained by the existence of a magnetically inactive (also called “dead”) layer49 which consists of disordered spins at the surface of MNPs, as introduced by Sato et al.50 This layer reduces the magnetic volume with respect to the total volume, and the Ms value of the IONPs is lower than that of the bulk, Msb. Thus, Ms measured for MNPs can be written as:51
 | (1) |
819μB and 115672μB for CP and CP + HT IONPs, respectively, calculated by standard equation: μ = MsρVm, where ρ is the density of γ-Fe2O3 (5242 kg m−3).52 The obtained difference of the order of magnitude is consistent with the difference in the magnetic volume, and with other reported values.53
 | ||
| Fig. 3 (a) Magnetization measured as a function of magnetic field strength, H, (M(H) curves) used for extrapolation of saturation magnetisation, Ms. The in-phase (b) and out-of-phase (c) AC susceptibility measurements of suspension of IONPs in both samples as a function of temperature at frequencies of 2154 Hz. | ||
AC susceptibility, χ, versus temperature, T, of suspension of IONPs in both samples was measured at a frequency of 2154 Hz (Fig. 3b and c). The obtained curves of both samples showed a gradual increase of χ along with T. The first feature to be outlined is the high jump of the susceptibility when the liquid melts. At this moment the blocked nanoparticles (ferrimagnetic) can rotate following the field in what is called Brownian relaxation. For sample CP a peak can be clearly observed at a T of ∼120 K that corresponds to the blocking T, TB, in a superparamagnetic (SPM) system or to the Verwey transition in a superspin glass (SSG) system.54 Furthermore, the in-phase (χ′) and out-of-phase (χ′′) AC susceptibility versus T were measured at several frequencies of the alternating field (100 Hz, 464 Hz, 2154 Hz and 10000 Hz) and the expected peak shift could be observed (Fig. S8 and S9†).
The effective anisotropy constant, K, is often calculated from the blocking temperature TB, which is for a single domain MNPs given by the expression:55
 | (2) |
For relatively small IONPs (roughly with diameter below ∼20 nm) TB can be obtained from DC measurement (a peak in the ZFC curve) or from AC measurement (a peak in the out-of-phase susceptibility, χ′′, as a function of temperature).56 The obtained TB corresponding to the χ′′ peak position is in the range of ∼105–125 K (Fig. S8†). This allows us to roughly estimate the effective anisotropy constant K of sample CP from the expression (2), as 10.7–12.7 × 10⁴ J m−3. That is in agreement with values of K reported from IONPs of the comparable diameter.57,58
For sample CP + HT with average dT of 18.1 nm (average crystalline diameter 17.4 nm), a peak in χ vs. T curve is not visible, as also observed by others that larger IONPs (roughly with diameter above ∼20 nm) have TB above 250–300 K.59,60 Since such IONPs have TB above 250 K, meaning above the usual χ vs. T measurement range and also above the bifurcation T in ZFC-FC curves, their K has to be obtained by some other mean. In fact, Bean and Livingston55 derived the following expression for single domain particles in superparamagnetic regime bellow the blocking temperature:
 | (3) |
 | ||
| Fig. 4 Hysteresis curves at 250 K in the frozen state and at 300 K in the liquid state, as well as the magnified region around zero for both hysteresis curves (corresponding inserts). | ||
These values for the effective anisotropy constant of IONPs are in agreement with previously reported values.57,58,70 We observed an increase of K in the CP sample with smaller diameter of IONPs. This often observed behaviour in small MNPs has been discussed from different contradictory angles. For instance Goya et al. attributed enhancement of the MNP's anisotropy mainly to the effect of dipolar interactions.69 On the other hand, the increase of K in MNPs with smaller diameter is often attributed to the enlarged contribution of surface anisotropy to K. In fact, Bødker et al. proposed that Keff has two main contributions, from the volume and the surface anisotropy energy constants, Kv and Ks, respectively.71 The phenomenological expression which describes this for the spherical MNPs with diameter d is:71
 | (4) |
In fact, this approach often results in an estimated value of Kv for MNPs close to that of the magnetocrystalline anisotropy energy (first-order) constant of the bulk material.71 Therefore, we approximated Kv with the magnetocrystalline anisotropy energy (first-order) constant of bulk γ-Fe2O3 that is 4.64 × 10³ J m−3.72 Thus, Ks obtained from the expression (4) was 1.69 × 10⁻⁴ J m−2 for the sample CP which is one order of magnitude higher than Ks of the other sample, 8 × 10⁻⁵ J m−2, suggesting a higher contribution of the surface anisotropy to the effective anisotropy for the smaller IONPs, as expected, and reported by others.71
Hyperthermia effect
For MNPs, heat dissipation depends on three material's properties: Néel and Brownian relaxation times (related to spin and particle relaxation, respectively), and hysteresis losses. SAR, as a rate of heat dissipation per unit mass of MNPs, is typically determined by these mechanisms. The highest SAR values give MNPs which are ferro/ferrimagnetic and hard magnetic phase.8,10,15 In spite of this, for nanomedicine are preferred superparamagnetic and soft magnetic phase MNPs, as shown for our IONPs (see Fig. 4 for M(H) curves, and Table S5† for coercivity and remanence). Using the above mentioned values for K leads to a Néel relaxation time of 3.3 × 10⁻⁵ s and a Brownian relaxation time of 1.01 × 10⁻⁶ s for sample CP; whereas for sample CP + HT relaxation times of 3.79 s (Néel) and 3.91 × 10⁻⁶ s (Brownian) were calculated. Thus, for our superparamagnetic IONPs' suspensions, the prevalent relaxation mechanism is the Brownian relaxation with a small contribution of the Néel relaxation, as expected for suspensions.73In order to obtain SAR values, suspensions of IONPs were exposed to AC magnetic field and the increase in temperature with time (heating curve) was measured (Fig. 5a and b). It is worth noting that there are no standards for equipment and measurement procedures of SAR, leading to variability and issues of reproducibility in reported SAR values.74,75 Thus, the heating curves of all samples were measured minimum three times and the results show less than 10% deviation in-between the measurements (see Fig. S10†). The SAR values were extrapolated from the heating curves (Fig. 5a and b) by using the formula:
 | (5) |
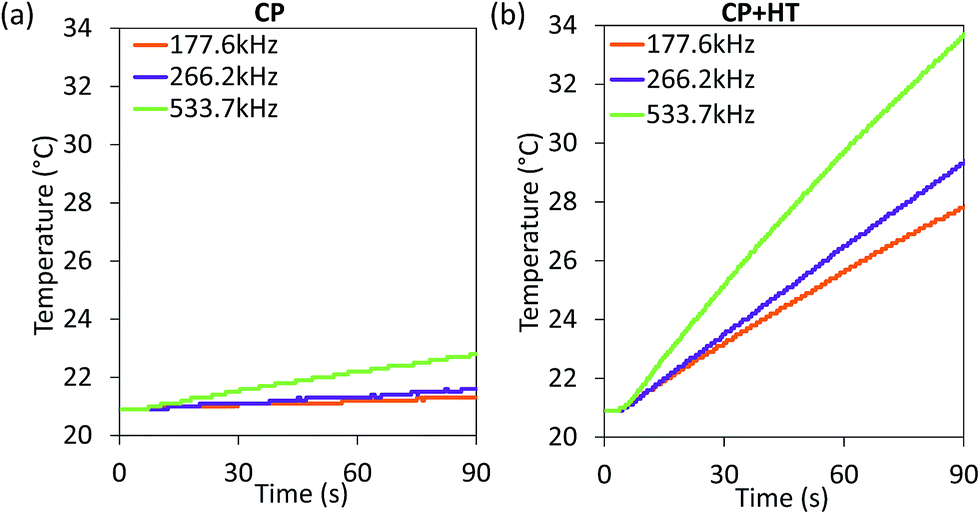 | ||
| Fig. 5 Heating curves of IONPs in sample CP (a) and CP + HT (b) in aqueous suspension subjected to an AC field (24 kA m−1 and three indicated frequencies). | ||
Since SAR depends on parameters of the alternating magnetic field, f and H, SAR values were measured at H of ∼24 kA m−1 at three different frequencies (177.6 kHz, 266.2 kHz and 533.7 kHz) (Fig. 6a). As expected, SAR increased with increasing frequency, an increase that is more pronounced for larger IONPs, as also observed by others.76 Besides the correlation of SAR with f and H individually, their product f·H is important for clinical applications. As mentioned above, the product f·H should be below ∼5 × 10⁹ A m−1 s−1 for a safe clinical treatment by hyperthermia (this value depends on the exposed volume).15 Thus, Fig. 6b shows SAR versus the f·H product and we can see that the highest obtained SAR values at clinically relevant conditions (f·H ≤ 5 × 10⁹ A m−1 s−1) are 4.6 W gFe2O3−1 and 57.1 W gFe2O3−1 (6.6 W gFe−1 and 81.6 W gFe−1) for CP and CP + HT, respectively. This value for sample CP + HT is higher than SAR of 12.5 W gFe2O3−1 reported for IONPs of comparable size (dT 24.0 ± 5.8 nm) synthesized by the HT route at the same temperature and for the same duration of HT treatment as our sample. Outside of the clinical constrain for the f·H product, the highest SAR of 85.7 W gFe2O3−1 (122.5 W gFe−1) was obtained for sample CP + HT at 533.7 kHz and 24.6 kA m−1 (f·H = 10.4 × 10⁹ A m−1 s−1). Moreover, at all frequencies higher SAR values were obtained for samples CP + HT. This was expected based firstly on high crystalline ordering and consequential better magnetic properties than found in the sample with lower SAR, but also based on a relatively broad size distribution of this sample (see Fig. 1c, no size exclusion performed), since smaller and larger IONPs contribute simultaneously to SAR increase by Néel and Brownian relaxations, respectively.15
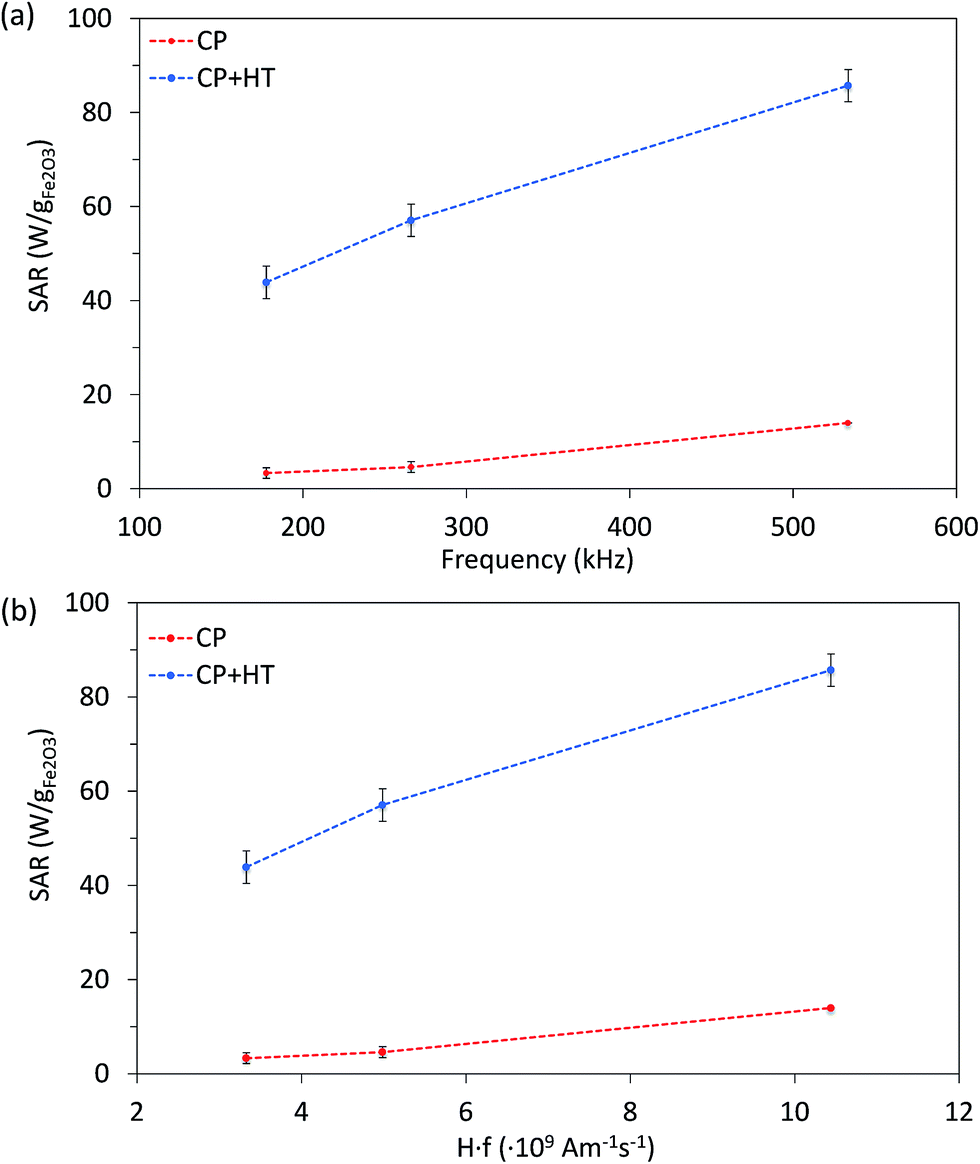 | ||
| Fig. 6 SAR of both IONP samples as function of frequency at 24 kA m−1 (a) and of the f·H product (b). Dashed lines are guide for the eyes. | ||
The strong dependence of SAR on f and H makes it difficult to compare SAR values measured at different fields. In order to overcome this issue, intrinsic loss power (ILP) was introduced as SAR normalized to f·H2,77 derived from relaxation theory; it applies only to small field amplitudes and small MNP size (the Néel relaxation model).15 The ILP values as a function of the f·H product for all measured fields and frequencies are given in Fig. 7. The highest obtained ILP value was 0.7 nH m2 kg−1 (SAR = 43.9 W gFe2O3−1, f·H = 3.3 × 10⁹ A m−1 s−1) for sample CP + HT. However, it is clear that for our IONPs the approach of describing heating efficacy by ILP values is incorrect, because the validity of ILP is limited to small field amplitudes and to the Néel relaxation model, which is often neglected, as stressed by Dutz and Hergt.15 Thus, this approach is applicable for a limited number of systems and is not sufficient to describe the actual heating capability of MNPs.
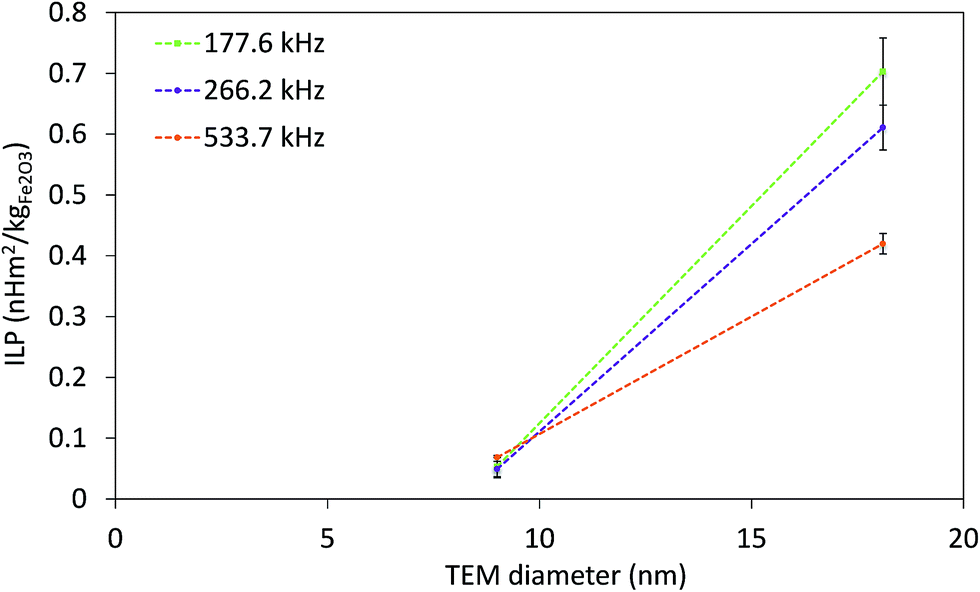 | ||
| Fig. 7 ILP at three indicated frequencies of both IONP samples as function of TEM diameter. Dashed lines are guide for the eyes. | ||
It has to be pointed out that modelling of SAR does not fit our experimental data suggesting that better understanding of a relation between models and the experimental results is urgently needed. Thus, a consideration of this issue is our next step.
Toxicity
For biomedical applications, it is essential that MNPs are nontoxic. Thus, for a preliminary toxicity assessment, we measured the cell viability (a relative number of live cells incubated 24 h with and without IONPs). The viability of HeLa cells after their exposure to different IONPs' concentrations was assessed with the MTS assay, which measures the intracellular mitochondrial activity via the absorbance of the coloured formazan product at 490 nm (Fig. 8a). After 24 h incubation of cells with IONPs, the cell viability was higher than 96% for Fe concentrations up to 200 μgFe ml−1 for both samples. This would suggest that our IONPs are nontoxic. However, it is known that for NPs, different toxicity tests give often different results and thus, lot of effort is placed in standardization and regulations in this domain.78 Therefore, we also measured the cytotoxicity of IONPs using the PrestoBlue® assay (Fig. 8b), which was obtained from the fluorescence of the resazurin product at 615 nm. The results given in Fig. 6b showed that IONPs in sample CP + HT are nontoxic even for higher concentrations of iron (up to 200 μgFe ml−1), while IONPs in sample CP showed low toxicity, e.g. the viability of HeLa cells was higher than 64% for high iron concentration, 200 μgFe ml−1. It is known that different cell lines can show different toxicity responses for the same NPs. Since IONPs in sample CP showed low toxicity with HeLa cells, we additionally tested their toxicity with one more cell line (lymph node metastatic cells from prostate cancer, LnCaP cells) by both previously mentioned assays, the MTS assay (Fig. 8c) and the PrestoBlue® assay (Fig. 8d). By the MTS assay (Fig. 8c), we obtained that IONPs of sample CP are nontoxic for both cell lines, while the PrestoBlue® assay (Fig. 6d) showed low and moderate cytotoxicity for higher iron concentration in the case of HeLa and LnCaP cells, respectively. These persistently observed differences in the two assays, the MTS and the PrestoBlue® assays, suggest that there is an urgent need for standardization in the domain of NPs' toxicity assessment and moreover, that better understanding of the MTS method itself is needed. The study in that direction is ongoing.78,79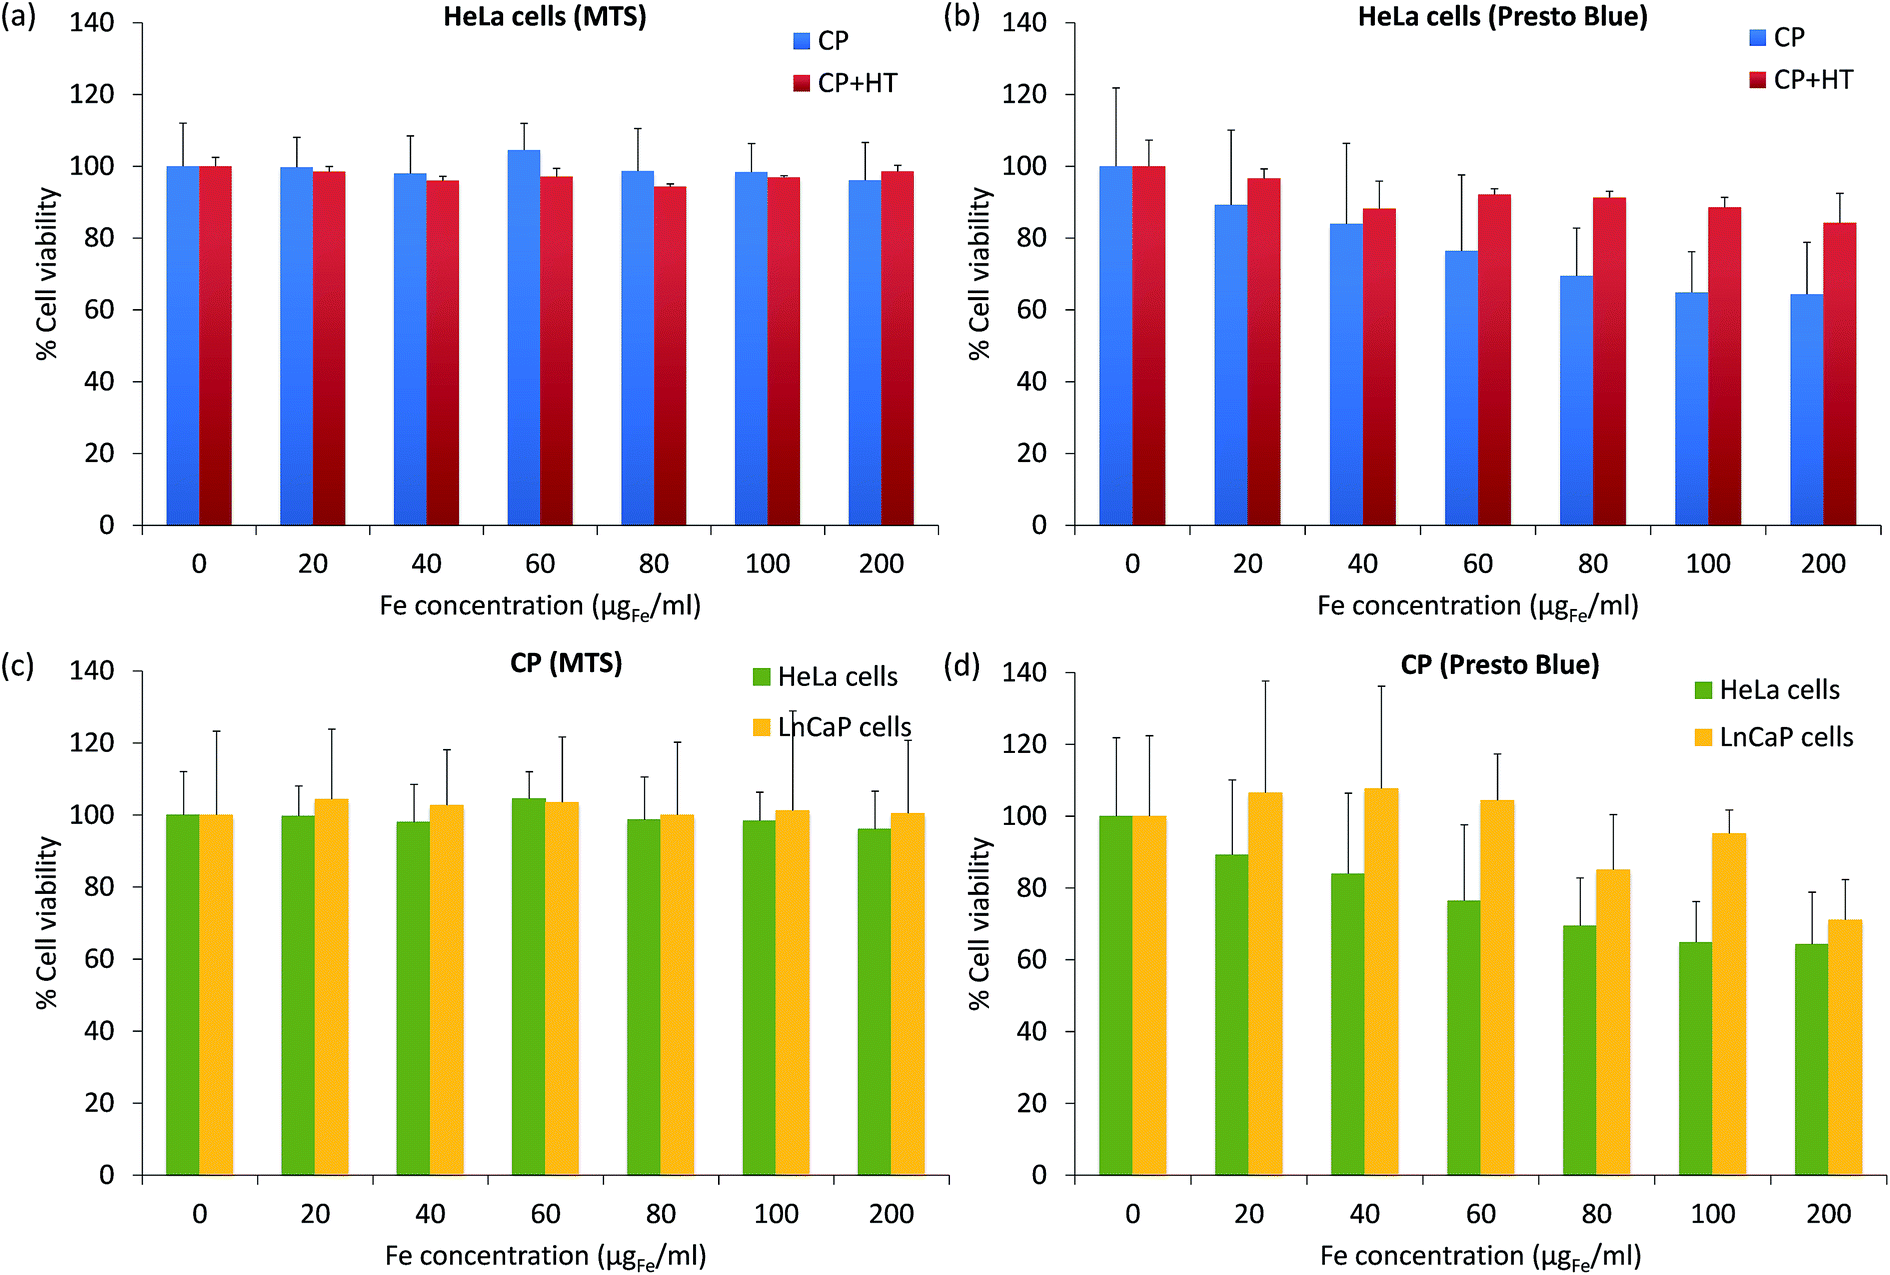 | ||
| Fig. 8 Cell viability upon exposure to different IONPs' concentrations (Fe concentration was from 0 to 200 μgFe ml−1) of: HeLa cells assessed by the MTS assay (a) and the PrestoBlue® assay (b) for both samples; HeLa and LnCaP cells assessed by the MTS assay (c) and the PrestoBlue® assay (d) for sample CP. | ||
The advantage of CP + HT synthesis
As all previous characterisations showed, compared to sample CP, IONPs in sample CP + HT had advantageous properties arising from high structural order. In fact, all these properties, such as crystalline order, Ms, Vm, t, K, SAR, are mutually correlated and “driven” by ordering in the structure. In fact, it has been even reported that vacancy ordering cannot occur in very small IONPs because of numerous reasons, such as: often too short synthesis time and/or too low synthesis temperature, which both do not allow complete development of ordering; but also surface effects which change the preferential distribution of cations and contribute to vacancy disorder.12,46,47,80 Indeed, iron vacancies ordering has been very rarely reported for small IONPs of ∼10 to 30 nm.51,80 Moreover, these rare results were obtained only for heat treated dry powders. But unfortunately, for biomedical applications IONPs need to remain in suspension. Thus, the challenge of synthesising highly-structurally-ordered IONPs for biomedical applications by solely wet chemistry (without any drying step) was overcome in this work.As mentioned above, we found in IONPs of sample CP + HT P4332 symmetry with a tendency of iron vacancies ordering to form superstructure. The same observation was previously reported in IONPs with crystalline diameter larger than 64 nm or 84 nm where former IONPs were heat treated for 6 h at 280 °C.47,81 Here, we obtained highly ordered structure in our IONPs with crystalline diameter of only 17.4 nm as a consequence of the novel synthesis route CP + HT. Thus, under the conditions of our CP + HT synthesis route, previously unexpected vacancy ordering occurs due to the specific synthesis conditions which include a relatively long HT treatment of 24 h at a relatively low temperature of 120 °C that all allow for equilibration of the iron oxide structure.
Moreover, an increase in magnetic properties is coupled with a decrease in spin canting at surface and/or in the bulk on MNP. In fact, it has been shown that among these two effects, the former has lower contribution to diminishing of magnetic properties. Thus, a control over spin canting which result from both structural disorders in the interior and on the surface of IONP is a key factor to control magnetic properties of MNPs, which is the case in our IONPs in sample CP + HT.
Conclusions
In summary, we have studied how our novel synthesis route CP + HT impacts the overall properties of the obtained IONPs and compared these with the corresponding properties of IONPs synthesized by the standard CP method. The results showed that the novel CP + HT synthesis has a strong impact on the overall properties of the obtained IONPs, especially on the magnetic properties and the magnetic heating power of the samples, and yields IONPs with superior properties as compared to IONPs obtained by CP. More importantly, concerning the structure, IONPs obtained by the CP + HT method had P4332 symmetry with a tendency of iron vacancies ordering to form superstructure. Thus, this is the first report of such high structural order in the IONPs synthesised without drying and in addition, with such a small diameter. The higher order in the structure of IONPs in CP + HT sample can be associated to the novel synthesis route which includes a HT step that allows for crystallisation and hence, equilibration of iron vacancies. We also showed that our IONPs synthesized by the CP + HT method are nontoxic. Moreover, the CP + HT synthesis route fulfils requirements of nano-safety regulations. For all these reasons, the reported IONPs have real potential for biomedical applications.Acknowledgements
This work was financially supported by the MagnetoTeranostics project that was scientifically evaluated by the Swiss National Science Foundation (SNSF), financed by the Swiss Confederation and funded by Nano-Tera.ch (Magnetotheranostics project No 530 627) and by the Nanoneck2 project funded by Eurostars (Project E!9309 Nanoneck2). We thank to the Interdisciplinary Centre for Electron Microscopy (CIME), Central Environmental Laboratory (CEL) and the Molecular and Hybrid Materials Characterisation Center (MHMC) all at EPFL for access to their facilities and technical support. We are also grateful to Phil Pattison and Swiss-Norwegian beamline (ESRF, Grenoble) for the synchrotron radiation XRD experiments. This work was partially supported by the Spanish Ministry of Science and Innovation (MAT2014-54975-R). The authors would like to acknowledge the use of Servicio General de Apoyo a la Investigación-SAI, Universidad de Zaragoza.References
- S. Singamaneni, V. N. Bliznyuk, C. Binek and E. Y. Tsymbal, J. Mater. Chem., 2011, 21, 16819–16845 RSC.
- T. Neuberger, B. Schöpf, H. Hofmann, M. Hofmann and B. von Rechenberg, Proc. Fifth Int. Conf. Sci. Clin. Apllications Magn. Carr., 2005, vol. 293, pp. 483–496 Search PubMed.
- R. Piñol, C. D. S. Brites, R. Bustamante, A. Martínez, N. J. O. Silva, J. L. Murillo, R. Cases, J. Carrey, C. Estepa, C. Sosa, F. Palacio, L. D. Carlos and A. Millán, ACS Nano, 2015, 9, 3134–3142 CrossRef PubMed.
- T. Hoare, B. P. Timko, J. Santamaria, G. F. Goya, S. Irusta, S. Lau, C. F. Stefanescu, D. Lin, R. Langer and D. S. Kohane, Nano Lett., 2011, 11, 1395–1400 CrossRef CAS PubMed.
- C. Tassa, S. Y. Shaw and R. Weissleder, Acc. Chem. Res., 2011, 44, 842–852 CrossRef CAS PubMed.
- T. Gillich, C. Acikgöz, L. Isa, A. D. Schlüter, N. D. Spencer and M. Textor, ACS Nano, 2013, 7, 316–329 CrossRef CAS PubMed.
- O. Pascu, E. Carenza, M. Gich, S. Estradé, F. Peiró, G. Herranz and A. Roig, J. Phys. Chem. C, 2012, 116, 15108–15116 CAS.
- S. Noh, W. Na, J. Jang, J.-H. Lee, E. J. Lee, S. H. Moon, Y. Lim, J.-S. Shin and J. Cheon, Nano Lett., 2012, 12, 3716–3721 CrossRef CAS PubMed.
- V. Mameli, A. Musinu, A. Ardu, G. Ennas, D. Peddis, D. Niznansky, C. Sangregorio, C. Innocenti, N. T. K. Thanh and C. Cannas, Nanoscale, 2016, 8, 10124–10137 RSC.
- J.-H. Lee, J. Jang, J. Choi, S. H. Moon, S. Noh, J. Kim, J.-G. Kim, I.-S. Kim, K. I. Park and J. Cheon, Nat. Nanotechnol., 2011, 6, 418–422 CrossRef CAS PubMed.
- A. Walter, C. Billotey, A. Garofalo, C. Ulhaq-Bouillet, C. Lefèvre, J. Taleb, S. Laurent, L. Vander Elst, R. N. Muller, L. Lartigue, F. Gazeau, D. Felder-Flesch and S. Begin-Colin, Chem. Mater., 2014, 26, 5252–5264 CrossRef CAS.
- R. M. Cornell and U. Schwertmann, The Iron Oxides: Structure, Properties, Reactions, Occurences and Uses, Wiley Online Library, Wiley-VCH Verlag GmbH & Co. KGaA, 2nd edn, 2004 Search PubMed.
- T. S. Koskenkorva-Frank, G. Weiss, W. H. Koppenol and S. Burckhardt, Free Radical Biol. Med., 2013, 65, 1174–1194 CrossRef CAS PubMed.
- A. N. Ilinskaya and M. A. Dobrovolskaia, Nanomedicine, 2013, 8, 969–981 CrossRef CAS PubMed.
- S. Dutz and R. Hergt, Nanotechnology, 2014, 25, 452001 CrossRef PubMed.
- C. J. Busch, in Verhandlungen des naturhistorischen Vereines der preussischen Rheinlande und Westphalens, Max Cohen and Sohn, Bonn, ANDRÄ, C.J., 1866 Search PubMed.
- A. Jordan, R. Scholz, P. Wust, H. Fähling and R. Felix, J. Magn. Magn. Mater., 1999, 201, 413–419 CrossRef CAS.
- A. Jordan, R. Scholz, K. Maier-Hauff, M. Johannsen, P. Wust, J. Nadobny, H. Schirra, H. Schmidt, S. Deger, S. Loening, W. Lanksch and R. Felix, Proc. Third Int. Conf. Sci. Clin. Appl. Magn. Carr., 2001, vol. 225, pp. 118–126 Search PubMed.
- W. J. Atkinson, I. A. Brezovich and D. P. Chakraborty, IEEE Trans. Biomed. Eng., 1984, BME-31, 70–75 CrossRef PubMed.
- R. Hergt and S. Dutz, Proc. Sixth Int. Conf. Sci. Clin. Appl. Magn. CarriersSCAMC-06, 2007, vol. 311, pp. 187–192 Search PubMed.
- MagForce AG, 2017.
- J. Carrey, B. Mehdaoui and M. Respaud, J. Appl. Phys., 2011, 109, 83921 CrossRef.
- R. E. Rosensweig, J. Magn. Magn. Mater., 2002, 252, 370–374 CrossRef CAS.
- J.-P. Jolivet, C. Chaneac and E. Tronc, Chem. Commun., 2004, 481–483 CAS.
- S. Laurent, D. Forge, M. Port, A. Roch, C. Robic, L. Vander Elst and R. N. Muller, Chem. Rev., 2008, 108, 2064–2110 CrossRef CAS PubMed.
- M. Hofmann-Amtenbrink, D. W. Grainger and H. Hofmann, Nanomedicine: Nanotechnology, Biology and Medicine, 2015, 11, 1689–1694 CrossRef CAS PubMed.
- E. Alphandéry, S. Faure, O. Seksek, F. Guyot and I. Chebbi, ACS Nano, 2011, 5, 6279–6296 CrossRef PubMed.
- P. Guardia, R. Di Corato, L. Lartigue, C. Wilhelm, A. Espinosa, M. Garcia-Hernandez, F. Gazeau, L. Manna and T. Pellegrino, ACS Nano, 2012, 6, 3080–3091 CrossRef CAS PubMed.
- C. Blanco-Andujar, D. Ortega, P. Southern, Q. A. Pankhurst and N. T. K. Thanh, Nanoscale, 2015, 7, 1768–1775 RSC.
- E. Garaio, J. M. Collantes, J. A. Garcia, F. Plazaola, S. Mornet, F. Couillaud and O. Sandre, J. Magn. Magn. Mater., 2014, 368, 432–437 CrossRef CAS.
- S. Gyergyek, D. Makovec, M. Jagodič, M. Drofenik, K. Schenk, O. Jordan, J. Kovač, G. Dražič and H. Hofmann, J. Alloys Compd., 2017, 694, 261–271 CrossRef CAS.
- M. Chastellain, A. Petri and H. Hofmann, J. Colloid Interface Sci., 2004, 278, 353–360 CrossRef CAS PubMed.
- A. Petri-Fink, M. Chastellain, L. Juillerat-Jeanneret, A. Ferrari and H. Hofmann, Biomaterials, 2005, 26, 2685–2694 CrossRef CAS PubMed.
- D. Bonvin, H. Hofmann and M. M. Ebersold, J. Nanopart. Res., 2016, 18, 376 CrossRef.
- T. Sugimoto and E. Matijević, J. Colloid Interface Sci., 1980, 74, 227–243 CrossRef CAS.
- G. Ning and R. L. Flemming, J. Appl. Crystallogr., 2005, 38, 757–759 CrossRef CAS.
- V. Petříček, M. Dušek and L. Palatinus, Z. Kristallog. – Cryst. Mater., 2014, 229, 345–352 Search PubMed.
- W. Baaziz, B. P. Pichon, S. Fleutot, Y. Liu, C. Lefevre, J.-M. Greneche, M. Toumi, T. Mhiri and S. Begin-Colin, J. Phys. Chem. C, 2014, 118, 3795–3810 CAS.
- T. J. Daou, J. M. Grenèche, G. Pourroy, S. Buathong, A. Derory, C. Ulhaq-Bouillet, B. Donnio, D. Guillon and S. Begin-Colin, Chem. Mater., 2008, 20, 5869–5875 CrossRef CAS.
- A. P. Grosvenor, B. A. Kobe, M. C. Biesinger and N. S. McIntyre, Surf. Interface Anal., 2004, 36, 1564–1574 CrossRef CAS.
- S. Kundu and M. Jayachandran, J. Nanopart. Res., 2013, 15, 1543 CrossRef.
- S. Kundu, M. D. Mukadam, S. M. Yusuf and M. Jayachandran, CrystEngComm, 2012, 15, 482–497 RSC.
- X. He, X. Song, W. Qiao, Z. Li, X. Zhang, S. Yan, W. Zhong and Y. Du, J. Phys. Chem. C, 2015, 119, 9550–9559 CAS.
- P. B. Braun, Nature, 1952, 170, 1123 CrossRef CAS.
- G. W. Van Oosterhout and C. J. M. Rooijmans, Nature, 1958, 181, 44 CrossRef CAS.
- R. Grau-Crespo, A. Y. Al-Baitai, I. Saadoune and N. H. D. Leeuw, J. Phys.: Condens. Matter, 2010, 22, 255401 CrossRef PubMed.
- T. J. Bastow, A. Trinchi, M. R. Hill, R. Harris and T. H. Muster, J. Magn. Magn. Mater., 2009, 321, 2677–2681 CrossRef CAS.
- C. J. Goss, Phys. Chem. Miner., 1988, 16, 164–171 CrossRef CAS.
- A. Millan, A. Urtizberea, N. J. O. Silva, F. Palacio, V. S. Amaral, E. Snoeck and V. Serin, J. Magn. Magn. Mater., 2007, 312, L5–L9 CrossRef CAS.
- T. Sato, T. Iijima, M. Seki and N. Inagaki, J. Magn. Magn. Mater., 1987, 65, 252–256 CrossRef CAS.
- M. P. Morales, S. Veintemillas-Verdaguer, M. I. Montero, C. J. Serna, A. Roig, L. Casas, B. Martínez and F. Sandiumenge, Chem. Mater., 1999, 11, 3058–3064 CrossRef CAS.
- D. Jiles, Introduction to Magnetism and Magnetic Materials, Third Edition, CRC Press, Taylor & Francis Group, 2015 Search PubMed.
- B. H. Kim, N. Lee, H. Kim, K. An, Y. I. Park, Y. Choi, K. Shin, Y. Lee, S. G. Kwon, H. B. Na, J.-G. Park, T.-Y. Ahn, Y.-W. Kim, W. K. Moon, S. H. Choi and T. Hyeon, J. Am. Chem. Soc., 2011, 133, 12624–12631 CrossRef CAS PubMed.
- K. Hiroi, K. Komatsu and T. Sato, Phys. Rev. B: Condens. Matter Mater. Phys., 2011, 83, 224423 CrossRef.
- C. P. Bean and J. D. Livingston, J. Appl. Phys., 1959, 30, S120–S129 CrossRef.
- D. E. Madsen, M. F. Hansen and S. Mørup, J. Phys.: Condens. Matter, 2008, 20, 345209 CrossRef.
- M. Chastellain, A. Petri and H. Hofmann, J. Colloid Interface Sci., 2004, 278(2), 353–360 CrossRef CAS PubMed.
- M. Chastellain, A. Petri, A. Gupta, K. v. Rao and H. Hofmann, Adv. Eng. Mater., 2004, 6, 235–241 CrossRef CAS.
- T. Hyeon, S. S. Lee, J. Park, Y. Chung and H. B. Na, J. Am. Chem. Soc., 2001, 123, 12798–12801 CrossRef CAS PubMed.
- S. Mørup and E. Tronc, Phys. Rev. Lett., 1994, 72, 3278–3281 CrossRef PubMed.
- F. E. Luborsky and T. O. Paine, J. Appl. Phys., 1960, 31, S68–S70 CrossRef.
- D. H. Han, J. P. Wang and H. L. Luo, J. Magn. Magn. Mater., 1994, 136, 176–182 CrossRef CAS.
- V. Skumryev, H. J. Blythe, J. Cullen and J. M. D. Coey, J. Magn. Magn. Mater., 1999, 196–197, 515–517 CrossRef CAS.
- D. Parker, V. Dupuis, F. Ladieu, J.-P. Bouchaud, E. Dubois, R. Perzynski and E. Vincent, Phys. Rev. B: Condens. Matter Mater. Phys., 2008, 77, 104428 CrossRef.
- S. Nakamae, Y. Tahri, C. Thibierge, D. L'Hôte, E. Vincent, V. Dupuis, E. Dubois and R. Perzynski, J. Appl. Phys., 2009, 105, 07E318 CrossRef.
- J. A. De Toro, S. S. Lee, D. Salazar, J. L. Cheong, P. S. Normile, P. Muñiz, J. M. Riveiro, M. Hillenkamp, F. Tournus, A. Tamion and P. Nordblad, Appl. Phys. Lett., 2013, 102, 183104 CrossRef.
- M. J. Benitez, D. Mishra, P. Szary, G. A. B. Confalonieri, M. Feyen, A. H. Lu, L. Agudo, G. Eggeler, O. Petracic and H. Zabel, J. Phys.: Condens. Matter, 2011, 23, 126003 CrossRef CAS PubMed.
- P. Nordblad, Phys. Scr., 2013, 88, 58301 CrossRef.
- G. F. Goya, T. S. Berquó, F. C. Fonseca and M. P. Morales, J. Appl. Phys., 2003, 94, 3520–3528 CrossRef CAS.
- L. Lartigue, C. Innocenti, T. Kalaivani, A. Awwad, M. del M. Sanchez Duque, Y. Guari, J. Larionova, C. Guérin, J.-L. G. Montero, V. Barragan-Montero, P. Arosio, A. Lascialfari, D. Gatteschi and C. Sangregorio, J. Am. Chem. Soc., 2011, 133, 10459–10472 CrossRef CAS PubMed.
- F. Bødker, S. Mørup and S. Linderoth, Phys. Rev. Lett., 1994, 72, 282–285 CrossRef PubMed.
- C. J. Serna and M. P. Morales, in Surface and Colloid Science, ed. E. Matijević and M. Borkovec, Springer US, 2004, pp. 27–81 Search PubMed.
- S. Gyergyek, M. Drofenik and D. Makovec, Acta Chim. Slov., 2014, 61, 488–496 CAS.
- COST Multifunct. Nanoparticles Magn. Hyperth. Indirect Radiat. Ther. RADIOMAG, 2017 Search PubMed.
- B. Sanz, M. P. Calatayud, N. Cassinelli, M. R. Ibarra and G. F. Goya, Eur. J. Inorg. Chem., 2015, 2015, 4524–4531 CrossRef CAS.
- P. de la Presa, Y. Luengo, M. Multigner, R. Costo, M. P. Morales, G. Rivero and A. Hernando, J. Phys. Chem. C, 2012, 116, 25602–25610 CAS.
- M. Kallumadil, M. Tada, T. Nakagawa, M. Abe, P. Southern and Q. A. Pankhurst, Proc. Seventh Int. Conf. Sci. Clin. Appl. Magn. Carr., 2009, vol. 321, pp. 1509–1513 Search PubMed.
- NANoREG, 2017 Search PubMed.
- NanoScreen, 2017 Search PubMed.
- K. Haneda and A. H. Morrish, Solid State Commun., 1977, 22, 779–782 CrossRef CAS.
- K. M. Spiers, J. D. Cashion and K. A. Gross, Key Eng. Mater., 2004, 254–256, 213–216 CrossRef CAS.
Footnotes |
| † Electronic supplementary information (ESI) available. See DOI: 10.1039/c7ra00687j |
| ‡ Current affiliation of Alla Arakcheeva is: Laboratory of Physics of Complex Matter, Ecole Polytechnique Fédérale de Lausanne (EPFL), CH-1015 Lausanne, Switzerland. |
| This journal is © The Royal Society of Chemistry 2017 |