 Open Access Article
Creative Commons Attribution 3.0 Unported Licence
Visual detection of glucose using triangular silver nanoplates and gold nanoparticles†
Tuanjie Cai,
Yan Gao,
Jilin Yan,
Ying Wu and
Junwei Di *
*
College of Chemistry, Chemical Engineering and Material Science, Soochow University, Suzhou, 215123, PR China. E-mail: djw@suda.edu.cn
First published on 5th June 2017
Abstract
A sensitive spectrophotometric detection of glucose based on triangular silver nanoplates (Ag TNPs) coupled with gold nanoparticles (Au NPs) was carried out. Relying on the glucose oxidase (GOD) mimetics of small Au NPs, glucose was catalytically oxidized in the presence of oxygen. The product of H2O2 then induced the etching of Ag TNPs from triangular to round, which led to blue-shifting of the peak wavelength and a decrease of the absorbance. The color changes of the solution could be used for visual detection (from dark blue to light pink) of glucose by the naked eye. The blue-shift of the peak wavelength was linear proportional to the glucose concentration in the range from 0.5 to 20 μM with a detection limit of 0.3 μM. The high sensitivity of the method is due to the highly reactive tips and strong tip sharpness of Ag TNPs. Moreover, the effect of L-cysteine (Cys) assembled on metal nanomaterials was investigated in the system.
1. Introduction
Glucose, a metabolic intermediate and the source of energy for living cells, has an important position in biology.1–3 An appropriate amount of glucose is conducive to strengthening memory, stimulating calcium absorption and increasing communication between cells.4 However, excessive glucose will increase the concentration of insulin, leading to obesity and diabetes. According to International Diabetes Federation, 415 million adults had diabetes by 2015, and by 2040 this will rise to 642 million.5 Hence, glucose detection is very important for these global patients.Over the past few decades, there is an increasing attention for developing the glucose detection methods. Many analytic methods, including spectrophotometry,6–8 electrochemistry,9–12 fluorometry,13,14 chemiluminescence,15,16 and surface enhanced Raman spectroscopy17 were proposed. Compared with the above analytical techniques, the colorimetric methods are simple, low-cost and practical. Moreover, the detection of glucose can also be read out by the naked eyes without the requirement of any sophisticated instrumentation or expert skills. The conventional colorimetric detection of glucose is based on enzymes and chromogenic agents.18 Glucose was oxidized by oxygen in the presence of glucose oxidase (GOD) to produce hydrogen peroxide (H2O2), which could cause the oxidation of chromogenic agents to generate a colored solution in the presence of peroxidase. However, natural enzymes have critical limitations such as instability for the denaturation in harsh conditions, the difficulties in the procedures for preparation, purification, and storage.19
In recent years, noble metal (especially Au and Ag) nanoparticles have attracted intensive attention in colorimetric detection of glucose. It was demonstrated that the small Au nanoparticles (Au NPs) exhibit a dramatic high activity in the aerobic oxidation of glucose.20,21 Zeng et al. coupled horseradish peroxidase (HRP) with GOD-like Au NPs to simulate the function of the GOD–HRP enzyme pair for colorimetric detection of glucose with organic chromogenic agent.22 On the other hand, the localized surface plasmon resonance (LSPR) band of noble metal nanoparticles is extremely dependent on their size, shape, composition, and the surrounding media.23,24 Ag nanoparticles (Ag NPs) can be etched by H2O2,25 resulting in the change of its LSPR band. Glucose could be detected by coupling Ag8,26,27 or Ag/Au28 nanoparticles with GOD to assemble a catalytical nanoconjugate. By combination of the good catalytic performances and the excellent optical properties of the two metal nanomaterials, an Au NPs–Ag NPs sensor was developed for colorimetric detection of glucose in our previous report.29 Furthermore, triangular silver nanoplates (Ag TNPs) could be etched from triangle to round by H2O2 to cause a blue-shift of their LSPR.30,31 In this work, we coupled triangular silver nanoplates (Ag TNPs) with small Au NPs to develop a plasmonic sensing for glucose. The Ag TNPs have advantages of highly reactive tips and strongly tip sharpness, resulting in large blue-shift of the LSPR due to etching of the angles first. The blue-shift of peak wavelength and the decrease of peak intensity could be used to sensitive detection of glucose. Moreover, we compared the effect of various stabilizers of metal nanoparticles in the catalytic reaction and selectivity.
2. Experimental section
2.1 Chemicals and reagents
Silver nitrates (AgNO3) was purchased from Shanghai Reagent Factory (China). Chloroauric acid (HAuCl4·4H2O), sodium citrate (Na3C6H5O7·2H2O), citric acid (C6H8O7), disodium hydrogen phosphate (Na2HPO4), sodium borohydride (NaBH4), hydrogen peroxide (H2O2), glucose, fructose, L-cysteine (Cys), ascorbic acid (AA), uric acid (DA), paracetamol (PA), polyvinyl pyrrolidone (PVP), bovine serum albumin (BSA), and glycine, were acquired from Sinopharm Chemical Reagent Co., Ltd (China). All chemicals were of analytical grade. All aqueous solutions were prepared using ultrapure water (18.2 MΩ cm) obtained by a Milli-Q system.2.2 Instruments and characterization
An Agilent Cary-60 spectrophotometer was used to record the UV-vis absorption spectra. TEM images and element mapping images were taken using a TecnaiG20 (FEI, U.S.A) transmission electron microscope operated at 185 kV. All TEM samples were prepared by dispersing 6 μL of the stable mixed solution on the surface of the copper mesh.2.3 Preparation of Ag TNPs
The Ag TNPs were synthesized according to the standard procedures with slight modifications.32 Typically, a solution containing 50 mL of 0.1 mM silver nitrate, 3 mL of 30 mM trisodium citrate and 3 mL of 0.02 g mL−1 PVP were vigorously stirred at room temperature, then 0.5 mL of 40 mM sodium borohydride was injected into this mixture, immediately leading to a light-yellow solution. Next, 0.2 mL of 30% H2O2 was rapidly added to the solution, which turned to colorless. After continuous stirring 3 minutes, the reaction was carried out in darkness for one hour. Finally, the prepared solution was added 50 μM of Cys. The blue Ag TNPs solution was stored at 4 °C before use.2.4 Preparation of Au NPs
The Au NPs were synthesized according to the standard NaBH4 reduction procedures with slight modifications. Briefly, 0.5 mL of 10 mM HAuCl4 and 0.5 mL of 10 mM sodium citrate solution were mixed and diluted to 20 mL with water. Then a 0.5 mL of freshly prepared 100 mM NaBH4 solution was added into the solution under stirring at room temperature. The solution color changed immediately from colorless to orange. Approximately one hour later, 0.1 mL of 10 mM Cys was added into the solution to decorate Au NPs. The resulted Au NP solution was stored at 4 °C.2.5 Procedures for glucose sensing
To a series of 5 mL test tubes, 100 μL of Au NPs solution and 100 μL of 0.05 M trisodium citrate–citric acid buffer solution (pH = 6.6) was diluted with 700 μL water saturated with oxygen. The mixed solution was warmed to 35 °C. Then, 100 μL of glucose stand solution or diluted human serum samples were added in the mixed solution for 30 minutes at 35 °C. Next, 1 mL of Ag TNPs solution was added in the mixture and incubated at 35 °C for 30 minutes in the dark. The UV-vis absorption spectra were recorded at the room temperature.3. Results and discussion
3.1 Characterization of Au NPs and Ag TNPs
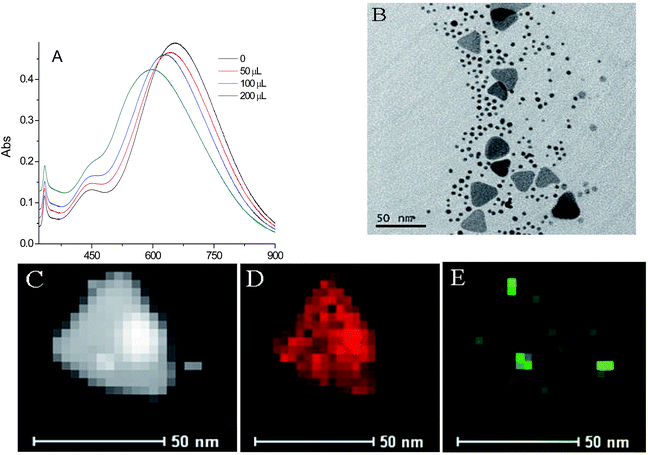
The formation and properties of the Au NPs and Ag TNPs were characterized by UV-vis absorption spectra and TEM images. The Au NPs were fabricated by reducing HAuCl4 with NaBH4, producing an average diameter of ∼4.5 nm nanoparticles with a peak at ∼509 nm in UV-vis absorption spectrum (Fig. S1†). The Ag TNPs were prepared by reducing AgNO3 with NaBH4 and then treatment with H2O2. The UV-vis absorption spectrum (Fig. S2A†) showed three peaks of ∼633, 450, and 335 nm, corresponding to in-planedipole, in-plane quadrupole, and out-of-plane quadrupole resonance, respectively.33 The side length of the Ag TNPs was ∼40 nm (Fig. S2B†) and their thickness was only ∼4 nm (Fig. S2C†), which leading to highly sharp edges/tips.Fig. 1A shows the UV-vis absorption of the Ag TNPs solution mixed with different volumes of Au NPs. It was found that the main absorption peak of Ag TNPs at ∼633 nm was slightly red-shifted in wavelength and decreased in intensity after sequent addition of Au NPs. In order to get further information, TEM images and EDX patterns of mixture of Au NPs–Ag TNPs were investigated. Fig. 1B exhibits that the morphology of Au NPs and Ag TNPs was no marked changes, compared with that of individual Au NPs and Ag TNPs (Fig. S1B and S2B†). The EDX elemental mapping images of Au NPs–Ag TNPs (Fig. 1C–E) show a little of Au element existed on the surface of Ag TNPs, suggesting formation of Au–Ag alloy. This result was consistent with the previous report.34 Considering the catalytic ability of Au NPs and the alloy formation, 100 μL of Au NPs aqueous solution was chosen in the next experimental.
3.2 Colorimetric reactions for detection of glucose
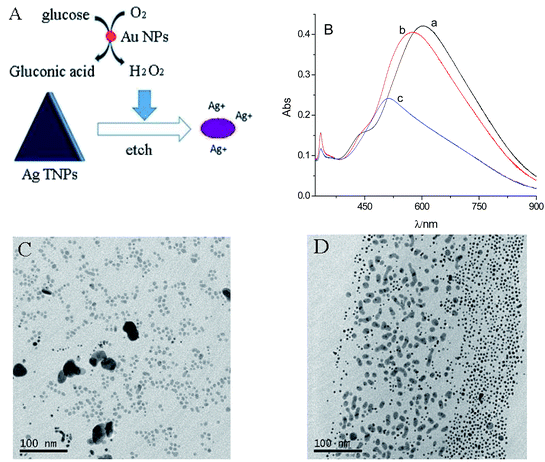
The reaction mechanism is illustrated in Fig. 2A. Small Au NPs catalyze the oxidation of glucose in the presence of oxygen to produce gluconic acid and H2O2, which etches Ag TNPs to result in the color change. It has been known that the localized surface plasmon resonance (LSPR) band of Ag TNPs is highly dependent on the tip sharpness and aspect ratio of nanoplates.35,36 Therefore, the etching of the Ag TNPs can lead to a blue shift of the in-plane LSPR peak (∼630 nm) and a decrease in the absorbance (Fig. 2B). The in-plane quadrupole LSPR band (∼450 nm) of Ag TNPs has gradually disappeared. The TEM images (Fig. 2C and D) confirm that the Ag TNPs change from triangle to round and further decrease the size of particles. Some of the two shapes segregated was observed in Fig. 2D. This may be related to TEM sample preparation and the region of recorded.3.3 Effect of Au NP stabilizers on the catalytic ability
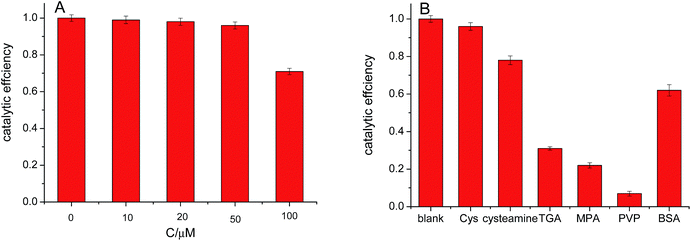
It was reported that citric acid adsorption does not inhibit the catalytic reactivity of Au NPs.37,38 However, organic macromolecules, such as polyvinyl alcohol (PVA), polyethylene glycol (PEG), and protein et al., inhibit the reaction.20,38 In our previous report,29 we found that Cys assembled on the surface of Au NPs not only improved the selectivity in glucose detection but also maintain their catalytic reactivity. Fig. 3A shows the effect of Cys concentration on the catalytic ability of the Au NPs for oxidation of glucose. It was found that the catalytic ability of Au NPs was almost not change as Cys concentration was not over 50 μM. However, the catalytic efficiency decreased to 0.71 when Cys concentration was 0.1 mM. This decrease may be attributed to aggregation of Au NPs in the presence of high Cys concentration. It was confirmed from the UV-vis absorption spectra of Au NPs after addition of different Cys concentration (Fig. S3†). As the Cys concentration was over 50 mM, the LSPR band of Au NPs became broad and red-shift in peak wavelength, indicating the aggregation of Au NPs.39,40 Moreover, we compared the catalytic ability of Au NPs modified with different stabilizers. As can be seen in Fig. 3B, Cys shows the least effect in the catalytic reaction.3.4 Optimization of experimental conditions
In order to achieve the optimum conditions for glucose detection, we studied the influence of some important factors, including the reaction time and temperature. Fig. 4A shows that the blue-shift of the LSPR peak increased as the reaction time increased (the raw spectroscopy data are provided in Fig. S4†). Moreover, the catalytic reaction rate was rapid at high incubation temperatures. The time reached maximum shift of peak wavelength decrease from 50 min at 25 °C to 30 min at 35 °C. The blue-shift wavelength decreased slightly when the incubation time was over 60 min at 35 °C, which may be attributed to the escape of H2O2 at high temperature. Therefore, 35 °C and 30–40 min were chosen in the next experiments.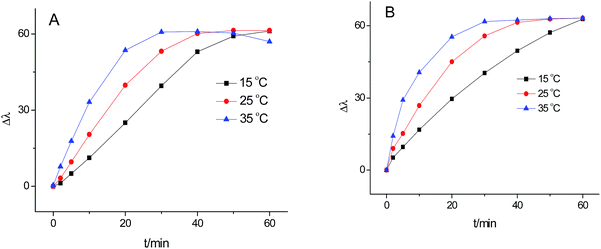 | ||
| Fig. 4 Effect of temperature and time on catalytic oxidation of glucose (A), and effect of temperature and time on the etching of Ag TNPs (B). | ||
The effect of the etching temperature and time on the wavelength shift was illustrated in Fig. 4B (spectra in Fig. S5†). The blue-shift of the peak increased with the increasing time and temperature. The plateau of the peak blue-shift reached in 40 min at 25 °C but 30 min at 35 °C. Thus, 35 °C and 30 min was taken as the etching conditions.
3.5 Analytical performance
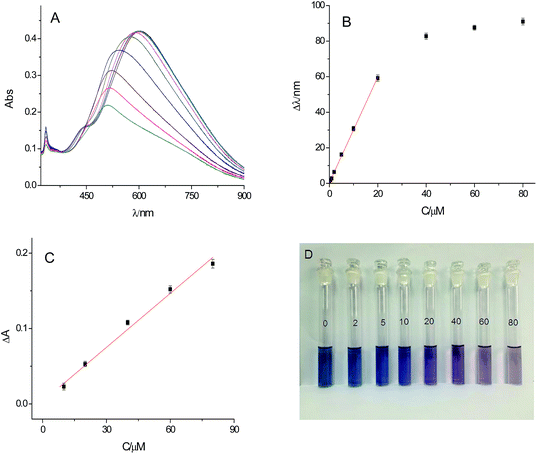
To evaluate the analytical performance of the sensing method for detection of glucose under the optimized conditions, the UV-vis spectra in the presence of different concentration of glucose were recorded. With the increasing of the concentration of glucose, the main LSPR peak of Ag TNPs was gradually blue-shift in wavelength and decreased in absorbance. The Δλ (difference of main peak between control solution and after addition of glucose) showed a linear relationship with glucose concentrations with the range from 0.5 μM to 20 μM (Δλ = 2.966 × C (μM) + 0.425, R2 = 0.999) with the detection limit of 0.3 μM (3σ/S) (Fig. 5B). In addition, Fig. 5C shows that the calibration curve of the peak absorbance was obtained in the range of 10–80 μM (ΔA = 0.00239 × C (μM) + 0.00344, R2 = 0.990). The higher sensitivity of detection was obtained in measurement of peak wavelength shift. Moreover, as exhibited in Fig. 5D, the color of solution was also marked changes from dark blue to purple and light pink with increasing concentration of glucose. Thus, the colorimetric method presents the potential for detection of blood glucose with the naked eye. Compared with some metal nanomaterials based methods (Table 1), this proposed colorimetric method is high sensitive.| System | Liner range (mM) | LOD (μM) | Reference | |
|---|---|---|---|---|
| Colorimetry | Cu–Ag/rGO | 0.001–0.03 | 3.82 | 41 |
| Chemiluminescence | Dendritic Au–Ag | 0.001–1 | 0.4 | 42 |
| Colorimetry | GOx/AgNPrs | 0.0002–0.1 | 0.2 | 8 |
| Colorimetry | GOx/AgNPs | 0.278–4.44 | 127 | 26 |
| Colorimetry | GOx/AgNPs–GQDs | 0.0005–0.4 | 0.17 | 27 |
| Colorimetry | GOx/Au@AgNPs | 0.0005–0.4 | 0.24 | 43 |
| Colorimetry | GOx/TMB–CuSNPs | 0.002–1.8 | 0.12 | 44 |
| Fluorescence | GOx/AgNPs–perylene | 0.0025–0.2 | 2.5 | 45 |
| Colorimetry | AuNPs/AgNPs | 0.005–0.07 | 3 | 29 |
| Colorimetry | AuNPs/AgTNPs | 0.0005–0.02 | 0.3 | This work |
3.6 Selectivity and interferences
Selectivity is a very important factor in practical sensing. We first examine some sugars, such as glucose, sucrose, fructose, lactose, and maltose. The response of lactose and maltose was similar to that of glucose, but sucrose and fructose showed no marketable change (Fig. 6A). This suggested that the Au NPs (a mimic GOD enzyme) is an oxidase with a broader substrate range than GOD enzyme.Under the optimum experimental conditions, the possible interferences of inorganic ions and organic molecules for the detection of glucose (10 μM) were examined. The same concentration of Na+, K+, Zn2+, Ca2+, Pb2+, glutamic acid (Glu), aspartic acid (Asp), arginine (Arg), glycine (Gly), tryptophan (Trp), AA, UA, PA, DA, and BSA were not interfering with the detection of glucose (Fig. 6). In the absence of Cys, proteins may be adsorbed on the surface of Au NPs,46 inhibiting the catalytic reaction of Au NPs (Fig. 3B). The Cys assembled on the surface of Au NPs can inhibit the adsorption of protein. In addition, the detection of glucose was interfered seriously with UA and AA in the absence of Cys. This was attributed to the adsorption of UA and AA on the surface of Ag TNPs which resulted in inhibition of them from etching.8 It was confirmed by the fact that the interference of UA could be avoided after addition of Zn2+ or Fe2+ in the system. In this work we demonstrated that the interferences of UA and AA can be also eliminated in the presence of Cys, which assembled on the surface of Ag TNPs.
3.7 Sample analysis
Herein, we tested the concentration of glucose in human serum samples, obtained from Soochow Hospital. After diluting the serum 1000 times, the standard addition method was used to detect the actual sample. Table 2 shows the analytical results obtained from this method. The good recoveries, between 94.8% and 104.2%, indicated that this glucose sensing was effectively applied in the detection blood glucose.| Sample | Detected/μM | Added/μM | Found/μM | Recovery/% | Our method/mM | Hospital method/mM |
|---|---|---|---|---|---|---|
| 1 | 5.24 ± 0.17 | 5.00 | 10.45 | 104.2 | 5.24 | 5.24 |
| 2 | 4.18 ± 0.13 | 5.00 | 8.92 | 94.8 | 4.18 | 4.08 |
| 3 | 5.12 ± 0.12 | 5.00 | 10.00 | 97.6 | 5.12 | 5.00 |
4. Conclusions
We developed a sensitive method for the detection of glucose in human serums using integration of Au NPs and Ag TNPs. The small Au NPs catalytically oxidized glucose in presence of oxygen to produce H2O2, which induced etching of Ag TNPs to result in color change. The plasmonic peak of Ag TNPs was proportionally blue-shifted with glucose concentration in the range 0.5–20 μM. Furthermore, the color of the solution was observable from blue to light pink in the range 2–80 μM. The proposed method was simple, sensitive, cost-effective and avoid any enzymes and organic chromogenic agents. The method enriches the application of nanotechnology and provides an insight into mimic enzyme and biosensing.Acknowledgements
This work was financially supported by the National Natural Science Foundation of China (No. 21475092) and the Priority Academic Program Development of Jiangsu Higher Education Institutions.Notes and references
- S. P. Nichols, A. Koh, W. L. Storm, J. H. Shin and M. H. Schoenfisch, Chem. Rev., 2013, 113, 2528–2549 CrossRef CAS PubMed.
- C. Chen, Q. Xie, D. Yang, H. Xiao, Y. Fu, Y. Tan and S. Yao, RSC Adv., 2013, 3, 4473 RSC.
- A. Senthamizhan, B. Balusamy and T. Uyar, Anal. Bioanal. Chem., 2016, 408, 1285–1306 CrossRef CAS PubMed.
- Q. Wu, L. Wang, H. Yu, J. Wang and Z. Chen, Chem. Rev., 2011, 111, 7855–7875 CrossRef CAS PubMed.
- M. I. Maiorino, G. Bellastella, M. Caputo, F. Castaldo, M. R. Improta, D. Giugliano and K. Esposito, J. Diabetes. Complications, 2016, 30, 1519–1524 CrossRef PubMed.
- X. Zhang, X. Bi, W. Di and W. Qin, Sens. Actuators, B, 2016, 231, 714–722 CrossRef CAS.
- J. Mu, Y. He and Y. Wang, Talanta, 2016, 148, 22–28 CrossRef CAS PubMed.
- Y. Xia, J. Ye, K. Tan, J. Wang and G. Yang, Anal. Chem., 2013, 85, 6241–6247 CrossRef CAS PubMed.
- S. Dong, Q. Yang, L. Peng, Y. Fang and T. Huang, Sens. Actuators, B, 2016, 232, 375–382 CrossRef CAS.
- Q. Shi, G. Diao and S. Mu, Electrochim. Acta, 2014, 133, 335–346 CrossRef CAS.
- J. Song, L. Xu, R. Xing, W. Qin, Q. Dai and H. Song, Sens. Actuators, B, 2013, 182, 675–681 CrossRef CAS.
- H. Li, C. Y. Guo and C. L. Xu, Biosens. Bioelectron., 2015, 63, 339–346 CrossRef CAS PubMed.
- S. Zhou, X. Min, H. Dou, K. Sun, C. Y. Chen, C. T. Chen, Z. Zhang, Y. Jin and Z. Shen, Chem. Commun., 2013, 49, 9473–9475 RSC.
- J. C. Pickup, F. Hussain, N. D. Evans, O. J. Rolinski and D. J. Birch, Biosens. Bioelectron., 2005, 20, 2555–2565 CrossRef CAS PubMed.
- M. J. Chaichi and S. O. Alijanpour, J. Photochem. Photobiol., B, 2014, 140, 41–48 CrossRef CAS PubMed.
- M. Hao, N. Liu and Z. Ma, Analyst, 2013, 138, 4393–4397 RSC.
- V. K. Gupta, N. Atar, M. L. Yola, M. Eryilmaz, H. Torul, U. Tamer, I. H. Boyaci and Z. Ustundag, J. Colloid Interface Sci., 2013, 406, 231–237 CrossRef CAS PubMed.
- M. S. Steiner, A. Duerkop and O. S. Wolfbeis, Chem. Soc. Rev., 2011, 40, 4805–4839 RSC.
- J. M. Harris, C. Reyes and G. P. Lopez, J. Diabetes Sci. Technol., 2013, 7, 1030–1038 CrossRef PubMed.
- M. Comotti, C. Della Pina, R. Matarrese and M. Rossi, Angew. Chem., 2004, 43, 5812–5815 CrossRef CAS PubMed.
- P. Beltrame, M. Comotti, C. Della Pina and M. Rossi, Appl. Catal., A, 2006, 297, 1–7 CrossRef CAS.
- D. Zeng, W. Luo, J. Li, H. Liu, H. Ma, Q. Huang and C. Fan, Analyst, 2012, 137, 4435–4439 RSC.
- T. K. Sau and A. L. Rogach, Adv. Mater., 2010, 22, 1781–1804 CrossRef CAS PubMed.
- L. M. Liz-Marzán, Langmuir, 2006, 22, 32–41 CrossRef PubMed.
- Q. Zhang, C. M. Cobley, J. Zeng, L.-P. Wen, J. Chen and Y. Xia, J. Phys. Chem. C, 2010, 114, 6396–6400 CAS.
- J. Tashkhourian, M. R. Hormozi-Nezhad, J. Khodaveisi and R. Dashti, Sens. Actuators, B, 2011, 158, 185–189 CrossRef CAS.
- S. Chen, X. Hai, X. W. Chen and J. H. Wang, Anal. Chem., 2014, 86, 6689–6694 CrossRef CAS PubMed.
- H. He, X. Xu, H. Wu and Y. Jin, Adv. Mater., 2012, 24, 1736–1740 CrossRef CAS PubMed.
- Y. Gao, Y. Wu and J. Di, Spectrochim. Acta, Part A, 2016, 173, 207–212 CrossRef PubMed.
- Z. Chen, C. Zhang, Q. Wu, K. Li and L. Tan, Sens. Actuators, B, 2015, 220, 314–317 CrossRef CAS.
- X. Yang, Y. Yu and Z. Gao, ACS Nano, 2014, 8, 4902–4907 CrossRef CAS PubMed.
- Q. Zhang, N. Li, J. Goebl, Z. Lu and Y. Yin, J. Am. Chem. Soc., 2011, 133, 18931–18939 CrossRef CAS PubMed.
- R. Jin, Y. Cao, C. A. Mirkin, K. L. Kelly, G. C. Schatz and J. G. Zheng, Science, 2001, 294, 1901–1903 CrossRef CAS PubMed.
- T. Shibata, B. A. Bunker, Z. Zhang, D. Meisel and J. D. Gezelter, J. Am. Chem. Soc., 2002, 124, 11989–11996 CrossRef CAS PubMed.
- B. Tang, S. Xu, J. An, B. Zhao and W. Xu, J. Phys. Chem. C, 2009, 113, 7025–7030 CAS.
- X. Y. Hou, S. Chen, J. Tang and Y. F. Long, Spectrochim. Acta, Part A, 2014, 125, 285–289 CrossRef CAS PubMed.
- W. Luo, C. Zhu, S. Su, D. Li, Y. He, Q. Huang and C. Fan, ACS Nano, 2010, 4, 7451–7458 CrossRef CAS PubMed.
- N. J. Lang, B. Liu and J. Liu, J. Colloid Interface Sci., 2014, 428, 78–83 CrossRef CAS PubMed.
- A. Mocanu, I. Cernica, G. Tomoaia, L.-D. Bobos, O. Horovitz and M. Tomoaia-Cotisel, Colloids Surf., A, 2009, 338, 93–101 CrossRef CAS.
- P. Řezanka, H. Řezanková, P. Matějka and V. Král, Colloids Surf., A, 2010, 364, 94–98 CrossRef.
- G. Darabdhara, B. Sharma, M. R. Das, R. Boukherroub and S. Szunerits, Sens. Actuators, B, 2017, 238, 842–851 CrossRef CAS.
- H. Yu and Y. He, Sens. Actuators, B, 2015, 209, 877–882 CrossRef CAS.
- X. Zhang, M. Wei, B. Lv, Y. Liu, X. Liu and W. Wei, RSC Adv., 2016, 6, 35001–35007 RSC.
- A. K. Dutta, S. Das, S. Samanta, P. K. Samanta, B. Adhikary and P. Biswas, Talanta, 2013, 107, 361–367 CrossRef CAS PubMed.
- J. Li, Y. Li, S. A. Shahzad, J. Chen, Y. Chen, Y. Wang, M. Yang and C. Yu, Chem. Commun., 2015, 51, 6354–6356 RSC.
- M. S. Bakshi, H. Kaur, P. Khullar, T. S. Banipal, G. Kaur and N. Singh, J. Phys. Chem. C, 2011, 115, 2982–2992 CAS.
Footnote |
| † Electronic supplementary information (ESI) available. See DOI: 10.1039/c7ra00593h |
| This journal is © The Royal Society of Chemistry 2017 |

