 Open Access Article
Creative Commons Attribution 3.0 Unported Licence
Ozonolysis of neem oil: preparation and characterization of potent antibacterial agents against multidrug resistant bacterial strains†
Paola de Oliveiraa,
Nathália de Almeidab,
Martin Conda-Sheridan b,
Rafael do Prado Apparecidoa,
Ana Camila Michelettia,
Nadia Cristina Carvalhoc,
Edson dos Anjos dos Santosd,
Maria Rita Marquesd,
Eduardo de Arrudae,
Glaucia Braz Alcantaraa,
Lincoln Carlos de Oliveiraa,
Dênis de Limaa and
Adilson Beatriz
 *a
*a
aInstituto de Química – INQUI, Universidade Federal do Mato Grosso do Sul, Cidade Universitária, Av. Senador Filinto Muller, no. 1555, 79074-460, Campo Grande, MS, Brazil. E-mail: adilson.beatriz@ufms.br; Fax: +55 67 3345 3552; Tel: +55 67 3345 3676
bUniversity of Nebraska Medical Center – UNMC, Department of Pharmaceutical Sciences, 4040 Emile St., 68198-6125, Omaha, NE, USA
cNúcleo do Hospital Universitário da Universidade Federal do Mato Grosso do Sul NHU/UFMS, Cidade Universitária, S/N, Av. Senador Felinto Muller, 79.002-970, Campo Grande, MS, Brazil
dCentro de Ciências Biológicas e da Saúde, Universidade Federal de Mato Grosso do Sul, Cidade Universitária, s/n – Caixa Postal 549, CEP 79070-900, Campo Grande, MS, Brazil
eFaculdade de Ciência Exatas e Tecnologia (FACET), Universidade Federal da Grande Dourados (UFGD), Itahum, km 12 – Cidade Universitária, 79804-970, Dourados, MS, Brazil
First published on 10th July 2017
Abstract
Neem, Azadirachta indica A. Juss, is endowed with relevant biological properties and its oil contains unsaturated fatty acids that are susceptible to structural modification by oxidative processes such as ozonolysis to form peroxides. Therefore, the aim of this work was the synthesis, physicochemical characterization, study of thermal behavior, and evaluation of the antimicrobial potential of neem ozonated oils. The ozonolysis reaction was performed over different periods of time, in the presence or absence of water at an ozone concentration of 63 mg L−1 O3/O2. The samples were characterized by 1H and 13C NMR spectroscopy, acid and iodine values and, DSC and TG/DTG thermal analyses. Additionally, quantitative 1H NMR spectroscopy was a very successful and useful tool to determine the unsaturation degree of samples. The products showed excellent broad-spectrum antimicrobial activity in comparison to other ozonated oils reported in the literature, with an MIC of <0.5 mg mL−1 for standard E. faecalis and clinical vancomycin resistant E. faecium, 5.0 mg mL−1 for clinical multiresistant K. pneumoniae (KPC), 2 mg mL−1 for standard S. aureus, and 3 mg mL−1 for methicillin-resistant S. aureus (MRSA). This is the first report on the antimicrobial action of neem oil after the ozonation process. The ozonated neem oils were investigated for their cytotoxicity against two normal human cell lines (HaCaT and HCEC). And the results show the products possess low toxicity. Our studies suggest the compounds can find potential application in the treatment of chronic wounds and skin infections.
1. Introduction
Ozonated oils are of great interest in pharmaceutical and cosmetic areas due to their antibacterial, fungicide and antiprotozoal properties.1,2 The ozonization of vegetal oils under diverse conditions have been studied for the treatment of skin infections such as dermatitis, acne, ulcers, wounds, and burns, the treatment of asthma, as a laxative, the treatment of intestinal infections, and gastroduodenal ulcers, and healing infections caused by Giardia lamblia.3,4The pharmacological activity of ozonated oils is dependent on the level of ozonation and the composition of the oil.5 Thus, it is relevant to carry out ozonolysis of different types of oils in order to find a product of a broad antimicrobial spectrum, and with improved efficiency to heal chronic wounds. Plenty of studies on neem oil are reported in the literature, though we have not found any concerning ozonolysis. Neem, Azadirachta indica A. Juss, a species belonging to the Meliaceae family, has been a target of research in medicinal and agricultural fields owing to the presence of important bioactive terpenoid microcomponents.6–8 There are over one hundred bioactive compounds such as azadirachtin, salannin, meliantriol, nimbin and nimbidi, desacetylnimbin, azadiradione, azadirone, nimbolin, nimbinene, and nimbolide, showing ovicidal, antifungal, antibacterial, immunostimulant and acaricidal properties; besides polysaccharides and phenolic compounds.9–11
According to Pinto and Lanças (2010)12 the predominant composition of neem oil fatty acids is of oleic acid (41.09%), stearic (20.61%), palmitic (20.18%) and linoleic (14.08%), being the unsaturated sensitive to structural chemical transformation by usual oxidative processes like the ozonolysis.13,14
Ozonolysis occurs by the addition of ozone (1) to unsaturated fatty acids (2) to form the malozonide (3), which is unstable and decomposes to zwitterion (4) and an aldehyde (5). Compounds 4 and 5 react with each other by cycloaddition to render the ozonides (6) and aldehydes.3,8,15–17 In presence of protic solvents it is obtained alkoxy hydroperoxides (7) and/or peroxy hemi-acetals (8)13 (Scheme 1) that are responsible for the therapeutic effects of ozonated oils.18
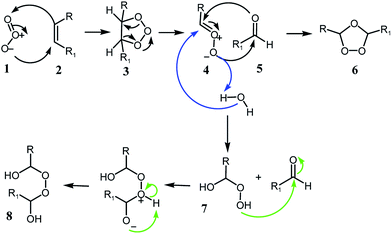 | ||
| Scheme 1 Criegee mechanism of ozonolysis (1975).15 | ||
According to Bocci (2005; 2006)19,20 the healing effect of ozonated oils is likely to arise by the formation of hydrogen peroxide and other products from lipid oxidation when the ozonides interact with wound exudate. These compounds have sterilization effect, and increase oxidation level leading to speed wound healing.20
Therefore, the purpose of this work was to synthesize ozonides from neem oil and disclose their potential antimicrobial properties against diverse strains of bacteria (standard and clinical) and investigate their physical, chemical, and thermal properties.
2. Results and discussion
Fatty acids composition of neem oil
Using gas chromatography, the profile of fatty acid composition was disclosed as depicted in Table 1. The major components are oleic (41.50%), linoleic (19.79%), stearic (18.11%) and palmitic acids (17.14%). These results are in accordance with the similar to previous studies12,21 showing only small deviations, which can be related to variability of soil, climate, plant variety, and extraction method.12,22| Fatty acid composition | (% m/m) | |
|---|---|---|
| C14:0 | Myristic | 0.05 |
| C15:0 | Pentadecanoic | 0.03 |
| C16:0 | Palmitic | 17.14 |
| C16:1 | Palmitoleic | 0.12 |
| C17:0 | Margaric (heptadecanoic) | 0.17 |
| C17:1 | cis-10-Heptadecenoic | 0.05 |
| C18:0 | Stearic | 18.11 |
| C18:1 trans | Elaidic | 0.11 |
| C18:1 | Oleic | 41.50 |
| C18:2 trans | t-Linoleic | 0.10 |
| C18:2 | Linoleic | 19.79 |
| C18:3 | Linolenic | 0.71 |
| C20:0 | Arachidic | 1.50 |
| C20:1 | Eicosenoic | 0.13 |
| C22:0 | Behenic | 0.30 |
| C24:0 | Lignoceric | 0.20 |
Infrared (IR) and 1H, 13C NMR spectroscopic characterization
As expected in the IR spectrum,23 during the reaction a decrease of the C![[double bond, length as m-dash]](https://www.rsc.org/images/entities/char_e001.gif) C stretching absorption bands at 1650 cm−1 and C–H sp2 at 3009 cm−1 present in the pure neem oil, was observed. The triglyceride ester band at 1746 cm−1 was verified before and after ozonolysis proving that the bound was unaffected by the reaction (Fig. 1). The spectrum of 2 hours ozonated sample (ON-02, Fig. 2S, see ESI†), showed a new band at 1105 cm−1 related to C–O stretching assigned to the formation of ozonides. However, bands relative to double bonds disappeared only after 12 hours of reaction (ON-12) (Fig. 1). Samples ozonated for 2 hours in presence of water (OAN-02) showed additional bands at 3464 cm−1 (O–H stretching) ascribed to water trace (Fig. 1). Those ozonated for 6 hours in water (OAN-06, Fig. 10S, ESI†) show no unsaturation, and the broad band verified at 3482 cm−1 was attributed to O–H stretching of α-hydroxy-hydroperoxides and carboxylic acids. Samples ozonated for 10 (OAN-10, see Fig. 12S, ESI†) and 12 hours (Fig. 1d) in water, displayed new band at 1710 cm−1 assigned to the carbonyl of saturated acids formed by oxidation of aldehydes and decomposition of ozonides by the continuous ozonolysis process.13
C stretching absorption bands at 1650 cm−1 and C–H sp2 at 3009 cm−1 present in the pure neem oil, was observed. The triglyceride ester band at 1746 cm−1 was verified before and after ozonolysis proving that the bound was unaffected by the reaction (Fig. 1). The spectrum of 2 hours ozonated sample (ON-02, Fig. 2S, see ESI†), showed a new band at 1105 cm−1 related to C–O stretching assigned to the formation of ozonides. However, bands relative to double bonds disappeared only after 12 hours of reaction (ON-12) (Fig. 1). Samples ozonated for 2 hours in presence of water (OAN-02) showed additional bands at 3464 cm−1 (O–H stretching) ascribed to water trace (Fig. 1). Those ozonated for 6 hours in water (OAN-06, Fig. 10S, ESI†) show no unsaturation, and the broad band verified at 3482 cm−1 was attributed to O–H stretching of α-hydroxy-hydroperoxides and carboxylic acids. Samples ozonated for 10 (OAN-10, see Fig. 12S, ESI†) and 12 hours (Fig. 1d) in water, displayed new band at 1710 cm−1 assigned to the carbonyl of saturated acids formed by oxidation of aldehydes and decomposition of ozonides by the continuous ozonolysis process.13
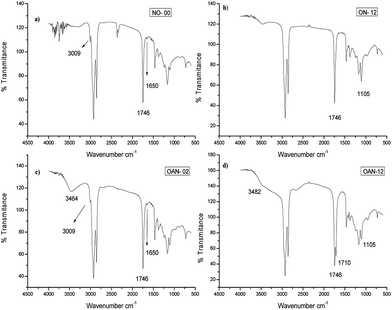 | ||
| Fig. 1 IR spectra of the following samples: (a) pure neem oil; (b) neem oil ozonated for 12 h; (c) neem oil ozonated for 2 h in presence of water; (d) neem oil ozonated of 12 h in presence of water. | ||
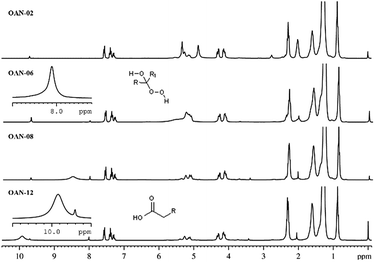
The 1H NMR spectrum of pure neem oil showed doublet of doublets at 4.08 and 4.30 ppm assigned to methylene hydrogens, a multiplet at 5.32 ppm ascribed to the central C–H, referred to glycerol moiety and triplet assigned to methylene hydrogens α-carbonyl at 2.28 ppm. These signals were also displayed for all ozonated samples in the presence or absence of water, indicating that the reaction occurred only at the fatty acids unsaturation, there was no evidence of triglyceride hydrolysis. 13C NMR spectra of the ozonated samples also corroborates this assertion, since all have signals in the range of 170 ppm, which can be attributed to the carboxyl esters (Fig. 15S, see ESI†).
In addition, for the pure neem oil signals attributed to the hydrogens of olefinic carbons of unsaturated acids at the region of 5.2–5.4 ppm (Ha, Fig. 2), and signals at 2.01 ppm and at 2.76 ppm that were assigned to the allylic and internal allylic hydrogen atoms, respectively, of poly-unsaturated acids were observed (Hb and Hb′, Fig. 2).13C NMR spectra signals for sp2 carbon atoms were found at 127 to 130 ppm region (Fig. 15S, ESI†).
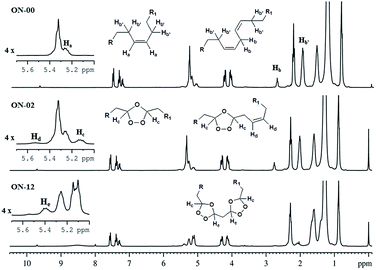 | ||
| Fig. 2 1H NMR spectra expansion at −0.1 to 10 ppm region for the following samples: ON-00 (pure neem oil); ON-02 (2 hours ozonated neem oil); ON-12 (12 hours ozonated neem oil). | ||
1H-NMR spectrum of 2 hours ozonated oil (ON-02) showed characteristics multiplets of monounsaturated acids ozonides at 5.14–5.08 (Hc, Fig. 2). New signals appeared at 5.54–5.58 ppm attributed to the remained olefinic protons close of ozonide ring Hd, Fig. 2 a singlet at 9.7 ppm relative to the aldehydes resulting from the bond cleavage at C-9 and C-6 of oleic and linoleic acids was also observed.
For the 12 hours ozonated sample (ON-12), the signals relative to unsaturations of oleic and linoleic acids were absent. The multiplets at 5.14–5.10 ppm and 5.42–5.36 ppm were assigned to ozonide hydrogens (Hc) and (He), respectively (Fig. 2).
13C NMR spectrum did not show signals at 130.00 ppm relative to unsaturation in ozonated samples giving rise to new signals at 104.00 ppm, which confirms the formation of ozonides. 1H-NMR spectrum of 2 hours ozonated sample in presence of water (OAN-02) showed a singlet at 4.86 ppm relative to the water trace (Fig. 3). This signal is a result of hydrogen interactions with the fatty acid ester, which is inexistent after 4 hours of ozonolysis.
Olefin signals were absent for the samples ozonated for more than 6 hours with addition of water and, it was observed a singlet at 8.01 ppm assigned to hydrogen of α-hydro-hydroperoxide (Fig. 3).
Ozonated samples for 10 and 12 hours with water (OAN-10 e OAN-12) displayed signals at 9.38 ppm and 9.92 ppm. Probably, these signals are relative to OH group of carboxylic acid generated by the oxidation of aldehyde and decomposition of ozonides as mentioned above. 13C NMR spectra showed signals relative to carboxyl carbon around 179 ppm (Fig. 36S and 38S, ESI†).
Physicochemical analyses and quantitative 1H NMR (qNMR)
Acidic and iodine values (AV and IV, respectively) were analyzed for pure and ozonated neem oil as shown in Table 2.| Samples* | IV (qNMR) (% molar) | IV (g of I2/100 of sample) | AV (mg of KOH g−1) |
|---|---|---|---|
| a * ON: neem oil; ON-00: pure neem oil; OAN: neem oil ozonated with water; 02 up 12: represent neem oil samples from 2 up 12 hours of ozonolysis. a,b The same alphabets represent no significant difference and different alphabet represent significant differences between IV obtained by NMR and by the Wijs method. Student's t-test was applied to verify significant differences between IV (P < 0.05). | |||
| ON-00 | 60.00 ± 0.36a | 69.08 ± 0.72b | 6.47 ± 0.45 |
| ON-02 | 46.63 ± 0.61a | 52.32 ± 0.59b | 10.37 ± 0.96 |
| ON-04 | 34.34 ± 0.62a | 42.47 ± 0.68b | 16.32 ± 1.37 |
| ON-06 | 22.54 ± 0.35a | 24.09 ± 1.63a | 21.59 ± 0.91 |
| ON-08 | 15.49 | 16.71 ± 1.10 | 21.94 ± 0.99 |
| ON-10 | 10.88 ± 0.71a | 9.36 ± 0.94a | 25.61 ± 0.89 |
| ON-12 | 0.00 | 0.00 | 39.79 ± 0.95 |
| OAN-02 | 34.45 ± 0.56a | 37.83 ± 0.27b | 17.26 ± 0.67 |
| OAN-04 | 22.98 ± 0.83a | 21.06 ± 0.46b | 32.22 ± 0.31 |
| OAN-06 | 17.85 ± 0.47a | 2.62 ± 0.48b | 60.08 ± 0.68 |
| OAN-08 | 0.00 | 0.00 | 93.16 ± 0.71 |
| OAN-10 | 0.00 | 0.00 | 139.84 ± 0.69 |
| OAN-12 | 0.00 | 0.00 | 117.44 ± 0.60 |
The increase in ozonolysis time leads to higher acid value (AV) caused by the formation of peroxide compounds.5 For the ozonated oils in water the value was larger, which is associated to the cleavage of peroxide compounds and oxidation of aldehydes leading to carboxylic acids as verified on 1H NMR spectra (Table 2).5
Iodine value is an analytic technique used to measure the degree of unsaturation of oils.24 The analytic technique measures the quantity of I2 consumed in 100 g of sample and depends on many factors, mainly the number of carbon–carbon double bonds, conditions and time of storage, and oxidation processes.25 However, when the ozonized oils have high viscosity or it turn solid, the access to double bond of iodine monochloride reagent is demanding. For this reason, the iodine value determination is not exact for this measurement.26 In this work, the IV was also determined by quantitative analyzes of 1H NMR (qNMR) showed in Table 2. Providing that all parameters are followed for quantification, this is a simple and short time technique to acquire experiments, without the necessity of external calibration.27
The IV results by the methods of Wijs and NMR showed a decrease as the ozonolysis reaction time was longer since the ozone reacted with double bonds of fatty acids (Table 2). Except for sample OAN-06, the results of IV for both of the methods were similar to each other. Samples ON-00 (pure oil), ON-02, ON-04 and OAN-02 presented IV by the method of Wijs significantly higher than those obtained by NMR, probably as consequence of deviations originated by the titration process.
On the other hand, as the IV diminished by the ozonolysis reaction, the interference of coalescent signals in the same region of quantification by NMR was observed and, an increase of IV in comparison with Wijs method was detected (samples OAN-04 and OAN-06) likely as a result of a formation of other compounds during ozonolysis. In this respect, in very low IV there was a convergence between the results for both of these methods (samples ON-06, ON-08 and ON-10), indicating that the deviations by the method of Wijs seem to be superior to those found by NMR, since only when the NMR deviation become higher due to overlapping of signals, the results become significantly equivalent.
Thermal analyses
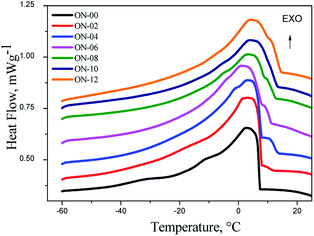
The crystallization of unsaturated fatty acids happens at temperatures around −30 °C and the saturated at higher temperatures between −10 and 15 °C.28 In this work, it was observed pure neem oil crystallization at 7.29 °C, probably due to presence of a larger amount of oleic acid (Fig. 4).
An increase of the crystallization temperature of unsaturated compounds was also detected by Pierezana et al. (2015)28 for the oil from T. cattapa that comprises 37.5% of oleic acid and 22.6% linoleic acid, and showed crystallization point at 5.95/4.09 °C (methylic/ethylic phases) which can be attributed to the existence of saturated acids, such as palmitic, that crystallizes at 23.2 °C leading to a temperature increase of the crystallization point.
DSC curves (Fig. 4) shows the temperature shifting to higher values in different times at the beginning of the crystallization process of ozonated oils. The increase of the temperature taking place in consecutive steps of exothermic events is caused by the formation of different polymorphic forms, crystallization of different fractions of fatty acids and, formation of peroxide compounds.29 With 2 hours of ozonolysis (ON-02) the event of crystallization shifted to 7.36 °C. With 4, 6, 8 and 10 h of reaction the shifts were to 13.17 °C, 11.13 °C, 12.79 °C and 13.13 °C, respectively, which is attributed to an incomplete reaction of ozone with unsaturated bonds as discussed by the analysis of 1H NMR and IV data. With 12 hours of reaction, when there are no unsaturated compounds, the crystallization temperature was 14.33 °C (Fig. 4).
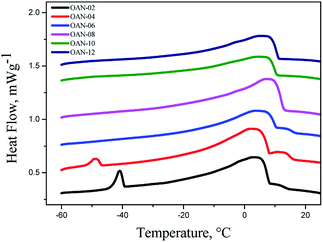
Samples OAN-02 and OAN-04 showed exothermic peaks at −39.43 °C and −46.91 °C, respectively. This event may have arisen because of the interaction of water with triglycerides that diminishes van der Waals force between the fatty acid chains. Thus, these crystallization temperatures are relative to unsaturated fatty acids (Fig. 5).
The crystallization temperature of sample OAN-06 was 16.68 °C and from 8 hours of reaction, differing from the samples without water addition, the crystallization temperatures were lower i.e. 12.83 °C, 10.58 °C and 11.14 °C for OAN-08, OAN-10 and OAN-12, respectively. As the samples are saturated, (IV = 0.00, Table 2) the formed ozonides oxidized to other previously mentioned compounds, influencing the crystallization temperature of the samples (Fig. 5).
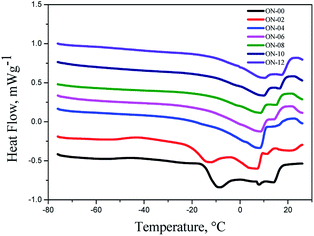
Complex characteristics such as non-separable peak shoulders on endothermic curves were observed as those reported by the Tan and Man (2000).30 Pure neem oil showed melting point at −14.36 °C and peak max at −9.55 °C relative to unsaturated and saturated fatty acids, respectively (Fig. 6).
With the increase in the ozonolysis reaction time, the melting point also shifted to higher values because of the saturation of fatty acids double bonds, with a peak max at 8.29 °C, 8.58 °C, 8.83 °C, 9.60 °C and 10.28 °C for the samples ON-04, ON-06, ON-08, ON-10 e ON-12, respectively. For ON-02 the DSC curve shows an additional event with a peak max at −13.90 °C, likely due to residues of unsaturated fatty acids (Fig. 6).
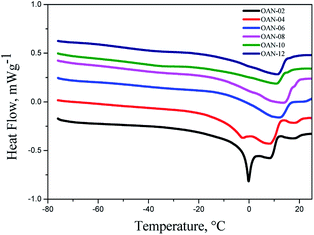
In the DSC curves of ozonated oils with water addition was observed for OAN-02 an acute peak max at −0.19 °C. The samples OAN-04 showed exotherms peak max at −2.87 °C for unsaturated and 8.59 °C for saturated fatty acids, which can be explained by the decreasing of van der Waals interactions (Fig. 7).
The increase in the melting point with the reaction time was also observed for the samples ozonated in water OAN-6, OAN-08, OAN-10 e OAN-12, showing peak max at 10.97 °C, 13.76 °C, 10.93 °C and 11.20 °C, respectively (Fig. 7).
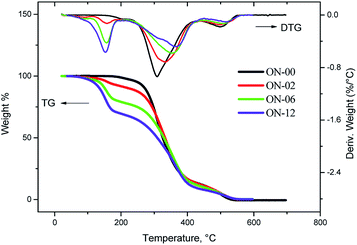
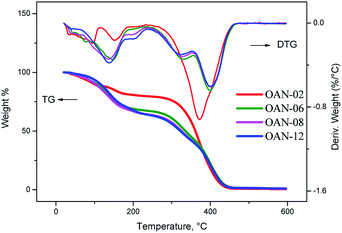
For the pure neem oil under synthetic air atmosphere it was observed decomposition over two steps on curves of TG/DTG. The first event starts at 240 °C with mass loss of 81.37%, associated to oxidation of unsaturated oleic and linoleic acids that are present in greater amounts. The second step, at 445.7 °C with mass loss of 12.71% is related to the oxidation of saturated fatty acids (Fig. 8).32,33
From two hours of ozonolysis, the TG/DTG curves showed decomposition in three steps, having initial decomposition at 125 °C with mass loss of 5.16%. The mass loss increases with the ozonolysis time as a result of oxidant atmosphere and ozonides formation. As the sample ON-12 has no more unsaturation, the formed compounds are thermally less resistant and stable than samples under short reaction times, due to the formation of the peroxidic compounds which decomposes into three stages (Fig. 8).
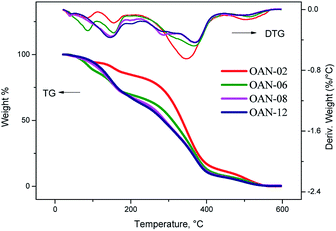
It was observed for the ozonated products formed up till through 8 hours of reaction with the addition of water, as in and oxidant atmosphere as in nitrogen (Fig. 9 and 11), a decline on thermal stability by the loss of added water. Under oxidant atmosphere, the products formed up till 6 hours of reaction presented stability up to 120 °C. As the reaction time increased, the stability was reduced likely because of the oxidation of fatty acid and peroxide compounds. The samples OAN-08, OAN-10 and OAN-12 were stable up to 70 °C (Fig. 9).
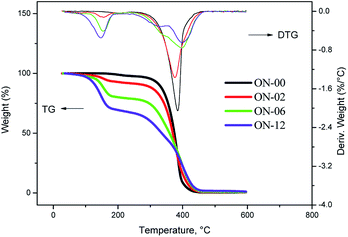
In nitrogen atmosphere, the samples of pure neem oil decompose in only one step, temperature of 298.40 °C, while the ozonated samples decompose in two steps, initial temperature of 110 °C for the products formed up till 6 hours of reaction and samples ON-08, ON-10 e ON-12 were stable up to 80 °C (Fig. 10).
In nitrogen atmosphere, the samples OAN-02 and OAN-04 showed the same initial temperature of decomposition at 120 °C, in three steps. With 6 hours of reaction the decomposition is in two steps starting at 93 °C. The temperature of decomposition of OAN-08, OAN-10 and OAN-12 decreased to 70 °C (Fig. 11).
Antimicrobial activity
Antimicrobial test was carried out with eight bacterial strains; four Gram-positive: Enterococcus faecalis (NEWP 0012), clinical Enterococcus faecium (resistant to vancomycin), Staphylococcus aureus (ATCC 25923 and clinical strain resistant to oxacillin and penicillin G) in addition to four Gram-negative: Pseudomonas aeruginosa (ATCC 27853) and clinical strain (resistant to aztreonam, imipenem and meropenem), Escherichia coli (ATCC 25922) and multiresistant Klebsiella pneumoniae (KPC) clinical strain. Those microorganisms are responsible for the most diverse infections in healthy and immunocompromised patients.34The infections caused by Gram-negative bacteria are of major concern since they experience genetic modifications leading to new resistance to antibiotics such as strains of K. pneumoniae, which are resistant to all antibiotics currently available.35 Staphylococcus aureus has long been recognized as one of the most important bacteria that cause clinical infections such as osteoarticular, skin and soft tissue, pleuropulmonary, and device related infections.36
In this work, the ozonated neem oil with and without addition of water both showed excellent results against the tested strains when compared to literature results (Table 3).
| Samples | MIC (mg mL−1) | |||||||
|---|---|---|---|---|---|---|---|---|
| Bacteria strains | ||||||||
| E. faecalis (NEWP 0012) | E. faecium (clinical) | S. aureus (ATCC 25923) | S. aureus (clinical) | E. coli (ATCC 25922) | P. aeruginosa (ATCC 27853) | P. aeruginosa (clinical) | K. pneumoniae ssp. (KPC, clinical) | |
| a —: not active at the tested concentrations. | ||||||||
| ON-00 | — | — | — | — | 5 | — | — | — |
| ON-02 | — | — | — | — | — | — | — | — |
| ON-04 | — | — | — | — | — | — | — | — |
| ON-06 | — | 2 | — | — | — | — | — | — |
| ON-08 | <0.5 | <0.5 | — | — | — | — | — | — |
| ON-10 | 5 | — | 5 | — | — | — | — | — |
| ON-12 | 1 | 1 | 5 | 7 | — | — | — | 7 |
| OAN-02 | 5 | 2 | 2 | 7 | 7 | — | — | — |
| OAN-04 | 2 | 2 | 2 | 3 | 3 | — | 5 | 7 |
| OAN-06 | <0.5 | <0.5 | 3 | 3 | 3 | — | 5 | 5 |
| OAN-08 | 5 | <0.5 | 2 | 5 | 5 | 5 | 7 | — |
| OAN-10 | 2 | 2 | 2 | 5 | — | — | — | — |
| OAN-12 | 7 | — | 7 | 5 | — | — | — | — |
Ozonated oils produced with a water addition during shortest reaction time were active, while those formed in absence of water in the same period of time did not show activity. Presumably, this is related to the formation of greater quantity of bioactive peroxide compounds, such as hydroperoxides and peroxy hemi-acetals, when ozonolysis is carried out in presence of water.13,18
Strains of E. faecalis, clinical E. faecium, and standard and methicillin-resistant S. aureus were more susceptible to ozonated oils as the Gram-positive bacteria are more sensitive than Gram-negative because of the composition of their cell walls.37
Samples ozonated for 12 hours without water addition (ON-12), and for 4 and 6 hours with in presence of water (OAN-04 and OAN-06) showed MIC of 7 mg mL−1 and 5 mg mL−1 against K. pneumoniae, which is an excellent result considering its high resistance to antibiotics. Many literature studies reveal antibacterial activity of ozonated oils against different bacterial strains, for example Mycobacterium sp., Staphylococcus sp., Streptococcus sp., Enterococcus sp., E. coli, P. aeruginosa, E. faecalis and S. aureus.23,38,39
Sechi et al. (2011)38 found MIC values of 9.5 mg mL−1 for E. faecalis and S. aureus, and of 4.75 mg mL−1 for E. coli and P. aeruginosa. Moureu et al. (2015)4 reported values of 5 mg mL−1 for oil ozonated with addition of water and MICs of 1.23 to 10.0 mg mL−1 against S. aureus, and 2.5 to 40.0 mg mL−1 against E. coli. Those results clearly show the greater activity of ozonated neem samples compared to the literature data for other ozonated oils.
Cytotoxicity assays
The ozonated neem oils that showed promising antimicrobial activity in the present study were investigated for cytotoxicity against two human cell lines: HaCaT (Immortalised Human Keratinocyte) and HCEC (Human Corneal Epithelial Cells) by the MTT assay. The GI50 values obtained are shown in Table 4. Pure neem oil (ON-00) did not show any cytotoxicity at the range of concentration tested (18.75–600 μg mL−1). This result correlated with studies conducted on normal cells in which neem oil was found to be nontoxic.40| Samples | GI50 (μg mL−1) | |
|---|---|---|
| Cell lines | ||
| HaCaT | HECEC | |
| ON-00 | >600 | >600 |
| ON-10 | 257.15 | 48.21 |
| ON-12 | 182.37 | 128.84 |
| OAN-02 | 269.80 | 260.80 |
| OAN-04 | 325.37 | 76.05 |
| OAN-08 | 164.52 | 76.17 |
| OAN-10 | 294.18 | 75.98 |
| OAN-12 | 319.88 | 142.16 |
| 5-Fluorouracil | 6.82 | >500 |
| Methotrexate | >500 | >500 |
Ozonated neem oils presented no cytotoxicity in skin cells such as HaCaT, making them a promising compound to treatment chronic wounds and skin infections.23 However, the oils were more toxic against HECEC cells than the positive control.
3. Experimental procedure
The neem oil was obtained by cold extraction (Véris óleos vegetais). Ozone was generated by ozonator Ozone & Life.1H and 13C measurements were carried out at a Bruker DPX 300, 7.05 T, tuned to 300.13 MHz for 1H and 75 MHz for 13C, using CDCl3 as a solvent.
1H NMR quantitative analyzes (qNMR) were performed by integration of signals. As they are proportional to the number of nuclei, it was possible to quantify the saturated fatty acids (SFA) and verify the iodine value with the aid of relations presented by Popescu and coworkers (2015).41 For quantitative determination of oleic and linoleic acids we employed the methodology previously described by Barison and coworkers (2010) from 1H NMR oil spectra.42 The analyses were conducted by integrating signals of interest (linoleic acid: 2.92 to 2.59; oleic acid: 2.13 to 1.86 subtracted from the signal of linoleic acid) with relation to signal of an internal standard biphenyl, integration region δ7.65 to δ7.46 (see Fig. 39S–51S, ESI†) using equations27 and the software ERETIC to interpret the NMR data.43
Fourier Transform Infrared Spectrometer (FTIR) model MB-100 of BOMEM, USA, was used to obtain IR spectra. DSC analyzes were performed with a heating rate of 10 °C min−1 and temperatures ranging from −80 to 30 °C, in N2 atmosphere with flux rate of 50 mL min−1.
TGA analyses were carried out with a heating flux of 10 °C in N2 atmosphere and synthetic air at temperatures ranging from 100 °C to 600 °C. Acidic values were determined using a solution of potassium hydroxide 0.1 N and phenolphthalein as the indicator.44 Iodine values were determined by the Wijs method, using a solution of sodium thiosulfate 0.1 N,45 replacing carbon tetrachloride by cyclohexene.46
The determination of fatty acid composition by capillary gas chromatography-CGC using the equipment AGILENT 68650, series GC System, capillary column DB-23 AGILENT (50% cyanopropyl) – methylpolysiloxane, 60 m, internal diameter 0.25 mm, film 0.25 μm. Conditions of operation: flux = 1.00 mL min−1; linear rate = 24 cm s−1; detector temperature = 280 °C; injector temperature = 250 °C; oven temperature = 110 °C – 5 min; 110–215 °C (5 °C min−1); 215–24 min; helium as the carrier gas. The injected volume was 1.0 μL, according to a AOCS 2009.47
Ozonolysis of pure neem oil
It was added 50 mL of neem oil into a graduate cylinder of 250 mL. Then, ozone was flowed at a rate of 63 mg min−1 O3/O2 within a maximum time of 12 hours period. The samples were identified as: ON-02, ON-04, ON-06, ON-08, ON-10 and ON-12 corresponding to 2, 4, 6, 8, 10 and 12 hours of reaction, respectively. The reactions were at room temperature for samples until 6 hours of reaction. For the samples submitted to reaction time over 8 dichloromethane (25 mL) was added.Ozonolysis of neem oil in presence of water
50 mL of neem oil was used with addition of 10% (v/v) of miliQ water, to obtain the samples named OAN-02, OAN-04, OAN-06, OAN-08, OAN-10 and OAN-12. For the samples submitted to reaction time over 8 h the temperature was of 40 °C in water bath.Antimicrobial evaluation
The tests were carried out by agar macrodilution method, with the following bacterial strains: P. aeruginosa (ATCC 27853), clinical strain of P. aeruginosa (resistant to aztreonam, imipenem and meropenem), E. faecalis (NEWP 0012), clinical strain of E. faecium (resistant to vancomycin), E. coli (ATCC 25922), S. aureus (ATCC 25923), and clinical strain of S. aureus (resistant to oxacillin and penicillin G). Clinical strains were donated by the Laboratory of Bacteriology of the Center for Clinical Analysis of the UFMS Teaching Hospital, in Campo Grande, Brazil, and assays were performed at Sintmol – Biotechnology Lab of Institute of Chemistry – UFMS. The inocula was an overnight culture of each bacterial species in Mueller-Hinton agar diluted in saline sterile solution (0.45%) to a concentration of approximately 108 CFU mL−1.The samples were solubilized in Mueller-Hinton agar with 2% of Tween-80. The plates were prepared at different concentrations (7, 5, 3, 2, 1, and 0.5 mg mL−1). Aliquots of 5 μL of each inoculum were applied over the agar layer containing the samples and the plates were incubated at 37 °C. The presence or absence of colonies was verified after 24 hours of incubation.23,48
MTT assay
The human keratinocyte cell line (HaCaT) was generously donated by Dr Oupicky (Center for Drug Delivery and Nanomedicine, Department of Pharmaceutical Sciences of the University of Nebraska Medical Center), and human corneal epithelial cell (HCEC) lines, kindly donated by Dr Lewis (Eppley Cancer Institute of the University of Nebraska Medical Center). Cytotoxicity assays were performed at the Center for Drug Discovery at the University of Nebraska Medical Center. Immortalized Human Keratinocyte (HaCaT) and Immortalized Human corneal Epithelial Cell (HCEC) lines (ATCC CRL-11135) were used for cytotoxicity assay. Monolayers of HaCaT and HCEC were prepared with cultures that were less than 10 passages to ensure the consistency among experiments. The HaCaT cells were cultured in DMEM – high glucose (Hylcone, Thermo Scientific, South Logan, Utah), with 10% fetal bovine serum (Gibco Invitrogen), and 1% penicillin/streptomycin (Gibco Invitrogen) in a humidified environment at 37 °C with 5% CO2. The HECEC cells were cultured in DMEM – high glucose, 4.5 g L−1 glucose and 4 mM L-glutamine without sodium bicarbonate and sodium pyruvate (Hylcone, Thermo Scientific, South Logan, Utah), with Medium 199 (Invitrogen), Cosmic Calf Serum (Hylcone, Thermo Scientific), Hydrocortisone (Sigma Aldrich), Sodium Selenite (Sigma Aldrich), Apo-Transferrin bovine (Sigma Aldrich), Insulin (Sigma Aldrich), Gentamicin (Sigma Aldrich) and Recombinant human EGF (R&D systems). These cultures were maintained with weekly subculture using the Tryple Express (stable trypsin replacement; Gibco Invitrogen) and fed every 2 to 3 days.49 The assay was carried out in sterile 96-well flat-bottomed polystyrene microtiter plates (Nunclon Delta Surface, Thermo Scientific). Plates contained 100 μL of cells suspension in each well (5000 cells per well) were pre-incubated for 24 hours in a humidified environment at 37 °C with 5% CO2. Samples to be tested were 2-fold diluted to the stock plates in DMSO and then 10-fold diluted in complete medium. 10 μL of each concentration were added to test plates in triplicate to get final concentrations at 18.75, 37.5, 75, 150, 300 and 600 μL mL−1 (highest DMSO concentration used in the assay, of 1%, so as not affect viability of cells). The test plate contained compounds, blanks, the negative control (cells in culture medium), and the positive control 5-fluorouracil (0.025, 0.05, 0.5, 5, 50 and 500 μL mL−1) were incubated for 48 hours. 50 μL MTT solution was added to each well and the plates were incubated at 37 °C for 2 h. During the incubation, the active enzymes of the viable cells transformed the yellow MTT into purple formazan crystals. The top medium was then removed and 100 μL DMSO was added to each well to dissolve the formazan crystals. The absorbance of the solution was determined at 600 nm by a multi-well plate reader AccuSkan, MultiSkan FC (Thermo Fisher Scientific).494. Conclusions
Ozonolysis reactions with neem oil were carried out every 2 hours in the range of 2 to 12 hours, in presence or absence of water. The peroxide products were analyzed and characterized by using analytical techniques and, 1H/13C NMR, infrared spectroscopies. The unsaturation degree of ozonated products for different period of times was determined by Wijs method (iodine value) and also by quantitative 1H NMR. The quantitative 1H NMR used in this work is unprecedented and an excellent alternative for the determination of iodine value of ozonated vegetable oils because of easy execution, utilization of small amount of sample, and makes no use of hazardous chemicals.The results of antibacterial tests of ozonated neem oil are promising and excellent in comparison with literature data showing MIC of <0.5 mg mL−1 for standard E. faecalis and clinical E. faecium, besides to present good activity against multidrug resistant strains of Klebsiella pneumonia (KPC), and S. aureus (MRSA and standard strains). Cytotoxicity assays showed that the ozonated oils are less toxic on human keratinocytes than currently used drugs suggesting a potential as new therapeutic agents of natural origin.
5. Authors' contributions
de Oliveira, P. D.; de Almeida, N. R.; Micheletti, A. C.; dos Santos, E. A.; Marques, M. R. and Carvalho, N. C. P. conducted and analyzed the experimental bioassays, participated in the design of the study. de Oliveira, P. D.; de Oliveira, L. C.; de Arruda, E. J.; Apparecido, R. P. and Alcantara, G. B. conducted the synthesis process and characterization of the compounds described in the research as well as participated in the design of the study. Beatriz, A.; Micheletti, A. C. and de Lima, D. P. conceived of the study, participated in its coordination and helped to draft the manuscript. de Almeida, N. R. and Conda-Sheridan, M. conducted and analyzed the cytotoxicity assays. All authors read and approved the final manuscript.Acknowledgements
The authors thank CNPq, FUNDECT-MS and UFMS for financial support.References
- F. A. Gültekin, B. H. Bakkal, D. Sümer, F. Köktürk and S. Bektas, Balk. Med. J., 2013, 30, 369 CrossRef PubMed.
- C. P. Vicente, Enfermedades infecciosas y microbiología, 2013, 34, 64 Search PubMed.
- N. R. Almeida, A. Beatriz, A. C. Micheletti and E. J. Arruda, Orbital: Electron. J. Chem., 2012, 4, 313 Search PubMed.
- S. Moureu, F. Violleau, D. A. Haimoud-Iekhal and A. Calmon, Chem. Phys. Lipids, 2015, 186, 79 CrossRef CAS PubMed.
- M. F. Díaz, Y. Sánchez, M. Gómez, F. Hernández, M. C. C. Veloso, P. A. P. Pereira, A. S. Mangrich and J. B. Andrade, Grasas Aceites, 2012, 63, 466 CrossRef.
- M. J. Gualtieri, N. Malafronte, A. Vassallo, A. Braca, R. Cotugno, M. Vasaturo, N. Tommasi and F. Dal Piaz, J. Nat. Prod., 2014, 77, 596 CrossRef CAS PubMed.
- D. J. Kelsey, C. Nieto-Delgado, F. S. Cannon and R. A. Brennan, J. Appl. Microbiol., 2015, 119, 65 CrossRef CAS PubMed.
- C. C. Womack, M. A. Martin-Drumel, G. G. Brown, R. W. Field and M. C. McCarthy, Sci. Adv., 2015, 1, 1 Search PubMed.
- E. E. Mak-Mensah and C. K. Firempong, Asian J. Plant Sci. Res., 2011, 4, 1 CrossRef.
- D. Djibril, F. Mamadou, V. Gérard, M. D. C. Geuye, S. Oumar and R. Luc, Res. J. Chem. Sci., 2015, 5, 52 CAS.
- P. U. Zhong-Hui, Z. Yu-Qun, Y. Zhong-Qiong, X. Jiao, J. Ren-Yong, L. Yang and Y. Fan, Agric. Sci. China, 2010, 9, 1236 CrossRef.
- J. S. S. Pinto and F. M. Lanças, Quim. Nova, 2010, 33, 394 CrossRef CAS.
- T. S. Omonov, E. Kharraz and J. M. Curtis, J. Am. Oil Chem. Soc., 2011, 88, 689 CrossRef CAS.
- I. Zanardi, V. Travagli, A. Gabbrielli, L. Chiasserine and V. Bocci, Lipids, 2008, 43, 877 CrossRef CAS PubMed.
- R. Criegee, Angew. Chem., Int. Ed., 1975, 14, 745 CrossRef.
- A. Sega, I. Zanardi, L. Chiasserini, A. Gabbrielli, V. Bocci and V. Travagli, Chem. Phys. Lipids, 2010, 163, 148 CrossRef CAS PubMed.
- A. R. M. Oliveira and C. L. Wosch, Quim. Nova, 2012, 35, 1482 CrossRef CAS.
- P. Guerra-Blanco, T. Poznyak, I. Chairez and M. Brito-Arias, Eur. J. Lipid Sci. Technol., 2015, 117, 988 CrossRef CAS.
- V. Bocci, in Ozone: a New Medical Drug, Springer, 1st edn, 2005, p. 315 Search PubMed.
- V. A. Bocci, Arch. Med. Res., 2006, 37, 425 CrossRef CAS PubMed.
- D. A. Benício, V. Queiroga Neto and J. G. Sousa, Journal of Biology & Pharmacy and Agricultural Management, 2010, 4, 22 Search PubMed.
- A. B. Chaudhari, P. D. Tatiya, R. K. Hedaoo, R. D. Kulkarni and V. V. Gite, Ind. Eng. Chem. Res., 2013, 52, 10189 CrossRef CAS.
- N. R. A. Kogawa, E. J. Arruda, A. C. Micheletti, M. F. C. Matos, L. C. S. Oliveira, D. P. Lima, N. C. P. Carvalho, P. D. Oliveira, M. C. Cunha, M. Ojedad and A. Beatriz, RSC Adv., 2015, 5, 65427 RSC.
- M. Choudhary, K. Grover and J. Javed, Proc. Natl. Acad. Sci., India, Sect. B, 2015, 85, 211 CrossRef CAS.
- G. G. Shimamoto, M. M. A. Favaro and M. Tubino, J. Braz. Chem. Soc., 2015, 26, 1431 CAS.
- M. F. Díaz, R. Hernández, G. Martínez, G. Vidal, M. Gómez, H. Fernández and R. Garcés, J. Braz. Chem. Soc., 2006, 17, 403 CrossRef.
- F. Malz and H. Jancke, J. Pharm. Biomed. Anal., 2005, 38, 813 CrossRef CAS PubMed.
- L. Pierezana, M. R. P. Cabral, D. Martins Neto, J. M. Stropa, L. C. S. Oliveira, D. R. Scharf, E. L. Simionatto, R. C. L. Silva and E. Simionatto, Quim. Nova, 2015, 38, 328 Search PubMed.
- E. Chiavaro, E. Vittadini, M. T. Rodriguez-Estrada, L. Cerretani, M. Bonoli, A. Bendini and G. Lercker, J. Agric. Food Chem., 2007, 55, 10779 CrossRef CAS PubMed.
- C. P. Tan and Y. B. Che Man, J. Am. Oil Chem. Soc., 2000, 77, 143 CrossRef CAS.
- J. R. S. Politi, P. R. R. Matos and M. J. A. Sales, J. Therm. Anal. Calorim., 2013, 111, 1437 CrossRef CAS.
- C. C. Garcia, P. I. B. M. Franco, T. O. Zuppa, A. Antonio Filho and M. I. G. Leles, J. Therm. Anal. Calorim., 2007, 87, 645 CrossRef CAS.
- R. Bagoria, S. Arora and M. Kumar, Arch. Appl. Sci. Res., 2012, 4, 2382 CAS.
- F. B. R. D. Iorio, A. M. A. Liberatore, I. H. J. Koh, C. Otani and F. F. Camilo, Ozone: Sci. Eng., 2016, 38, 253 CrossRef CAS.
- A. Y. Peleg and D. C. Hooper, N. Engl. J. Med., 2010, 362, 1804 CrossRef CAS PubMed.
- S. Y. C. Tong, J. S. Davis, E. Eichenberger, T. L. Holland and V. G. Fowler Jr, Clin. Microbiol. Rev., 2005, 28, 603 CrossRef PubMed.
- T. J. Silhavy, D. Kahne and S. Walker, Cold Spring Harbor Perspect. Biol., 2010, 2, a000414 Search PubMed.
- L. A. Sechi, I. Lezcano, N. Nunez, M. Espim, I. Dupre, A. Pinna, P. Molicotti, G. Fadda and S. Zanetti, J. Appl. Microbiol., 2001, 90, 279 CrossRef CAS PubMed.
- M. Díaz, I. Lezcano, J. Molerio and F. Hernández, Ozone: Sci. Eng., 2001, 23, 35 CrossRef.
- F. Ricci, V. Berardi and G. Risuleo, Molecules, 2009, 14, 122 CrossRef CAS PubMed.
- R. Popescu, D. Costinel, O. R. Dinca, A. Marinescu, I. Stefanescu and R. E. Ionete, Food Control, 2015, 48, 84 CrossRef CAS.
- A. Barison, C. W. da Silva, F. R. Campos, F. Simonelli, C. A. Lenz and A. G. Ferreira, Magn. Reson. Chem., 2010, 48, 642 CAS.
- W. S. Nunes, C. S. Oliveira and G. B. Alcantara, Magn. Reson. Chem., 2016, 54, 334 CrossRef PubMed.
- European Pharmacopoeia. Acid value, Council of Europe, Strasbourg Cedex, France, 5th edn, 2004, p. 127 Search PubMed.
- European Pharmacopoeia, Iodine value, Council of Europe, 5th edn, Strasbourg Cedex, France, 2004, pp. 127–128 Search PubMed.
- Instituto Adolfo Lutz, Normas analíticas do Instituto Adolfo Lutz. v.1: Métodos Químicos e Físicos para Análise de Alimentos, 3rd edn, 1985, pp. 245–246 Search PubMed.
- AOCS, Official Methods and Recommended Practices of the American Oil Chemists' Society, American Oil Society, Champaign, 6th edn, 2009 Search PubMed.
- NCCLS, National Committee for Clinical Laboratory Standards, Methods for Dilution Antimicrobial Susceptibility Tests for Bacteria that Grow Aerobically, M7-A3, 3rd edn, 1993, p. 13 Search PubMed.
- M. Xu, D. J. McCanna and J. G. Sivak, J. Pharmacol. Toxicol. Methods, 2015, 71, 1 CrossRef CAS PubMed.
Footnote |
| † Electronic supplementary information (ESI) available. See DOI: 10.1039/c7ra00574a |
| This journal is © The Royal Society of Chemistry 2017 |

