 Open Access Article
Creative Commons Attribution 3.0 Unported Licence
Mesopore-dominant wormhole-like carbon with high supercapacitive performance in organic electrolyte†
Xiaoqing Yang *,
Jianlin Yu,
Weijian Zhang and
Guoqing Zhang
School of Materials and Energy, Guangdong University of Technology, Guangzhou 510006, PR China. E-mail: yxq-886@163.com
First published on 7th March 2017
Abstract
For designing porous carbon-based electrodes in electric double-layer capacitors (EDLCs), it is crucial to construct a large ion-accessible surface area as well as efficient mass transfer pathways, especially for organic electrolytes with large ion sizes. Here we report the supercapacitive properties of wormhole-like mesoporous carbon (WMC) in both 6 M KOH and 1 M tetraethylammonium tetrafluoroborate (TEABF4) electrolyte. The suitable mesopore size (3.1 nm) of WMC, which is 3 times larger than the solvated ion size of TEABF4, offers a large ion-accessible surface area for charge accumulation. The 3D continuous carbon framework and interconnected mesopore-dominant structure endow the WMC with excellent electron/electrolyte transfer pathways. As a consequence, it presents a small decrease of specific mass capacitance in TEABF4 as compared to that in KOH (174 vs. 189 F g−1, respectively), and a far superior high-rate capability in TEABF4 than most of other porous carbon materials.
1. Introduction
Nanoporous carbon materials (PCMs) have sparked enormous interest as the electrode of electric double-layer capacitors (EDLCs), not only in fundamental scientific investigations, but also for practical applications.1–14 Their low cost, long cycling stability and stable physical–chemical properties make them more applicable as compared to the other candidates, such as conducting polymers and transition metal oxides.4–12 Commercially available activated carbon (AC) is widely used as electrodes in practical applications. To meet the ever-increasing demands of high energy density and high rate charging–discharging properties, numerous efforts have been devoted to developing novel PCMs with well-defined nanostructures for optimizing the electrochemical capacitive behaviors.5–26Although the energy storage mechanism of EDLCs is still unclear, guidance based on abundant previous investigations for designing the nanostructure of PCM is generally accepted: constructing a large surface area coupled with sufficient electrolyte transfer pathways, such as microporous carbons with a tunnel shaped macroporous structure,15 nitrogen-containing ultramicroporous carbon nanospheres,16 hierarchical porous carbon,17–20 hollow carbon nanospheres with ultrahigh surface area,21 etc.22–27
However, a large surface area is usually contributed by a developed microporosity (with abundant pores < 2 nm),15–21 while in practical application, organic electrolyte of tetraethylammonium tetrafluoroborate (TEABF4) rather than aqueous electrolytes (e.g., KOH and H2SO4) is used because of its much higher working potential. Thus, a problem is encountered for most PCM-based electrodes: the ion-accessible surface area would be reduced to a great extent because the ion size of TEA+ and BF4− is much larger than that of K+, OH− and SO4−, etc. (ca. 0.6 nm vs. ca. 0.3 nm, Table S1†),28 resulting in a much lower specific mass capacitance (Cm) in almost all of the studies,29–34 e.g., 294 F g−1 in 6 M KOH vs. 129 F g−1 in 1 M TEABF4,29 210 F g−1 in 6 M KOH vs. 103 F g−1 in 1 M TEABF4,30 305 F g−1 in 6 M KOH vs. 178 F g−1 1 M TEABF4.31 What's worse, it should be noted that the size of the solvated TEA+ and BF4− (ca. 1.2 nm, Table S1†) is even two times larger than that of the desolvated ones.28 This may lead to a more serious decrease of Cm at high current densities owing to the insufficient time of solvent shell removing,28 ion diffusion and charge arrangement35,36 during a limited charge/discharge period. For instance, a pistachio-nutshell-based PCM with a high surface area of 1069 m2 g−1 and micropore proportion (Vmic%) of 83% presented Cm of 313 and 215 F g−1 in aqueous and organic electrolyte, respectively. When the scan rate was increased from 2 to 500 mV s−1, a much lower Cm retention was observed in organic electrolyte than that in aqueous electrolyte (∼25% vs. 68%).34 Therefore, considering that aimlessly increasing the pore size will lead to a decrease of the surface area, the crucial point for designing the state-of-the-art PCM-based electrode in practical application is to construct a suitable pore size for simultaneously achieving a large ion-accessible surface area for charge accumulation and guaranteeing the transfer of the electrolyte, particularly under high current densities.
Among various novel PCMs, wormhole-like mesoporous carbon (WMC) is expected to demonstrate great potential for organic-electrolyte-based EDLCs, because it presents not only a high surface area primarily contributed by small mesopores, but also a unique 3D continuous mesopore morphology and carbon skeleton.37 We have so far pioneered the fabrication of WMC with widely tunable mesopore sizes through a simple one-step-templating technique.37 This successful fabrication offers us the possibility to construct WMCs with a suitable pore size and high surface area for EDLC application.
Therefore, in this work, for the first time, we adopt WMCs with different mesopore diameters and surface area as the electrode materials of TEABF4-based EDLCs. It is highlighted that the suitable size of the small mesopores (3.1 nm) offers a large ion-accessible surface area for charge accumulation and an effective electrolyte transfer pathway, even under high current densities. As a result, it presents little decrease of Cm in TEABF4 in contrast to that in aqueous electrolyte (174 vs. 189 F g−1). In addition, WMC demonstrates a much more superior high-rate capability in organic electrolyte than most of other PCMs.
2. Experimental
2.1 Preparation of WMCs
The WMCs were prepared by a silica template method according to the previous report.37 During a typical procedure, sucrose was dissolved in an aqueous sulfuric acid solution (pH = 2.0) under stirring, followed by adding tetraethyl orthosilicate (TEOS) with and without 4 wt% HF solution under stirring (sucrose![[thin space (1/6-em)]](https://www.rsc.org/images/entities/char_2009.gif) :
:![[thin space (1/6-em)]](https://www.rsc.org/images/entities/char_2009.gif) H2SO4 solution
H2SO4 solution![[thin space (1/6-em)]](https://www.rsc.org/images/entities/char_2009.gif) :
:![[thin space (1/6-em)]](https://www.rsc.org/images/entities/char_2009.gif) TEOS = 2 g
TEOS = 2 g![[thin space (1/6-em)]](https://www.rsc.org/images/entities/char_2009.gif) :
:![[thin space (1/6-em)]](https://www.rsc.org/images/entities/char_2009.gif) 3 mL
3 mL![[thin space (1/6-em)]](https://www.rsc.org/images/entities/char_2009.gif) :
:![[thin space (1/6-em)]](https://www.rsc.org/images/entities/char_2009.gif) 4 mL). The obtained homogeneous mixture was quickly gelated and aged at 40 °C for 2 days, and then further reacted for 6 h at 160 °C. Subsequently, these samples were carbonized at 900 °C for 3 hours in N2 flow with a heating rate of 4 °C min−1. After carbonization, the resulting carbon/silica composites were washed with 40 wt% HF solution to remove the silica, followed by filtration and drying. The obtained WMCs with and without adding HF during the sol–gel process were denoted as WMC7 (TEOS/HF ratio = 7) and WMC0, respectively.
4 mL). The obtained homogeneous mixture was quickly gelated and aged at 40 °C for 2 days, and then further reacted for 6 h at 160 °C. Subsequently, these samples were carbonized at 900 °C for 3 hours in N2 flow with a heating rate of 4 °C min−1. After carbonization, the resulting carbon/silica composites were washed with 40 wt% HF solution to remove the silica, followed by filtration and drying. The obtained WMCs with and without adding HF during the sol–gel process were denoted as WMC7 (TEOS/HF ratio = 7) and WMC0, respectively.
2.2 Structure characterization
Raman spectra were conducted on a Renishaw inVia Laser Micro-Raman spectrometer. X-ray diffraction (XRD) patterns of the WMC samples were collected using a diffractometer equipped with a Cu Kα source by D/MAX 2200 VPC equipment. The microstructure of the WMCs was investigated by a transmission electron microscope (TEM, JEOL JEM-2010) and a Micromeritics ASAP 2010 analyzer at 77 K. The BET method was utilized to calculate the SBET using adsorption data in a relative pressure range from 0.05 to 0.21. The total pore volume (Vtotal) was estimated from the amount adsorbed at a relative pressure (P/P0) of 0.990. Density functional theory (DFT) was used to analyze the pore size distribution and cumulative pore volume.2.3 Electrochemical measurement
A composite comprising the WMCs, poly(vinylidene difluoride) and acetylene black (mass ratio of 8![[thin space (1/6-em)]](https://www.rsc.org/images/entities/char_2009.gif) :
:![[thin space (1/6-em)]](https://www.rsc.org/images/entities/char_2009.gif) 1
1![[thin space (1/6-em)]](https://www.rsc.org/images/entities/char_2009.gif) :
:![[thin space (1/6-em)]](https://www.rsc.org/images/entities/char_2009.gif) 1) was uniformly pressed onto the current collector of nickel foam or aluminum foil. After drying in vacuum at 120 °C for over 8 h, the electrode was used as the working electrode. The electrochemical performance was measured in both aqueous electrolyte of 6 M KOH and organic electrolyte of 1 M TEABF4/polypropylene carbonate (PC) using a sandwich-type coin EDLC. Galvanostatic charge–discharge (GCD) tests were performed at different current densities from 0.1 to 10 A g−1 using a Neware Battery Program-control Test System (CT30008W). Electrochemical impedance spectroscopy (EIS, excitation signal: 5 mV and frequency range: 0.001–100
1) was uniformly pressed onto the current collector of nickel foam or aluminum foil. After drying in vacuum at 120 °C for over 8 h, the electrode was used as the working electrode. The electrochemical performance was measured in both aqueous electrolyte of 6 M KOH and organic electrolyte of 1 M TEABF4/polypropylene carbonate (PC) using a sandwich-type coin EDLC. Galvanostatic charge–discharge (GCD) tests were performed at different current densities from 0.1 to 10 A g−1 using a Neware Battery Program-control Test System (CT30008W). Electrochemical impedance spectroscopy (EIS, excitation signal: 5 mV and frequency range: 0.001–100![[thin space (1/6-em)]](https://www.rsc.org/images/entities/char_2009.gif) 000 Hz) and cyclic voltammetry (CV) at a scan rate of 100 mV s−1 were carried out using a CHI660E electrochemical workstation with the same cell. The Cm (in F g−1) of the samples was calculated by the formula of
000 Hz) and cyclic voltammetry (CV) at a scan rate of 100 mV s−1 were carried out using a CHI660E electrochemical workstation with the same cell. The Cm (in F g−1) of the samples was calculated by the formula of  , where I was the discharge current; Δt was the discharge time; ΔU was the potential change in discharge; m1 and m2 were the mass of the positive and negative active electrode materials, respectively. At the same time, a commercial AC from Kuraray Chemical Co., Ltd. for supercapacitors was tested and served as a reference.
3. Results and discussion
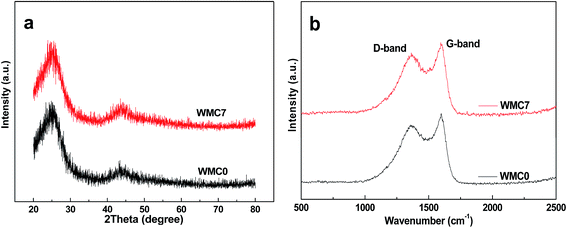
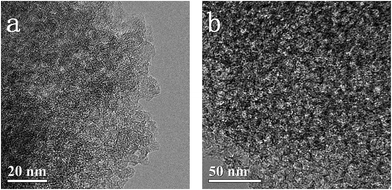
As shown in Fig. 1a, the XRD patterns of both the WMC samples exhibit two peaks around 24° and 44° (2θ), which correspond to the (002) and (101) diffraction of hexagonal graphite based on the JCPDS Card No. 04-0850, respectively. The relatively broader peaks and larger d-spacings between (002) planes (3.7 Å) in comparison to those of graphite (3.4 Å) imply a low graphitization degree of the WMCs.38 Meanwhile, two peaks around 1350 cm−1 (D-band) and 1590 cm−1 (G-band) of both WMC samples are clearly observed in the Raman spectra (Fig. 1b). The D-band is attributed to the disordered structures of carbon, and the G-band corresponds to an ideal graphitic lattice vibration mode with E2g symmetry.39 The relatively higher intensity ratio of D/G bands (ID/IG) confirms that the WMCs are amorphous carbons with a low graphitization degree.39Fig. 2 shows the TEM images of the WMC samples. Apparently, both samples show a continuous carbon framework with a number of interconnected mesopores. After adding HF, the mesopore size of WMC7 is obviously increased due to the catalyzed effect of F− in the gelation process of TEOS.37,40 In brief, with the existence of F−, the size of the resulting sol particles will increase correspondingly in order to overcome the repulsive effect of surface charges built up on the F−-containing particulate clusters. In consequence, the radial dimension of the silica framework in carbon/silica composite is increased, leading to a larger mesopore size of the WMC7 after template removing.
N2 adsorption–desorption isotherms were performed to confirm the developed mesoporous structure quantitatively (Fig. 3a). Both of the two WMC samples show obvious uptakes at the medium P/P0, implying that they are typical mesoporous materials.13 The uptake of WMC7 at relatively higher P/P0 in comparison to that of WMC0 suggests the larger mesopore size of WMC7. As calculated from the isotherms, the pore structure parameters, DFT pore size distributions and cumulative pore volume curves are shown in Table 1, Fig. 3b and S1, respectively. Obviously, WMC0 and WMC7 demonstrate a mesopore-dominant structure with a large mesopore proportion (Vmes%) of 75% and 85%, respectively (Fig. S1†). The mesopore of WMC0 centers at a small size of 3.1 nm, whereas that of WMC7 is increased to 8.6 nm (Fig. 3b), which is consistent with the TEM observation. The smaller mesopore size of 3.1 nm endows WMC0 with a much larger surface area of 1538 m2 g−1. For comparison, the commercial AC shows a micropore-dominant structure (Vmic% = 88%, Fig. S1†) with a micropore size of 1.3 nm and a surface area of 1471 m2 g−1.
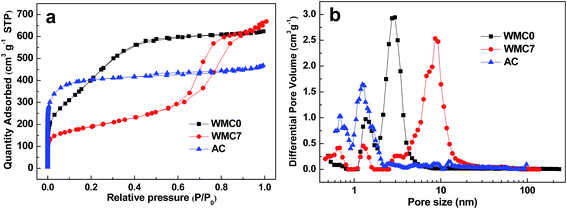 | ||
| Fig. 3 (a) N2 adsorption–desorption isotherms at 77 K and (b) DFT pore size distribution curves of the samples. | ||
| Sample | SBET (m2 g−1) | Vtotal (cm3 g−1) | Vmic% | Vmes% | Pore size (nm) |
|---|---|---|---|---|---|
| WMC0 | 1538 | 0.97 | 25% | 75% | 3.1 |
| WMC7 | 667 | 1.03 | 15% | 85% | 8.6 |
| AC | 1471 | 0.72 | 86% | 14% | 1.3 |
This kind of large surface area primarily contributed by small mesopores combining with the 3D interconnected mesoporous structure in WMC0 will be beneficial to donating a large ion-accessible surface area for both aqueous and organic electrolyte, and providing high efficient mass transfer pathways. Thus, GCD tests of the WMCs were carried out below in both KOH and TEABF4 electrolyte.
According to the discharge time of the GCD curves in Fig. 4a, WMC0 presents the largest Cm of 189 F g−1 in 6 M KOH. Although this value is at the medium level of the reported PCM-based electrode (50–350 F g−1),5–26 its corresponding Cm in organic electrolyte of TEABF4 is calculated to be 174 F g−1 (Fig. 4b), which is among the highest value of the other PCMs (20–200 F g−1).28–34,41–46 Generally, when TEABF4 is used to substitute aqueous electrolyte, the Cm would be reduced to a great extent of ca. 25–55% because the ion size of TEA+/BF4− (ca. 0.6 nm) and solvated TEA+/BF4− (ca. 1.2 nm) is much larger than that of aqueous electrolyte,29–34 leading to a sharp decrease of the ion-accessible surface area, e.g., a Cm-decreased extent of 25%,32 51% (ref. 30) and 55% (ref. 29) from aqueous to TEABF4 electrolyte. It is surprising that the Cm of WMC0 and WMC7 only presents a negligible decrease in TEABF4 (8% and 7%, respectively). In a sharp contrast, the commercial AC exhibits a large decreasing extent of 45% (from 172 to 95 F g−1) and this phenomenon becomes more and more serious while increasing the current density, since the solvated ion sizes of TEA+ and BF4− are comparable to the micropore size of AC. For example, at the extremely high current density of 10 A g−1, the capacitance retention (RC) of AC in KOH and TEABF4 is decreased to 69% and 9.5%, respectively (Fig. 4c and d), giving rise to a Cm decrease of 92%. In terms of WMC0 and WMC7, an RC of 85%/79% and 87%/83% (161 F g−1/137 F g−1 and 88 F g−1/78 F g−1) is obtained at 10 A g−1 in KOH/TEABF4, respectively, indicating a low Cm decrease extent of 12–15%. This is because the dominant pore size of WMC0 and WMC7 is almost 3 and 7 times larger than that of the solvated TEA+ and BF4−, respectively. These results demonstrate that the mesopore-dominant nanostructure and 3D interconnected mesopore morphology endow the WMC with excellent ion-accessibility of the surface area and efficient mass transfer capability, which can be confirmed by the CV measurements and EIS tests below.
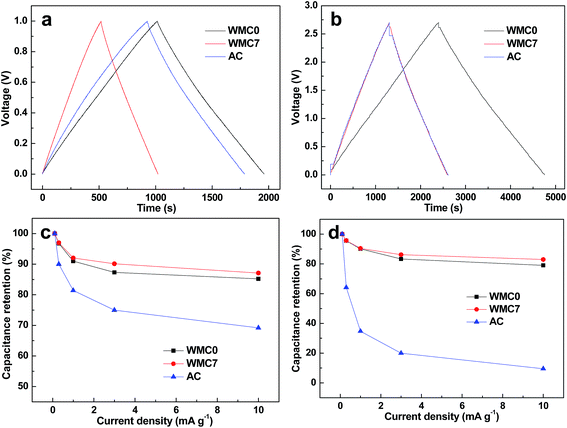 | ||
| Fig. 4 GCD curves of the samples at the current density of 0.1 A g−1 in (a) 6 M KOH and (b) 1 M TEABF4; capacitance retention at various current densities in (c) 6 M KOH and (d) 1 M TEABF4. | ||
As we know, the ion diffusion behaviors within a nanoporous carbon structure can be estimated by the rectangle degree of the CV curve at a relatively high scan rate.18 It can be obviously seen that the commercial AC shows a more distorted shape of the CV curve in TEABF4 as compared to that in KOH at 100 mV s−1 (Fig. 5a), implying the poor ion accessibility and transfer capability of the micropores in TEABF4. Fortunately, in Fig. 5b and c, the comparable rectangle degree of the CV curves in WMC samples implies that the increase of the ion size in TEABF4 has much smaller influence on the ion diffusion behavior. The Cm calculated from the CV curves is shown in Table 2, which demonstrates a similar decreasing extent in organic electrolyte as compared to that calculated from the GCD tests at a relatively high current density of 3 A g−1.
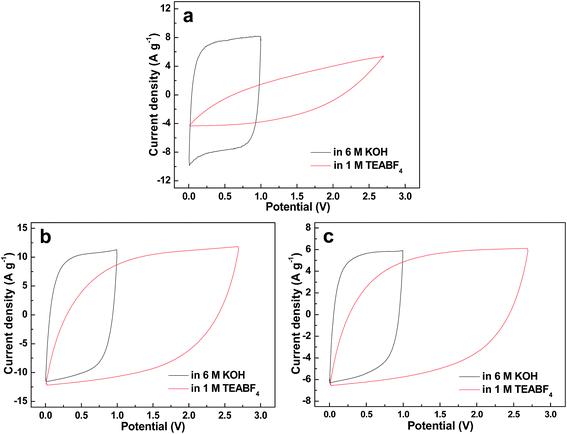 | ||
| Fig. 5 CV curves at the scan rate of 100 mV s−1 in 6 M KOH and 1 M TEABF4 of the (a) AC, (b) WMC0 and (c) WMC7. | ||
| Sample | Cm from GCD tests (F g−1) | Cm from CV tests (F g−1) | ||
|---|---|---|---|---|
| 6 M KOH | 1 M TEABF4 | 6 M KOH | 1 M TEABF4 | |
| WMC0 | 165 | 145 | 172 | 153 |
| WMC7 | 91 | 81 | 94 | 84 |
| AC | 129 | 28 | 138 | 43 |
The polarization resistance or charge transfer resistance (Rp/Rct) of WMC0 and WMC7 estimated from the diameter of the semicircle in the high frequency region in Nyquist plots is 2.2 and 1.9 Ω (Fig. 6a), respectively, which are much lower than that of AC (7.2 Ω). Furthermore, benefiting from the 3D carbon nanoskeleton, WMC0 and WMC7 show much lower equivalent series resistance of ca. 1.8 Ω compared with commercial AC (ca. 4.9 Ω), which can be obtained from the initial intersection between the curve and Z′ axis in Nyquist plots.19 To further demonstrate the applicability of these WMC samples in EDLC electrodes, cycling test results of 10![[thin space (1/6-em)]](https://www.rsc.org/images/entities/char_2009.gif) 000 cycles at 1 A g−1 are presented in Fig. 6b. Both WMC samples show great cycling stability with a RC of 97.7% after 10
000 cycles at 1 A g−1 are presented in Fig. 6b. Both WMC samples show great cycling stability with a RC of 97.7% after 10![[thin space (1/6-em)]](https://www.rsc.org/images/entities/char_2009.gif) 000 cycles, whereas the RC of the commercial AC is decreased to 78%.
000 cycles, whereas the RC of the commercial AC is decreased to 78%.
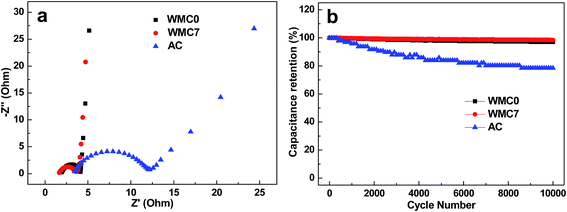 | ||
Fig. 6 (a) Nyquist plots and (b) cycling tests at the current density of 1 A g−1 in 1 M TEABF4 for 10![[thin space (1/6-em)]](https://www.rsc.org/images/entities/char_2009.gif) 000 cycles of the samples. 000 cycles of the samples. | ||
Overall, although a large surface area of the PCM-based electrode is considered necessary for energy storage, increasing the surface area unlimitedly may result in a sharp decrease of the pore size, thus reducing the utilization of the surface area greatly, particularly in organic electrolyte with larger ion sizes. Paradoxically, an excessively large pore size will undoubtedly lead to a relatively low surface area, such as WMC7 in this work. Thus, constructing a developed mesopore nanostructure and moderate pore size for obtaining a high surface area with ion-accessibility is believed to demonstrate the optimal supercapacitive behaviors.
4. Conclusions
WMC with mesopore-dominant structure is adopted as the electrode materials of EDLCs and demonstrates superior electrochemical performance, particularly in organic electrolyte. For example, the WMC0 sample presents a Cm of 189 F g−1 in 6 M KOH and 174 F g−1 in 1 M TEABF4, implying a slight Cm decrease of about 8%. Furthermore, a much more superior high-rate capability in TEABF4 is obtained for the WMC0 sample as compared to that of most PCMs. These excellent supercapacitive performances can be attributed to the combination effect of 3D continuous carbon framework, suitable mesopore size and interconnected mesopore-dominant structure. We anticipate that this study would be useful for the development of high performance supercapacitors and provide a benchmark for better designing PCMs with desired nanostructure for practical applications.Acknowledgements
This research is financially supported by The projects of NNSFC (51602061), The Start-up funding for Young talent of Guangdong University of technology (220413521), The scientific and technological project of Guangdong province, (502160192).References
- Q. Xie, G. Chen, R. Bao, Y. Zhang and S. Wu, Microporous Mesoporous Mater., 2017, 239, 130–137 CrossRef CAS.
- Z. Li, L. Li, Z. Li, H. Liao and H. Zhang, Electrochim. Acta, 2016, 222, 990–998 CrossRef CAS.
- W. Yang, W. Yang, F. Ding, L. Sang, Z. Ma and G. Shao, Carbon, 2017, 111, 419–427 CrossRef CAS.
- X. He, Z. Liu, H. Ma, N. Zhang, M. Yu and M. Wu, Microporous Mesoporous Mater., 2016, 236, 134–140 CrossRef CAS.
- N. Shcherban, S. Filonenko, P. Yaremov, V. Dyadyun, I. Bezverkhyy and V. Ilyin, J. Mater. Sci., 2017, 52, 1523–1533 CrossRef CAS.
- K. Huang, Y. Yao, X. Yang, Z. Chen and M. Li, Mater. Chem. Phys., 2016, 169, 1–5 CrossRef CAS.
- J. Wang and Q. Liu, RSC Adv., 2015, 5, 4396–4403 RSC.
- C. Li, X. Yang and G. Zhang, Mater. Lett., 2015, 161, 538–541 CrossRef CAS.
- J. Liu, X. Wang, J. Gao, Y. Zhang, Q. Lu and M. Liu, Electrochim. Acta, 2016, 211, 183–192 CrossRef CAS.
- L. Zhang, T. You, T. Zhou, X. Zhou and F. Xu, ACS Appl. Mater. Interfaces, 2016, 8, 13918–13925 CAS.
- G. Ma, F. Hua, K. Sun, Z. Zhang, E. Feng, H. Peng and Z. Lei, RSC Adv., 2016, 6, 103508–103516 RSC.
- A. Chen, Y. Yu, Y. Li, Y. Wang, Y. Li, S. Li and K. Xia, J. Mater. Sci., 2016, 51, 4601–4608 CrossRef CAS.
- Y. Liang, Z. Li, R. Fu and D. Wu, J. Mater. Chem. A, 2013, 1, 3768–3773 CAS.
- X. Yang, C. Li and Y. Chen, J. Phys. D: Appl. Phys., 2017, 50, 055501 CrossRef.
- R. R. Rajagopal, L. S. Aravinda, R. Rajarao, B. R. Bhat and V. Sahajwalla, Electrochim. Acta, 2016, 211, 488–498 CrossRef CAS.
- W. Lu, M. Liu, L. Miao, D. Zhu, X. Wang, H. Duan, Z. Wang, L. Li, Z. Xu, L. Gan and L. Chen, Electrochim. Acta, 2016, 205, 132–141 CrossRef CAS.
- Y. Liang, F. Liang, H. Zhong, Z. Li, R. Fu and D. Wu, J. Mater. Chem. A, 2013, 1, 7000–7005 CAS.
- F. Xu, R. Cai, Q. Zeng, C. Zou, D. Wu, F. Li, X. Lu, Y. Liang and R. Fu, J. Mater. Chem., 2011, 21, 1970–1976 RSC.
- Y. Zhao, W. Ran, J. He, Y. Song, C. Zhang, D.-B. Xiong, F. Gao, J. Wu and Y. Xia, ACS Appl. Mater. Interfaces, 2015, 7, 1132–1139 CAS.
- Y. Zhao, Z. Zhang, Y. Ren, W. Ran, X. Chen, J. Wu and F. Gao, J. Power Sources, 2015, 286, 1–9 CrossRef CAS.
- F. Xu, Z. Tang, S. Huang, L. Chen, Y. Liang, W. Mai, H. Zhong, R. Fu and D. Wu, Nat. Commun., 2015, 6, 7221 CrossRef PubMed.
- L. L. Zhang and X. S. Zhao, Chem. Soc. Rev., 2009, 38, 2520–2531 RSC.
- S. Bose, T. Kuila, A. K. Mishra, R. Rajasekar, N. H. Kim and J. H. Lee, J. Mater. Chem., 2012, 22, 767–784 RSC.
- A. Izadi-Najafabadi, S. Yasuda, K. Kobashi, T. Yamada, D. N. Futaba, H. Hatori, M. Yumura, S. Iijima and K. Hata, Adv. Mater., 2010, 22, E235–E241 CrossRef CAS PubMed.
- Shilpa and A. Sharma, RSC Adv., 2016, 6, 78528–78537 RSC.
- X. Yang, C. Li and R. Fu, J. Power Sources, 2016, 319, 66–72 CrossRef CAS.
- X. Yang, G. Zhang, M. Zhong, D. Wu and R. Fu, Langmuir, 2014, 30, 9183–9189 CrossRef CAS PubMed.
- J. Chmiola, C. Largeot, P.-L. Taberna, P. Simon and Y. Gogotsi, Angew. Chem., Int. Ed., 2008, 47, 3392–3395 CrossRef CAS PubMed.
- D. Wang, Y. Min and Y. Yu, J. Solid State Electrochem., 2015, 19, 577–584 CrossRef CAS.
- C. Zheng, X. Zhou, H. Cao, G. Wang and Z. Liu, J. Power Sources, 2014, 258, 290–296 CrossRef CAS.
- Y. Li, Z. Li and P. K. Shen, Adv. Mater., 2013, 25, 2474–2480 CrossRef CAS PubMed.
- J. A. Fernandez, M. Arulepp, J. Leis, F. Stoeckli and T. A. Centeno, Electrochim. Acta, 2008, 53, 7111–7116 CrossRef CAS.
- C. Ma, Y. Li, J. Shi, Y. Song and L. Liu, Chem. Eng. J., 2014, 249, 216–225 CrossRef CAS.
- J. Xu, Q. Gao, Y. Zhang, Y. Tan, W. Tian, L. Zhu and L. Jiang, Sci. Rep., 2014, 4, 5545 CAS.
- T. Chau and V. Kalra, J. Power Sources, 2013, 235, 289–296 CrossRef.
- L.-B. Xing, J.-L. Zhang, J. Zhang, S.-F. Hou, J. Zhou, W. Si, H. Cui and S. Zhuo, Electrochim. Acta, 2015, 176, 1288–1295 CrossRef CAS.
- D. Wu, Z. Li, Y. Liang, X. Yang, X. Zeng and R. Fu, Carbon, 2009, 47, 916–918 CrossRef CAS.
- X. Yang, C. Wei and G. Zhang, J. Mater. Sci., 2016, 51, 5565–5571 CrossRef CAS.
- Y. Zhao, M. Liu, X. Deng, L. Miao, P. K. Tripathi, X. Ma, D. Zhu, Z. Xu, Z. Hao and L. Gan, Electrochim. Acta, 2015, 153, 448–455 CrossRef CAS.
- E. J. A. Pope and J. D. Mackenzie, J. Non-Cryst. Solids, 1986, 87, 185–198 CrossRef CAS.
- G. Sun, W. Song, X. Liu, D. Long, W. Qiao and L. Ling, Electrochim. Acta, 2011, 56, 9248–9256 CrossRef CAS.
- H. Zhou, Y. Peng, H. B. Wu, F. Sun, H. Yu, F. Liu, Q. Xu and Y. Lu, Nano Energy, 2016, 21, 80–89 CrossRef CAS.
- D. Bhattacharjya, M.-S. Kim, T.-S. Bae and J.-S. Yu, J. Power Sources, 2013, 244, 799–805 CrossRef CAS.
- R. R. Salunkhe, C. Young, J. Tang, T. Takei, Y. Ide, N. Kobayashi and Y. Yamauchi, Chem. Commun., 2016, 52, 4764–4767 RSC.
- F. Markoulidis, C. Lei, C. Lekakou, D. Duff, S. Khalil, B. Martorana and I. Cannavaro, Carbon, 2014, 68, 58–66 CrossRef CAS.
- B. Li, F. Dai, Q. Xiao, L. Yang, J. Shen, C. Zhang and M. Cai, Energy Environ. Sci., 2016, 9, 102–106 CAS.
Footnote |
| † Electronic supplementary information (ESI) available. See DOI: 10.1039/c7ra00446j |
| This journal is © The Royal Society of Chemistry 2017 |

