
 Open Access Article
 This Open Access Article is licensed under a Creative Commons Attribution-Non Commercial 3.0 Unported Licence
Capacitive performance of amino acid ionic liquid electrolyte-based supercapacitors by molecular dynamics simulation†
Mingbing Wuabc,
Wei Liabc,
Song Li *abc and
Guang Fengac
*abc and
Guang Fengac
aState Key Laboratory of Coal Combustion, School of Energy and Power Engineering, Huazhong University of Science and Technology, 430074, China. E-mail: songli@hust.edu.cn
bShenzhen Research Institute of Huazhong University of Science and Technology, Shenzhen, 518057, China
cNano Interface Centre for Energy, School of Energy and Power Engineering, Huazhong University of Science and Technology, 430074, China
First published on 1st June 2017
Abstract
The performance of amino acid ionic liquid (AAIL) electrolytes in electrical double layers (EDLs) near planar graphene electrodes was investigated by classical molecular dynamics (MD) simulations in this work. Four types of AAILs, 1-ethyl-3-methylimidazolium glycine ([EMIM][GLY]), 1-ethyl-3-methylimidazolium serine ([EMIM][SER]), 1-ethyl-3-methylimidazolium valine ([EMIM][VAL]) and 1-ethyl-3-methylimidazolium phenylalanine ([EMIM][PHE]), with different amino acid anions were selected as electrolytes for supercapacitors. The number density profiles and ion orientation at varying surface charge densities were delineated to exploit the microstructure of EDLs for different AAILs. As a result, similar EDL structures of cations near a negative graphene electrode were observed, whereas the EDLs at positively charged electrodes displayed dependence on amino acid anions. AAILs composed of the common cation [EMIM]+ and dissimilar amino acid anions exhibit similar differential capacitance–electrical potential (C–V) curves and comparable capacitance to conventional ionic liquids.
Introduction
Supercapacitors or electrical double layer (EDL) capacitors have been employed in heavy electric vehicles and electronic devices1–3 as promising devices for highly efficient energy storage and power management, which can complement conventional batteries in a more sustainable future. The non-faradaic and reversible charge storage process of supercapacitors account for their numerous advantages, such as high power density, highly efficient charging and discharging, long cycle life and so on.4 Their further widespread applications, however, could be achieved by improving the energy density without compromising the other merits of supercapacitors. The stored energy density of supercapacitors, E, is calculated by
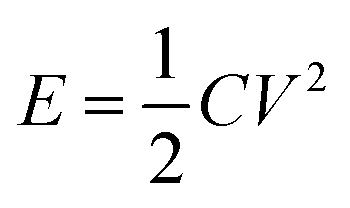 | (1) |
Room temperature ionic liquids (RTILs),5,6 molten salts composed entirely of ions but in the liquid state at ambient temperature, are widely investigated as working electrolytes in supercapacitors due to their wide electrochemical windows (up to 5–6 V), lower vapor pressure, and outstanding thermal stability.7–9 The interfacial structures and macroscopic properties of EDLs for RTILs near electrified surfaces have been widely investigated experimentally and theoretically. Mezger et al.10 reported a distinct ion layering of alternate cations and anions, which is a generic feature of RTILs at charged interfaces in high-energy X-ray reflectivity measurement. Such an observation was also confirmed in molecular dynamics simulations,11–13 which was attributed to the strong cation–anion correlations and the thickness of ion layering is about 1.5–3.0 nm. Kornyshev et al.14 and Oldham et al.15 proposed several elegant analytical models to describe the EDLs in ILs, in which the EDL was hypothesized to be composed of a compact inner layer and a diffusive outer layer, and the shape of curves between the differential capacitance and electrode potential (i.e. the C–V curve) were closely related to the compressibility factor γ of RTILs.14 Nevertheless, ecotoxicity,16 poor biodegradation17 and high production cost18 have been the main limitations of RTILs to be applied ulteriorly.
In recent years, a new type of RTILs consisting of amino acid-based cations19 or anions,20 which are not only non-toxic, biocompatible, biodegradable and have low production cost,21–23 but also retain typical advantages of RTILs, has attracted increasing research interest. Fukumoto et al.22 firstly reported a series of amino acid ionic liquids (AAILs) composed of imidazolium cations associated with 20 different natural amino acid anions, respectively, and measured their glass transition temperature, the ionic conductivity (in range of 10−9 to 10−4 S cm−1 at 25 °C depending on the type of amino acid anions) and the miscibility with organic solvents. Then, the density and surface tension of AAILs containing alkylimidazolium cations were widely investigated experimentally.24–26 Most of reported AAILs exhibit relatively high viscosity of several hundreds cP.27,28 Muhammad et al. reported four low viscous AAILs (i.e. [Emim][Gly], [Emim][Ala], [Emim][Ser] and [Emim][Pro]) whose viscosities were decreased by approximately one order of magnitude when the temperature increased from 293.15 K to 353.15 K,26 suggesting the potential application of AAILs at relatively high temperature. Meanwhile, the interest in AAILs has led to a series of theoretical studies for fully understanding their physicochemical properties. For instance, Herrera29 and Rao et al.30 investigated the formation of ion pairs and aggregates of [EMIM]-based AAILs using density functional theory (DFT) methods. Sirjoosingh et al.31 studied the liquid-state and transport properties of the 20 natural [EMIM]-based amino acid ionic liquids synthesized by Ohno and co-workers22 by molecular simulations. Kowsari et al.32 have studied the structure, dynamics and transport properties of the cation tetra-butylphosphonium based AAILs and the influence of anion structure on the dynamic behaviors and transport coefficients of AAILs by molecular dynamics (MD) simulations. Chaban et al.33,34 has developed a new non-polarizable force field for 15 types of AAILs comprised of [EMIM]+ and a variety of amino acid anions, which were then used for successful predictions of their structural and dynamical properties in MD simulations. Moreover, the viscosity of most [Emim]+-based AAILs was estimated to be lower than 10 cP at 500 K by MD simulations,33,34 which is highly favourable for the diverse applications of AAILs at high temperature.
So far, AAILs have been widely applied in various fields, including extraction agents, catalysts, CO2 adsorbents and so on.27,35–37 Due to their non-toxicity, environment-friendliness and low cost, the use of AAILs as electrolytes in energy storage devices such as supercapacitors is also winning research interests. The performance of AAILs as electrolytes in supercapacitors has not been reported until very recently. Moghadam et al.38 reported the dynamic properties of [EMIM][ALA] and [EMIM][ILE], and investigated the influence of the side chain length of amino acid anions on the EDL structure near graphene electrode in comparison to conventional [EMIM][PF6] by MD simulations. However, the capacitive performance of AAILs is still elusive, which requires systematic and detailed study of the capacitive performance of AAIL electrolytes in supercapacitors. Therefore, in this work, four representative AAILs, i.e. 1-ethyl-3-methylimidazolium ([EMIM]+) cation combined with four types of amino acid anions, namely glycine ([GLY]−), serine ([SER]−), valine ([VAL]−) and phenylalanine ([PHE]−) were chosen to explore the microstructure and capacitance of their EDLs formed at the interface of AAIL electrolytes and planar graphene electrodes by classical MD simulations. The main objective of the work is to reveal how amino acid anions with different sizes and side chains influence the capacitance of EDLs. This study will extend the available literature information on their capacitive performance of novel AAIL electrolytes in carbon electrode-based EDL capacitors.
Methodology
Four types of AAILs (i.e. [EMIM][GLY], [EMIM][SER], [EMIM][VAL], [EMIM][PHE]), enclosed between two oppositely charged electrodes, were applied as electrolytes as shown in Scheme 1. Each electrode consists of three layers of graphene with an inter-layer distance of 0.335 nm. The distance between the two electrodes was fixed at 8 nm, which is large enough to maintain a bulk-like behavior of AAILs in the channel center. The direction perpendicular to the plane of graphene was set as z dimension, and the position of z = 0 corresponds to the position of the first graphene layer closest to the electrolyte at the positive electrode. The total length of 33 nm in z-dimension of the simulation cell including vacuum is applied with a slab correction, which is much larger than 4.42 nm in x-dimension and 4.68 nm in y-dimension. Periodic boundary condition was only applied in the x–y plane beyond the simulation box. We performed 11 independent simulations by employing various amounts of charges to the atoms of the innermost graphene layer (the grey layer showed at Scheme 1) to produce a series of surface charge densities (σ) ranging from ±0.01 to ±0.18 C m−2. The force field parameters of [EMIM][AA] were taken from Chaban33 and the Lennard-Jones parameters for electrode atoms (carbon) were taken from Borodin.39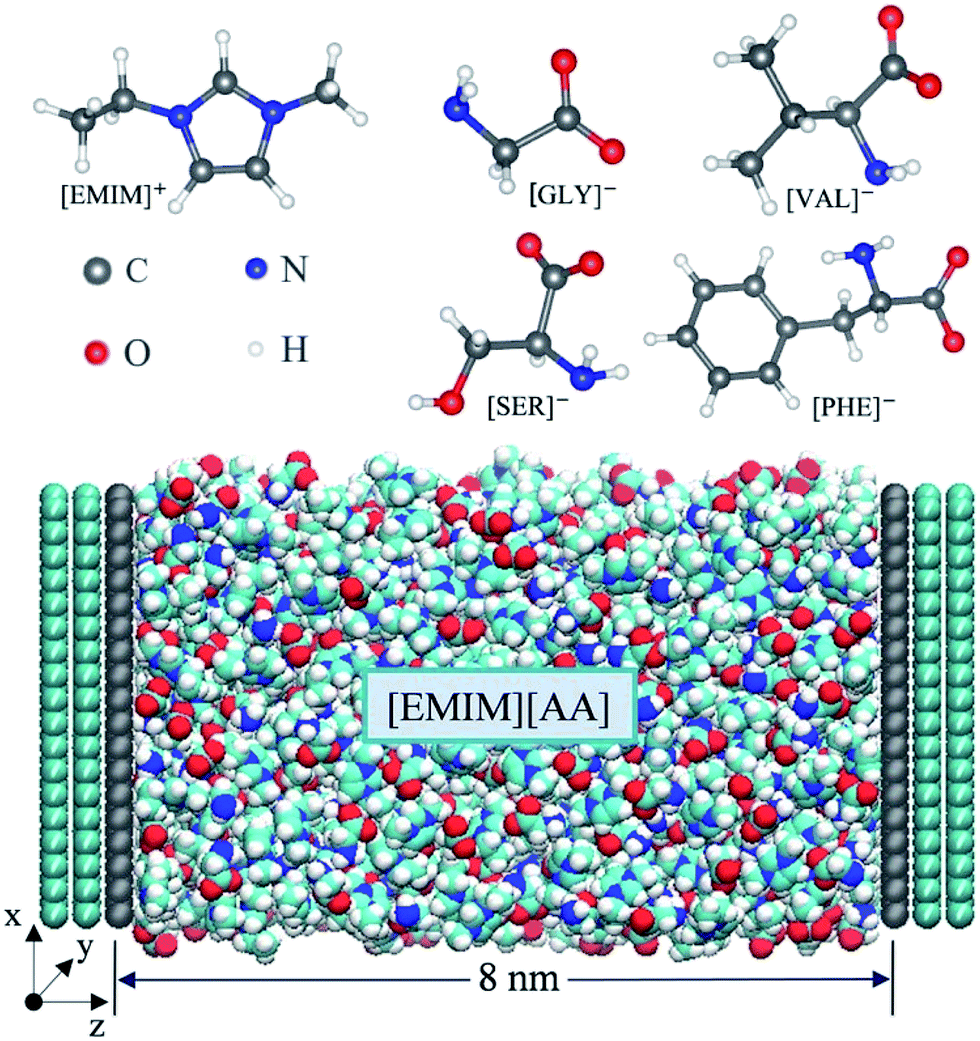 | ||
| Scheme 1 All-atom structures of the cation [EMIM]+ and amino acid anions, and the supercapacitor model consisting of AAIL electrolytes ([EMIM][AA]) and graphene electrode in MD simulations shown below. | ||
All simulation were performed in the NVT ensemble using a customized MD code based on Gromacs 4.6 (ref. 40) package. The constant temperature of 500 K was applied due to the viscous properties of a majority of AAILs.31 The target temperature in each system was maintained by the Bussi–Donadio–Parrinello velocity-rescaling thermostat41 with a time constant of 0.5 ps. The electrostatic interactions were computed directly by Coulomb law up to 1.3 nm between the interaction sites, beyond which were more accurately treated by PME method.42 The time step of 2.0 fs, which is reasonable due to the constraints imposed on the C–H covalent bonds, was used to integrate the equation of motion. Before starting the simulations, the density of each AAIL located at the center of the two electrodes (i.e. bulk-like region) was adjusted to match its own bulk density with a deviation within 0.5%. Finally, 535, 480, 400 and 350 ion pairs are contained in the systems of [EMIM][GLY], [EMIM][SER], [EMIM][VAL] and [EMIM][PHE], respectively. 5 ns simulated annealing was applied to each system. Specifically, each system temperature was gradually increased from initial 500 K to 1000 K and the gradually reduced to the final 500 K, which is followed by a 5 ns equilibration run and a 10 ns production run. The electrical potential drop (V) across EDLs was calculated according to Poisson equation using the space charge density profile obtained from MD simulations as reported previously.43 The differential capacitance–electrical potential (C–V) curve is obtained by fitting the surface charge density versus electric potential using the fifth order polynomials.
Results and discussion
Fig. 1 shows the number density profile of cations and anions in the four types of [EMIM]-based AAILs at neutral graphene electrode.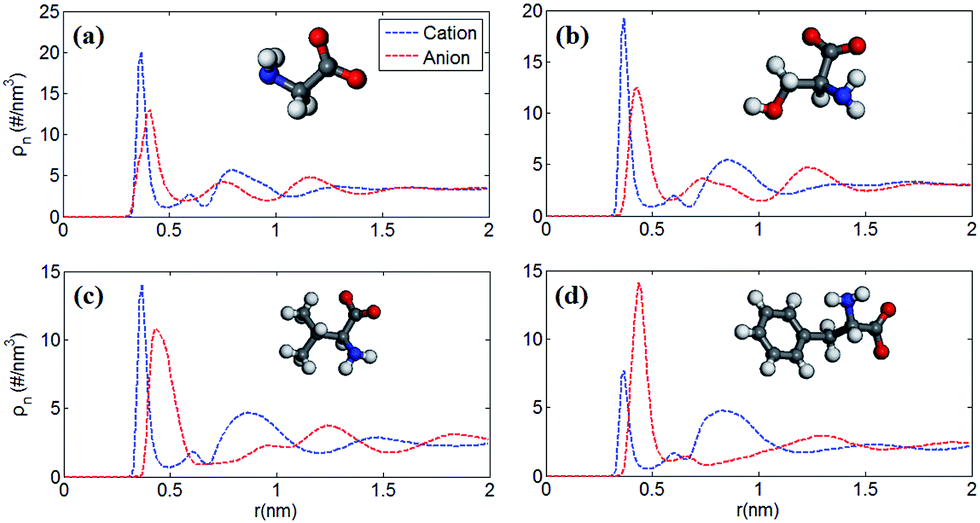 | ||
| Fig. 1 Number density profiles of cations and anions of (a) [EMIM][GLY] (b) [EMIM][SER] (c) [EMIM][VAL] and (d) [EMIM][PHE] as a function of distance r towards the surface of neutral graphene electrode at 500 K. The corresponding structures of anions were displayed in each panel and the cation [EMIM]+ was omitted. Dashed blue and dot-dashed red lines represent the number density profiles of cations and anions, respectively. | ||
Throughout this paper, the location of cations and anions are computed on the basis of the mass center of the entire cation and anion, respectively. From Fig. 1, it was observed that the cation [EMIM]+ tends to be more adsorptive onto the neutral electrodes compared with amino acid anions, as the cations located closer to the electrode surface than the anions due to the strong π–π interaction between the imidazolium-based cations and graphene surface.44 Nevertheless, Fig. 1a displays the almost identical locations of [EMIM]+ and [GLY]− near electrode surface. It was also noted that, the density peak of anions of [EMIM][PHE] is higher than that of cations, which may be attributed to the additional π–π interaction between the benzene ring of [PHE]− and the graphene electrode45 except the π–π interaction between [EMIM]+ and graphene. The co-effect of π–π interaction between [PHE]− and graphene plus the cation–anion interaction gives rise to more anions accumulated near the first cation layer.
Fig. 2 shows the number density profiles of cation ([EMIM]+) near negative electrodes and the number density profiles of anions ([GLY]−, [SER]−, [VAL]− and [PHE]−) near positive electrodes with the surface charge density (σ) of ±0.10 C m−2. It was observed that the number density profiles of the cation ([EMIM]+) in four AAILs are independent of the anion type, which exhibit similar shape and peak locations. It seems that different sizes of amino acid anions impose little effects on the distribution of the cations near negatively charged electrodes. In addition, comparing Fig. 1a with 2a, the number density profile of [EMIM]+ is obviously increased once charged (σ = −0.10 C m−2) and the first layer near electrodes transits from single peak to two peaks, which is related to the variation in the orientation of the imidazole ring of [EMIM]+ and will be illustrated in detail later. As for Fig. 1b, there are apparently increasing number densities for the four types of anions due to the enhanced coulombic interaction once the electrode surface is positively charged (σ = +0.10 C m−2). Similarly, the first layer in number density profiles of [PHE]− transits from one peak to two peaks as the electrode is positively charged. The specific molecular structure of [PHE]− and its charge distribution (neutral benzene and a negatively charged tail containing COO− group) probably can explain such a phenomenon. The charged COO− group instead of neutral benzene group of [PHE]− approached closer towards the electrodes once positively charged due to the increased coulombic interaction. Since the center of mass of [PHE]− is mainly located at the benzene ring, thus, when the benzene ring was pushed away from the positively charged electrode surface, the mass center of [PHE]− gradually shifted from the first peak towards the second as well.
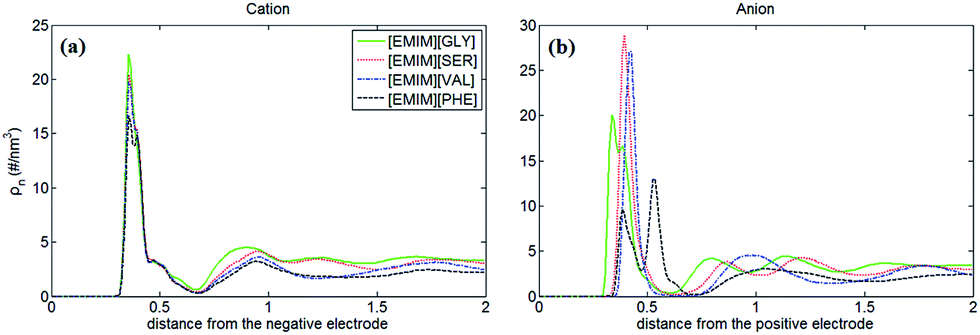 | ||
| Fig. 2 Number density profiles of cation ([EMIM]+) near negative electrodes with the surface charge density of −0.10 C m−2 (a) and the number density profiles of anions ([GLY]−, [SER]−, [VAL]− and [PHE]−) near positive electrodes (b) with the surface charge density of +0.10 C m−2. Green solid, red dot, blue dot-dashed and black dashed lines represent [EMIM][GLY], [EMIM][SER], [EMIM][VAL] and [EMIM][PHE], respectively. | ||
Furthermore, to verify our assumption, we computed the number density profiles of the COO− group and benzene ring of [PHE]−, respectively as shown in Fig. 3. Clearly, in the case of neutral electrodes, the benzene ring is closer to the electrodes compared with the COO− group due to the dominated π–π interaction between benzene ring and graphene. In Fig. 3b, however, when the electrodes is positively charged, the location of the charged COO− group moves closer to the electrodes since the coulombic force dominates with the increased surface charge density.
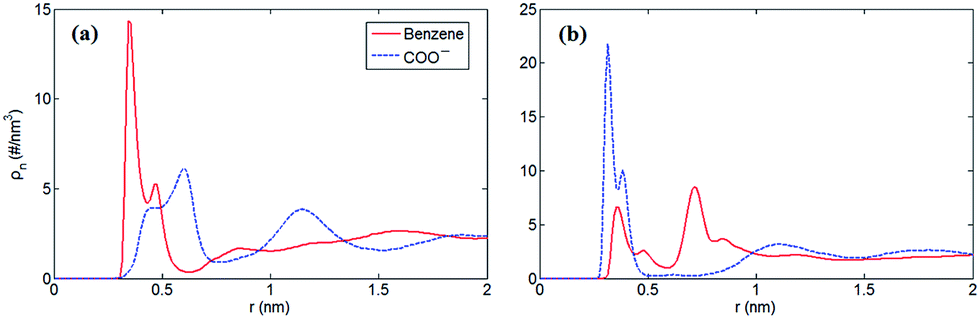 | ||
| Fig. 3 Number density profiles of benzene ring and the COO− group in [EMIM][PHE] as a function of distance towards electrode surface. The number density calculation is based mass center of ions at σ = 0.00 C m−2 (a) and σ = 0.10 C m−2 (b), respectively. | ||
In order to find out how ion orientation changes when electrode surface is charged, we analyzed orientation distribution of cations and anions of [EMIM][PHE] as shown in Fig. 4. Near the neutral electrodes, both [EMIM]+ and [PHE]− align nearly parallel to the electrodes, which is mainly because of the π–π interactions of imidazolium ring, benzene ring and graphene, resulting in parallel [EMIM]+ and [PHE]− near the electrodes. For [EMIM]+, the plane of imidazolium ring tends to be perpendicular with the electrodes surface, similar behavior of [EMIM]+ in the rest three types of AAILs was also observed in Fig. S1 of the ESI.† Simultaneously, a shift of cation center of mass away from electrode surface presented in number density profiles of cations takes place due to the orientation variation of imidazolium ring as shown in Fig. S2–S5.† This phenomenon is ascribed to the overscreening effect1,46,47 causing the rearrangement of the cations distributed in EDLs in order to counterbalance the increased charges on electrode surface. For [PHE]−, the benzene ring aligns parallel with neutral electrode surface and turns into tilting state as surface charge density increased, which can be explained by the flip-flop of [PHE]− when the electrode becomes positively charge as discussed in Fig. 3.
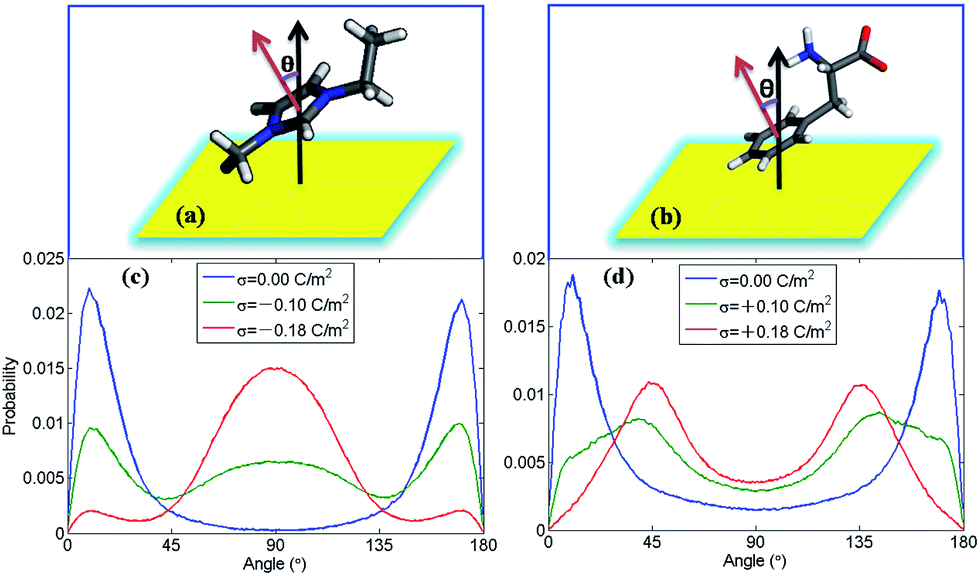 | ||
| Fig. 4 Orientation distribution probability of cations and anions of [EMIM][PHE]in the first adsorbed layer on electrodes. The angle is formed between the normal vector of the electrode and the normal vector of imidazolium ring of [EMIM]+ (a) or the benzene ring of [PHE]− (b). As shown in (a) and (b), the black and red arrows are the normal vectors to the electrodes (yellow) and the plane of imidazolium, respectively. The inclined angle θ is computed. Orientations distribution probability of imidazolium ring of [EMIM]+ (c) at negatively charged electrode and benzene ring of [PHE]− (d) at positively charged electrode in the first ion layer (i.e. the region calculated from the beginning of the corresponding number density profiles to the end of the first peak) of [EMIM][PHE] at a series of surface charge densities (σ), respectively. | ||
PZC obtained from EDLs near electrodes provides a baseline for describing EDLs near polarized electrodes. In this work, the PZCs of [EMIM][GLY], [EMIM][SER], [EMIM][VAL] and [EMIM][PHE]-based supercapacitors are 0.486 V, 0.475 V, 0.482 V and 0.433 V, respectively, indicating the adsorption affinity of graphene electrode towards [EMIM]+ is in the following order: [EMIM][GLY] > [EMIM][VAL] > [EMIM][SER] > [EMIM][PHE]. It was also observed that the surface charge density is approximately linearly increases with the potential drop at negatively charged electrode, and at positive potential, the variation in surface charge density becomes steeper. It is noticeable that there is no apparent difference in σ–V curves for all AAILs, implicating the nearly identical C–V curves as presented in Fig. 5b. To a certain extent, it is beyond our expectation that the four AAILs exhibit similar C–V curves, since the relative size ratios of cation/anion can significantly influence the shape of C–V curves according to the studies of Fedorov46 and Lockett et al.48 The smaller the anion is relative to the cation, the higher the capacitance is at positive potentials. In this study, four AAILs have identical cations but different sized anions, the capacitance of EDLs at positive potential, which is assumed to be dominated by anion size according to Lauw et al.,49 however, exhibits no dependence on the anion size. Therefore, Lauw's theory may be mainly validated for symmetrical ions with their charges center located in the geometrical centers. For unsymmetrical ions, most of their charge is distributed at one end instead of their geometry centers, thereby their C–V curves do not depend on the ion size. Additionally, the higher capacitance at positive potential than at negative potential suggests the more efficient packing of anions in EDLs of AAILs.
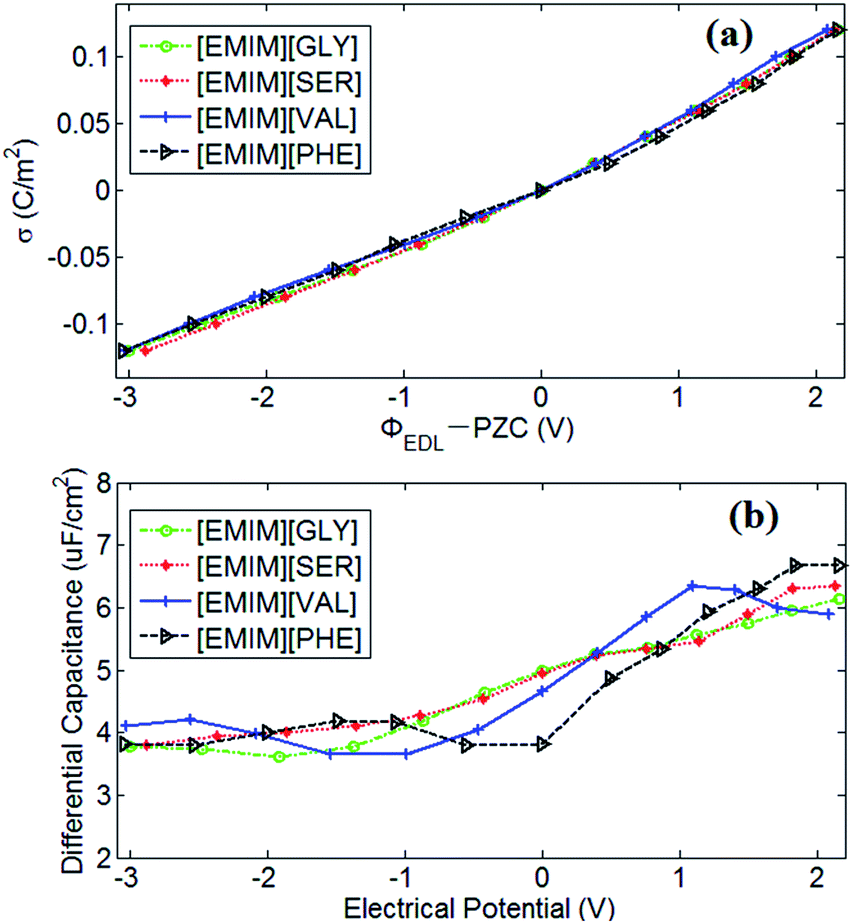 | ||
| Fig. 5 (a) The electrode surface charge density (σ) vs. the electrical potential drop (V) across EDLs with respect to the PZC at the interface of AAILs and graphene electrodes; (b) the EDL differential capacitance (C), Cdiff = dσ/d(ΦEDL − PZC), vs. the electrical potential drop (V) across the EDL with respect to the PZC. The circle (green), star (red), plus (blue) and triangle lines represent the AAILs of [EMIM][GLY], [EMIM][SER], [EMIM][VAL] and [EMIM][PHE], respectively. | ||
To better understand anion-size independent C–V curves of four AAILs-based EDLs, the number of co-ions and counter-ions accumulated in EDLs of the four types of AAILs were calculated and presented in Fig. 6. The number of cations accumulated in EDLs for all of the AAILs at neutral electrode is in the following order: [EMIM][GLY](∼60) > [EMIM][SER](∼55) > [EMIM][VAL](∼46) > [EMIM][PHE](∼44), similar to the trend in the anion number of EDLs. Such an order is mainly dominated by anion sizes, i.e. within the limited EDL space, the smaller the anion is, the more anions can be packed, thus requiring more cations for compensation. Additionally, for net charges, we can see that the positively charged electrodes exhibit more significant variation as a functional of surface charge density than that at the negatively charged electrodes for all AAILs, implicating the higher capacitance at positive potentials than that at negative ones, in accordance with the shape of C–V curves observed in Fig. 5b.
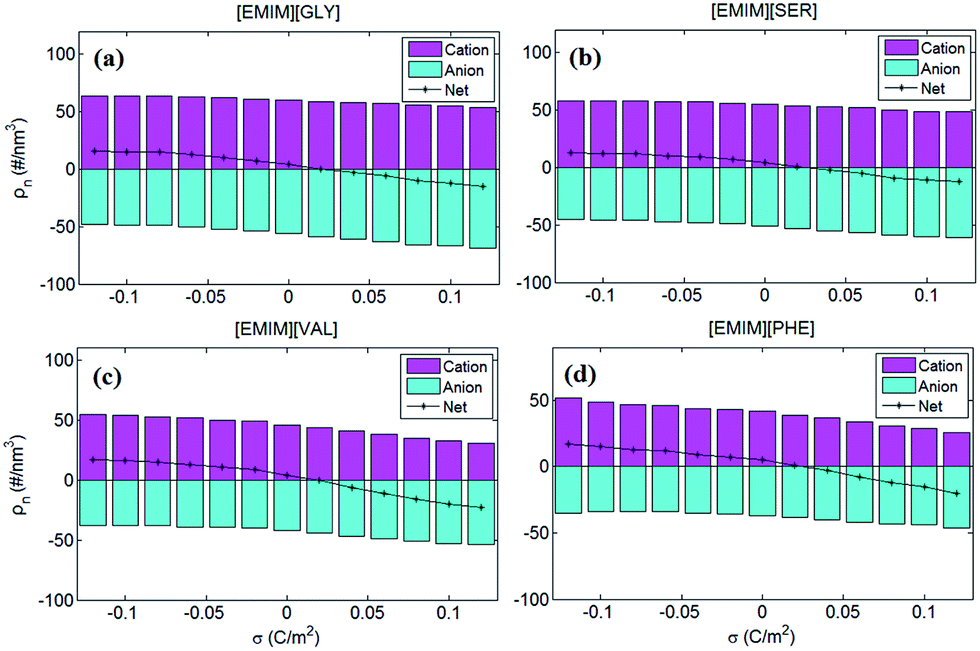 | ||
| Fig. 6 The number of cations anions of the four AAILs [EMIM][GLY], [EMIM][SER], [EMIM][VAL] and [EMIM][PHE] accumulated in EDLs. The magenta and cyan bars represent the number of cations and anions in EDLs, respectively. The value of cation and anion numbers was set to be positive and negative, respectively, in order to better interpret the variation of capacitance in Fig. 5. The black line represents the net ion number by summing up the total charges of cations and those of anions. | ||
In comparison with other conventional RTILs-based supercapacitors, the capacitance value of AAILs-based supercapacitors ranges from 3.65 to 6.67 μF cm−2 as the electrode potential drop across EDL ranges from −3.0 to 2.1 V, which is a considerable value compared with other representative conventional RTIL electrolytes. Silva et al.50 reported the experimentally measured capacitance of EDLs formed between [BMIM][PF6] and glass carbon at 293 K, which ranges from 11.6 to 16.4 μF cm−2 when the electrode potential drop across EDL range from −1.2 to 1.6 V. Similarly, Lockett et al.51 obtained the capacitance of 2.9–8.1 μF cm−2 for [BMIM][PF6] between −2.3 to 2.3 V by adopting the same electrode with a Ag/AgPF6 as reference electrode at 300 K. Vatamanu et al.52 computed the C–V curves of supercapacitors consisting of [EMIM][FSI] electrolyte and planar graphite electrode by MD simulation at 393 K. The obtained capacitance value of 4.3–6.1 μF cm−2 was observed for planar electrode without surface roughness and 3.4–9.6 μF cm−2 for graphite electrode with roughness at the potential range of −2.5–2.5 V. Our previous work also reported the capacitance of [EMIM][Tf2N] electrolyte near onion-like carbon electrode is between 4.9 and 9.4 μF cm−2 at the potential range of −2.5 V to 1.8 V.53 Thereby, AAILs can be promising electrolytes of supercapacitors with non-toxicity, biocompatibility, biodegradability, low production cost as well as comparable energy density compared with conventional RTILs.
Conclusions
In this work, MD simulations of supercapacitors with four types of AAILs ([EMIM][GLY], [EMIM][SER], [EMIM][VAL] and [EMIM][PHE]) as electrolytes were performed, respectively, to explore the interfacial structure and capacitive performance of EDLs near planar carbon electrodes. It was found that AAILs-based supercapacitors exhibit comparable capacitance with other ILs-based ones and can work at high-temperature, which is 500 K in this work. It is worthwhile to note that the anion-size independent C–V curve was observed for AAILs-based supercapacitors for the first time, which is a valuable supplement to previous reports. The four types of AAILs-based capacitors exhibit similar C–V curves regardless of anion size or the side chains, which was attributed to the geometrically heterogeneous distribution of anion charges mainly located at COO− group in our study. Thus, the other AAILs-based supercapacitors which are not involved in this work are expected to exhibit similar C–V curves considering the common feature in the chemical structure of amino acids, which requires further verification in future work. It should be noted that although this study provides a theoretical prediction towards the performance of the AAILs-based supercapacitors, it will be helpful to invite further experimental investigations to explore the role of AAIL electrolytes in energy storage devices.Acknowledgements
This work was supported by the National Natural Science Foundation of China (Grant No. 51606081 and 51406060), Basic Research Foundation of Shenzhen and the Fundamental Research Funds for the Central Universities (2016YXZD006). This work was carried out at the National Supercomputer Center in Tianjin, and the calculations were performed on TianHe-1 (A).References
- M. Z. Bazant, B. D. Storey and A. A. Kornyshev, Phys. Rev. Lett., 2011, 106, 046102 CrossRef PubMed.
- J. R. Miller and P. Simon, Science, 2008, 321, 651–652 CrossRef CAS PubMed.
- M. F. El-Kady, M. Ihns, M. Li, J. Y. Hwang, M. F. Mousavi, L. Chaney, A. T. Lech and R. B. Kaner, Proc. Natl. Acad. Sci. U. S. A., 2015, 112, 4233–4238 CrossRef CAS PubMed.
- P. Simon and Y. Gogotsi, Acc. Chem. Res., 2013, 46, 1094–1103 CrossRef CAS PubMed.
- P. Wasserscheid and T. Welton, in Ionic Liquids in Synthesis, Wiley-VCH Verlag GmbH & Co. KGaA, 2003, pp. 348–355 Search PubMed.
- H. Ohno, M. Yoshizawa and T. Mizumo, in Electrochemical Aspects of Ionic Liquids, John Wiley & Sons, Inc., 2005, pp. 75–81 Search PubMed.
- A. Balducci, R. Dugas, P. L. Taberna, P. Simon, D. Plée, M. Mastragostino and S. Passerini, J. Power Sources, 2007, 165, 922–927 CrossRef CAS.
- C. Liu, Z. Yu, D. Neff, A. Zhamu and B. Z. Jang, Nano Lett., 2010, 10, 4863–4868 CrossRef CAS PubMed.
- T. Y. Kim, H. W. Lee, M. Stoller, D. R. Dreyer, C. W. Bielawski, R. S. Ruoff and K. S. Suh, ACS Nano, 2011, 5, 436–442 CrossRef CAS PubMed.
- M. Mezger, H. Schröder, H. Reichert, S. Schramm, J. S. Okasinski, S. Schöder, V. Honkimäki, M. Deutsch, B. M. Ocko, J. Ralston, M. Rohwerder, M. Stratmann and H. Dosch, Science, 2008, 322, 424 CrossRef CAS PubMed.
- S. Wang, S. Li, Z. Cao and T. Yan, J. Phys. Chem. C, 2010, 114, 990–995 CAS.
- J. Vatamanu, O. Borodin and G. D. Smith, J. Am. Chem. Soc., 2010, 132, 14825–14833 CrossRef CAS PubMed.
- J. Vatamanu, L. Cao, O. Borodin, D. Bedrov and G. D. Smith, J. Phys. Chem. Lett., 2011, 2, 2267–2272 CrossRef CAS.
- A. A. Kornyshev, J. Phys. Chem. B, 2007, 111, 5545–5557 CrossRef CAS PubMed.
- K. B. Oldham, J. Electroanal. Chem., 2008, 613, 131–138 CrossRef CAS.
- S. P. M. Ventura, A. M. M. Gonçalves, T. Sintra, J. L. Pereira, F. Gonçalves and J. A. P. Coutinho, Ecotoxicology, 2013, 22, 1–12 CrossRef CAS PubMed.
- D. Coleman and N. Gathergood, Chem. Soc. Rev., 2010, 39, 600–637 RSC.
- L. Chen, M. Sharifzadeh, N. Mac Dowell, T. Welton, N. Shah and J. P. Hallett, Green Chem., 2014, 16, 3098–3106 RSC.
- G. H. Tao, L. He, N. Sun and Y. Kou, Chem. Commun., 2005, 3562–3564 RSC.
- Y. Fukaya, Y. Iizuka, K. Sekikawa and H. Ohno, Green Chem., 2007, 9, 1155–1157 RSC.
- M. Taha, M. R. Almeida, F. A. e. Silva, P. Domingues, S. P. M. Ventura, J. A. P. Coutinho and M. G. Freire, Chem.–Eur. J., 2015, 21, 4781–4788 CrossRef CAS PubMed.
- K. Fukumoto, M. Yoshizawa and H. Ohno, J. Am. Chem. Soc., 2005, 127, 2398–2399 CrossRef CAS PubMed.
- H. Ohno and K. Fukumoto, Acc. Chem. Res., 2007, 40, 1122–1129 CrossRef CAS PubMed.
- J.-Z. Yang, Q.-G. Zhang, B. Wang and J. Tong, J. Phys. Chem. B, 2006, 110, 22521–22524 CrossRef CAS PubMed.
- W. Guan, J. Tong, S.-P. Chen, Q.-S. Liu and S.-L. Gao, J. Chem. Eng. Data, 2010, 55, 4075–4079 CrossRef CAS.
- N. Muhammad, Z. B. Man, M. A. Bustam, M. I. A. Mutalib, C. D. Wilfred and S. Rafiq, J. Chem. Eng. Data, 2011, 56, 3157–3162 CrossRef CAS.
- G.-h. Tao, L. He, W.-s. Liu, L. Xu, W. Xiong, T. Wang and Y. Kou, Green Chem., 2006, 8, 639–646 RSC.
- L. He, G. H. Tao, D. A. Parrish and J. M. Shreeve, J. Phys. Chem. B, 2009, 113, 15162–15169 CrossRef CAS PubMed.
- C. Herrera, R. Alcalde, M. Atilhan and S. Aparicio, J. Phys. Chem. C, 2014, 118, 9741–9757 CAS.
- S. S. Rao and S. P. Gejji, Comput. Theor. Chem., 2015, 1057, 24–38 CrossRef CAS.
- A. Sirjoosingh, S. Alavi and T. K. Woo, J. Phys. Chem. B, 2009, 113, 8103–8113 CrossRef CAS PubMed.
- M. H. Kowsari, S. Alavi, B. Najafi, K. Gholizadeh, E. Dehghanpisheh and F. Ranjbar, Phys. Chem. Chem. Phys., 2011, 13, 8826–8837 RSC.
- E. E. Fileti and V. V. Chaban, Chem. Phys. Lett., 2014, 616–617, 205–211 CrossRef CAS.
- E. E. Fileti and V. V. Chaban, Chem. Phys. Lett., 2015, 633, 132–138 CrossRef CAS.
- F. Tang, Q. Zhang, D. Ren, Z. Nie, Q. Liu and S. Yao, J. Chromatogr. A, 2010, 1217, 4669–4674 CrossRef CAS PubMed.
- J. L. McDonald, R. E. Sykora, P. Hixon, A. Mirjafari and J. H. Davis, Environ. Chem. Lett., 2014, 12, 201–208 CrossRef CAS.
- Y. S. Sistla and A. Khanna, Chem. Eng. J., 2015, 273, 268–276 CrossRef CAS.
- B. Sadeghi Moghadam, M. Razmkhah, M. T. Hamed Mosavian and F. Moosavi, Phys. Chem. Chem. Phys., 2016, 18, 33053–33067 RSC.
- O. Borodin, J. Phys. Chem. B, 2009, 113, 11463–11478 CrossRef CAS PubMed.
- B. Hess, C. Kutzner, D. van der Spoel and E. Lindahl, J. Chem. Theory Comput., 2008, 4, 435–447 CrossRef CAS PubMed.
- G. Bussi, D. Donadio and M. Parrinello, J. Chem. Phys., 2007, 126, 014101 CrossRef PubMed.
- I.-C. Yeh and M. L. Berkowitz, J. Chem. Phys., 1999, 111, 3155–3162 CrossRef CAS.
- G. Feng, J. S. Zhang and R. Qiao, J. Phys. Chem. C, 2009, 113, 4549–4559 CAS.
- M. Vijayakumar, B. Schwenzer, V. Shutthanandan, J. Hu, J. Liu and I. A. Aksay, Nano Energy, 2014, 3, 152–158 CrossRef CAS.
- J. Björk, F. Hanke, C.-A. Palma, P. Samori, M. Cecchini and M. Persson, J. Phys. Chem. Lett., 2010, 1, 3407–3412 CrossRef.
- M. V. Fedorov and A. A. Kornyshev, J. Phys. Chem. B, 2008, 112, 11868–11872 CrossRef CAS PubMed.
- M. V. Fedorov and A. A. Kornyshev, Electrochim. Acta, 2008, 53, 6835–6840 CrossRef CAS.
- V. Lockett, R. Sedev, J. Ralston, M. Horne and T. Rodopoulos, J. Phys. Chem. C, 2008, 112, 7486–7495 CAS.
- Y. Lauw, M. D. Horne, T. Rodopoulos, A. Nelson and F. A. M. Leermakers, J. Phys. Chem. B, 2010, 114, 11149–11154 CrossRef CAS PubMed.
- F. Silva, C. Gomes, M. Figueiredo, R. Costa, A. Martins and C. M. Pereira, J. Electroanal. Chem., 2008, 622, 153–160 CrossRef CAS.
- V. Lockett, M. Horne, R. Sedev, T. Rodopoulos and J. Ralston, Phys. Chem. Chem. Phys., 2010, 12, 12499–12512 RSC.
- J. Vatamanu, O. Borodin, D. Bedrov and G. D. Smith, J. Phys. Chem. C, 2012, 116, 7940–7951 CAS.
- G. Feng, D. E. Jiang and P. T. Cummings, J. Chem. Theory Comput., 2012, 8, 1058–1063 CrossRef CAS PubMed.
Footnote |
| † Electronic supplementary information (ESI) available. See DOI: 10.1039/c7ra00443e |
| This journal is © The Royal Society of Chemistry 2017 |