
 Open Access Article
 This Open Access Article is licensed under a
 Creative Commons Attribution 3.0 Unported Licence
Biocompatibility assay of cellular behavior inside a leaf-inspired biomimetic microdevice at the single-cell level†
Wenming Wua and
Andreas Manz *bc
*bc
aThe State Key Laboratory of Applied Optics, Changchun Institute of Optics, Fine Mechanics and Physics, Chinese Academy of Sciences, Changchun, 130033, China
bUniversity of Saarland, Germany
cKorea Institute of Science and Technology Europe, Germany
First published on 27th June 2017
Abstract
Herein, we introduce a practical and effective manufacturing methodology for a biomimetic microdevice replicated from the Tilia platyphyllos leaf. With this method, artificial microchambers (of controllable dimension and depth) can be easily integrated into leaf-inspired whole-ordered venation patterns. To display the biocompatibility of this microdevice, we applied it to a long-term (seven days) cell culture and monitored the results. Based on a comprehensive biophysical analysis, including covering cellular deformation, cell migration, cytomembrane tension, extracellular communication, protonema formation, microvilli, and the tethers' dynamic of human melanoma cells inside the device at a single-cell resolution, we were able to verify for the first time a leaf-inspired PDMS microdevice as a biocompatible platform for mammal cell culture, showing promise that such a biomimetic device could be further applied for organ-on-a-chip studies and other biomedical research.
Ever since we first introduced the “micro total analysis system” (also termed as the “microfluidic system” or “lab on a chip”) in 1990,1 it has exhibited outstanding advantages in a wide range of areas, such as chemical sensing,2 polymerase chain reaction,3,4 drug discovery,5,6 biophysical study,7 and nanotechnology,8 etc. The great potential of microfluidics in modeling the functional microenvironment equivalents for various pathophysiological assays has also aroused tremendous attention from modern academia. The metabolism of all in vivo organs are sustained with continuous nutrients, signaling factors, and waste exchange by highly branched vessels that mainly consist of micrometer-scaled capillary microvascular transport networks. Similarly, microfluidics in studies mostly concerns micrometer-scaled channels, and thus can become an ideal platform for remodeling recirculation-based capillary networks for functional microenvironment equivalents and further for pathophysiological assays. Based on this concept, the utilization of microfluidics for recirculation-based organ-functionality, e.g., the so-called “organ-on-a-chip” system, has been successfully established over the last few years.9–12 In contrast with traditional cellular assay techniques, such as the Boyden chamber assays and the Dunn chamber assays,13 microfluidics also possess many significant advantages, e.g., low volume consumption of reagent, low labor requirements, high biocompatibility, easy for real-time monitoring, and practical for high-throughput analysis. As a result, extensive microfluidic-based platforms have been introduced for cell based studies, including for cell migration,14 cell fusion,15 and 3D cell culture.16 Despite the brilliant achievements microfluidic engineers have made over the last two decades, we should admit that the microfluidics field remains in its infancy17 and correspondingly, there are lots of problems ahead to solve before microfluidics can finally grow up as a mature subject.18 For instance, cancer metastasis to distant organs depends on complex transmigration interference with the microvasculature (e.g., vessel or vasa lymphatica), whereas reproducing such an in vitro microenvironment equivalent of the in vivo microvasculature remains a formidable challenge.19–22 During the last decade, major effort has been extended to constructing various types of microfluidic networks,23–31 consisting of rectangular,23–28 cylindrical,29,30 or both types31 of cross-sectional microchannels. One of the most fundamental rules of animal vessels is Murray's law,32–34 stating that the sum of the cubes of a daughter vessel is equal to the third-power of the mother vessel. During the last decade, some pioneering engineers already considered Murray's law when they designed artificial biomimetic microvascular networks.35–37 It was interestingly verified in recent reports38,39 that plant veins obey the same Murray's law as animal vessels. From these reports,38,39 we evaluated how the veinal microvasculature may become an alternative target of potential for in vitro vessel engineering.
Inspired by this post, we previously developed a method for the direct replication of whole-ordered microvascular networks from natural leaves into microfluidics, wherein a series of engineering characterizations (chemical stability, surface topography, 3D microchannel topology, and injection analysis, etc.) were systemically studied.40 Herein, we improve this manufacturing method by integrating artificial microchambers (controllable shape, dimension, and depth) into whole-ordered microvascular networks, through the utilization of Norland Optical Adhesive 63 (NOA). To display the biocompatibility of this leaf-inspired microdevice, we further cultured human melanoma cells, which are highly life threatening41 and cause 80% of deaths related to skin cancer.42 Through professional video processing43–47 of the cellular biophysics at the single-cell level (e.g., cell deformation, extracellular communication, cell division, cell mobility, and membranal48–51 local shear stress), we affirmed a good cellular activity in the microdevice, proving that such a device can be applied for downstream biomedical studies.
1 Experimental
1.1 Microchip fabrication
The overall schematic fabrication steps to replicate natural microvascular networks from real leaves into a microfluidic chip as well as to integrate multiple microchambers inside the networks is shown in Fig. 1. First, the upside of a fresh leaf is sequentially attached to a single-side tape (Tesa 57176-00 tesapack ultrastrong tr. 66 m: 50 mm) and double-sided tape (tesa double-sided tape 10 m: 15 mm), which is finally adhered onto a Petri dish (Mit 3 Nocken 391-0247), as shown in Fig. 1a. A 10![[thin space (1/6-em)]](https://www.rsc.org/images/entities/char_2009.gif) :1 (w/w) mixture of the PDMS prepolymer and curing agent (SYLGARD 184; Dow Corning) was degassed for an half hour, and then poured inside the Petri dish containing the leaf master (Fig. 1b). Then, PDMS prepolymer was cured at 45 °C for 24 h, and peeled off from the leaf master (Fig. 1c). Then, the PDMS replica was flipped over, and the microstructural surface punched by a commercial puncher (Fig. 2d). The diameter of the puncher determines the diameter of the microchamber, while the height of the PDMS replica in Fig. 1c determines the height of the microchamber in the final microfluidic chip (Fig. 1h). Then, the microstructural surface of PDMS was covered with Norland optical resist (NOA 63), flipped over, and attached to one oxygen plasma-treated Petri dish (Fig. 1e). NOA 63 should fill in all the microchambers of the PDMS replica in this step. After UV exposure for 15 min, the photoresist was cured and firmly bonded with the plasma-treated Petri dish, but the PDMS replica could be easily removed, leaving the NOA–Petri dish assembly as the master mold for further chip fabrication (Fig. 1f). A 20:1 (w/w) mixture of the PDMS prepolymer and curing agent was then poured on the NOA master inside the Petri dish (Fig. 1g). Then, the PDMS prepolymer was cured at 80 °C for 30 min, and peeled off from the NOA master (Fig. 1g–h). Corresponding through-holes (2 mm) were punched into the PDMS replica at the positions of the inlets, outlets, and microchambers. After a further oxygen plasma treatment together with silicon-based substrates, such as a glass plate or PDMS sheet, the chip could be firmly bonded, as shown in Fig. 1g. At some locations where the PDMS and substrate are not tightly contacted, an additional pressure can be applied for their tight contact, which was simply done by applying finger pressure. The power, the chamber pressure, and the exposure time during the plasma treatment (Diener electronic: 0010915) were 70 W, 0.7 Torr, and 30 s, respectively. Finally, silicone tubes (i.d. 1.6 mm, o.d. 2 mm) were inserted into the ports of the inlet, outlet, and microchambers, for the introduction of fluids, such as a chemical solution or biological medium. After filling with fluorescein solution (1 mg mL−1, with 0.01% Tween80), the microchip was located inside a UV transmitter (VWR Gehoview Mini M: VWRVG\1015). An overall fluorescent image of the microchip patterns (1× magnification) was captured by a commercial CCD camera (Canon ED560D).
:1 (w/w) mixture of the PDMS prepolymer and curing agent (SYLGARD 184; Dow Corning) was degassed for an half hour, and then poured inside the Petri dish containing the leaf master (Fig. 1b). Then, PDMS prepolymer was cured at 45 °C for 24 h, and peeled off from the leaf master (Fig. 1c). Then, the PDMS replica was flipped over, and the microstructural surface punched by a commercial puncher (Fig. 2d). The diameter of the puncher determines the diameter of the microchamber, while the height of the PDMS replica in Fig. 1c determines the height of the microchamber in the final microfluidic chip (Fig. 1h). Then, the microstructural surface of PDMS was covered with Norland optical resist (NOA 63), flipped over, and attached to one oxygen plasma-treated Petri dish (Fig. 1e). NOA 63 should fill in all the microchambers of the PDMS replica in this step. After UV exposure for 15 min, the photoresist was cured and firmly bonded with the plasma-treated Petri dish, but the PDMS replica could be easily removed, leaving the NOA–Petri dish assembly as the master mold for further chip fabrication (Fig. 1f). A 20:1 (w/w) mixture of the PDMS prepolymer and curing agent was then poured on the NOA master inside the Petri dish (Fig. 1g). Then, the PDMS prepolymer was cured at 80 °C for 30 min, and peeled off from the NOA master (Fig. 1g–h). Corresponding through-holes (2 mm) were punched into the PDMS replica at the positions of the inlets, outlets, and microchambers. After a further oxygen plasma treatment together with silicon-based substrates, such as a glass plate or PDMS sheet, the chip could be firmly bonded, as shown in Fig. 1g. At some locations where the PDMS and substrate are not tightly contacted, an additional pressure can be applied for their tight contact, which was simply done by applying finger pressure. The power, the chamber pressure, and the exposure time during the plasma treatment (Diener electronic: 0010915) were 70 W, 0.7 Torr, and 30 s, respectively. Finally, silicone tubes (i.d. 1.6 mm, o.d. 2 mm) were inserted into the ports of the inlet, outlet, and microchambers, for the introduction of fluids, such as a chemical solution or biological medium. After filling with fluorescein solution (1 mg mL−1, with 0.01% Tween80), the microchip was located inside a UV transmitter (VWR Gehoview Mini M: VWRVG\1015). An overall fluorescent image of the microchip patterns (1× magnification) was captured by a commercial CCD camera (Canon ED560D).
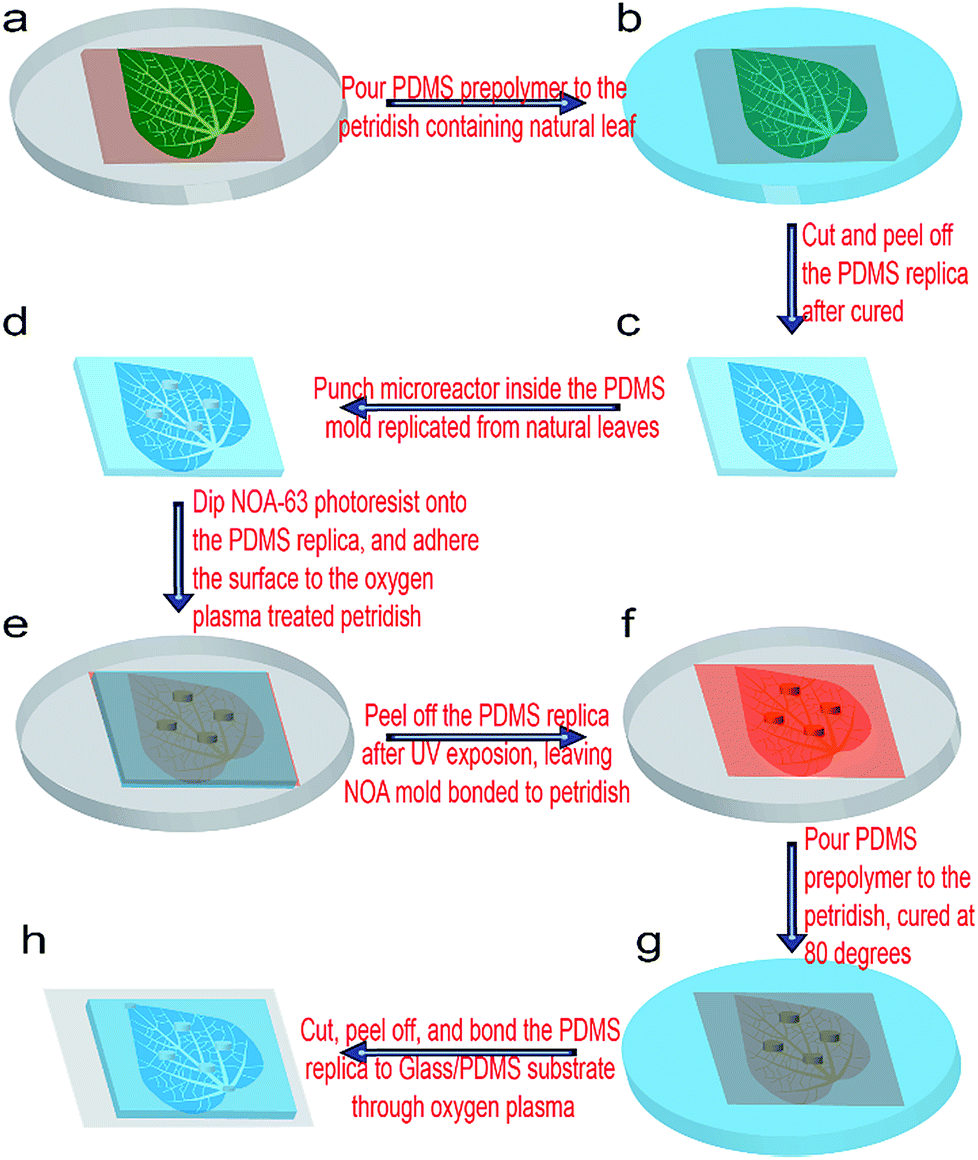 | ||
| Fig. 1 Schematic fabrication steps of the microchambers integrated biomimetic microvascular networks from natural leaves. (a) The natural leaves adhere to the Petri dish through single-side tape and double-sided tape. (b) PDMS prepolymer is poured into the Petri dish. (c) After curing, the PDMS replica is removed. (d) Holes are punched into the PDMS replica. (e) The PDMS replica is coated with Norland optical adhesive (NOA 63), which is then attached to another Petri dish followed by UV exposure. (f) After the PDMS replica is detached, the Petri dish–NOA hybrid master mold is left. (g) The PDMS prepolymer is poured into the Petri dish containing the hybrid template, cured at 80 °C. (h) PDMS replica is bonded with the glass or PDMS substrate through oxygen plasma treatment, with the microvascular channels easily modified by pressing the corresponding locations of the PDMS replica. | ||
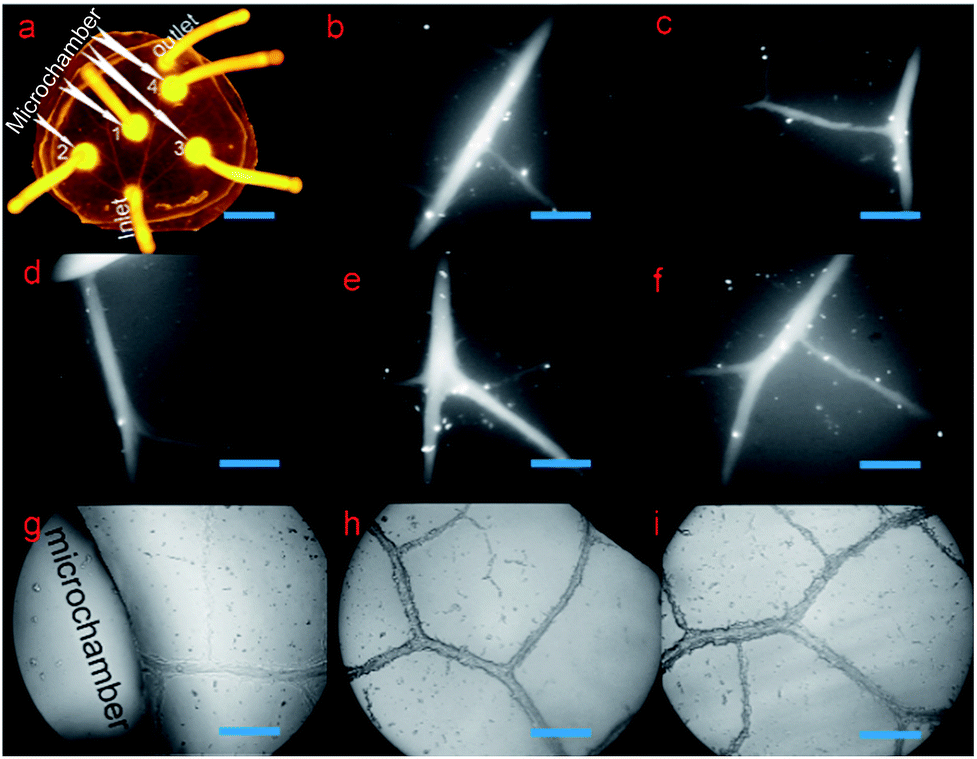 | ||
| Fig. 2 Characterization of the biomimetic microvasculature model. (a) The overall fluorescent image of the microsystem filled with fluorescein. (b)–(f) High-resolution fluorescent microscopic image of the microvascular networks at a magnification of 100×. (g)–(i) High-resolution optical microscopic images of the microvascular networks at a magnification of 100×. Scale bar in (a), 1 cm; scale bars in (b)–(i), 200 μm. | ||
1.2 Cell seeding and culture in the microchip
The MEL-HO human melanoma cell line (DSMZ ACC 62), which was established from the primary tumor of a woman with melanoma in 1976, was used in the experiments for the invasion assay inside the biomimetic microfluidic device. The cells were cultured in standard culture flasks containing RPMI medium (PAN-Biotech), supplemented with 10% fetal bovine serum (PAN-Biotech), 100 units per mL of penicillin, and 100 units per mL of streptomycin. An incubator was utilized to maintain the concentration of the humidified CO2 atmosphere and the incubation temperature at 5% and 37 °C, respectively. The culture medium was changed every three days before the cells were seeded into the microfluidic device. During the harvest step, 0.05% trypsin (PAN-Biotech) was used to digest and detach the cells from the culture flask. The density of the cell suspension was counted using a disposable hemocytometer (C-Chip Counter, Digital Bio), which was then centrifuged and adjusted to the required concentration for the following microchip seeding. The centrifuged cells were resuspended with 15% FBS supplemented RPMI medium at 7.5 × 10⁵ cells per mL. The cell viability was higher than 90%, based on the test by trypan blue solution, 0.4% (aMRESCO®). Before the seeding of the cell, the microfluidic device was sterilized in an autoclave at 121 °C for 20 min. Then, 15% FBS supplemented RPMI culture medium was flushed into the microdevice, through the silicone tubes of the inlets, outlets, and microchambers. Such a microdevice was incubated overnight in 5% CO2 at 37 °C to heighten the biological compatibility of the channel inner surface. Afterwards, 500 μL of cell suspension was transferred to a 2.5 mL sterilized syringe. The cells were then injected into central microchamber of the microchip (microchamber 1 in Fig. 2). By gradually pushing the syringe, the cell culture medium could slowly flow out of the inlet and outlet, as well as microchambers 2, 3, and 4, as shown in Fig. 2. Through the sample injection technique here, the cells could be mainly seeded in the four microchambers of the microfluidic device, but the cells were almost nonexistent inside the microvascular networks. Then, the prepared microfluidic device was kept in an incubator with 5% CO2 at 37 °C for 3 days before migration analysis, to allow the cells to attach and grow on the bottom surface of the microdevice.1.3 Monitoring the cell dynamics at a single-cell resolution
The on-stage microincubator was used for the real-time and long-term monitoring of cell biophysical performance during migration, with the CO2 concentration and culture temperature stabilized at 5% and 37 °C by a CO2 controller (Bioscience Tools, CO2-500ML TC-MI) and a heating unit (Bioscience Tools, Temperature Controller TC-1-100-I), respectively. Before CO2 enters the microincubator, it first passes through a DI water bath, to bring adequate atmospheric humidity into the microincubator necessary for the healthy growth of cells. After the microincubator is turned on, it is first maintained running for half an hour to stabilize the inner atmosphere consistency and temperature conditions. Afterwards, the cell-seeded microdevice is put inside the microchamber for a long term under real-time monitoring. Cell deformation and migration in response to the microvascular networks were assessed using an inverted optical microscope (ZEISS Axiovert S 100) under the control of imaging software (ProgRes® CapturePro 2.8.8), with images taken at a fixed time interval of 1 frame per min. The images were captured by a commercial CCD camera (ProgRes® MFcool), with a microscopic magnification of 100× and 320×, respectively. The resolution of 100× magnification can show the overall cell extravasation from a microchamber into the biomimetic microvascular channels, while the 320× magnification can show more distinct biophysical details of a single cell within a specific position of the microchannel.Because the border of the microchannel is not so obviously distinct from the rest of microstructure in original bright-field tracking video, we utilized Adobe Premiere to add a black bordering wall to the microchannel to heighten the channel display. Besides, Adobe Premiere was also utilized to add a series of other parameters to the original video, including time codes, text captions, scale bars, and indication arrows, etc., to increase the video readability. To visually display the overall cell behavior during a long term, the modified video was finally accelerated to 480× movie speed by Adobe Premiere. Selective frames were also exported directly by Adobe Premiere, for further figure analysis. As a result, compressive and dynamic cellular physiological details (e.g., microvilli, protonema, deformation, migration, extracellular communication, division, and cytomembrane shear stress, etc.) could be distinguished regarding all the cells within the microscopic area.
2 Results and discussion
2.1 Microchip characterization and bubble-free medium injection
There was one inlet, one outlet, and four microchambers in the microchip in our setup. As shown in Fig. 2a, the microvascular network of the biomimetic microchip was the same with the vein of a natural leaf, but with additional microchambers integrated into the microvascular networks. To more distinctly exhibit the structural details of the microchannels, both high-resolution fluorescent microscopic images (emitting light, 470 nm; absorption light, 530 nm) and high-resolution optical microscopic images of the microvascular networks were taken at a magnification of 100×. As shown in Fig. 2b–f, the fluorescein solution could fill the whole microvascular networks without any leakage, dead volume, or microbubbles formed, which are critical for long-term cell culture. This indicates a successful bubble-free medium injection into the biomimetic microvascular structure replicated from the leaf, depending on the methodology introduced here. Furthermore, because the channel surface of natural biological vasculature is not highly smooth but is a little rough, the inner surface of the microchannels fabricated here was a little coarse correspondingly (Fig. 2g–i), similar to previous leaf-inspired microchips.26In contrast, in the case of the microchannels fabricated by most traditional techniques, such as photolithography and laser ablation, their inner surface remains highly smooth under the same microscopic magnification times. This promises an obvious difference in microstructural surface between the microchannels fabricated by traditional methods and the microchannels fabricated here.
Three locations within 0.5 cm distance from the inlet were randomly set on the four first-ordered channels (Fig. S0, ESI 1†). The widths of the four first-ordered microchannels were measured as 158.6 μm, 189.8 μm, 231.2 μm, and 137.7 μm, respectively, with average width of 179.3 μm. The widths of seven second-ordered microchannels (Fig. S0, ESI 1†) were measured to be 136.9 μm, 107.4 μm, 124.8 μm, 110.8 μm, 109.3 μm, 63.6 μm, and 126 μm, respectively, with an average width of 111.3 μm. Across all the ordered microchannels, the smallest vein was around 18.5 μm in width, and microchannels with widths between 20 μm and 100 μm were widely found in the biomimetic networks. As shown in Fig. S0 (ESI 1†), various width values, such as 33.36 μm, 43.3 μm, 41.46 μm, 40.68 μm, 56.72 μm, 59.19 μm, 61.92 μm, 63.75 μm, 71.43 μm, 88.9 μm, etc., are found in three-ordered microchannels or above. Such microchannel dimensions are similar to the animal arterioles/venules that branch out from (small) arteries/veins and extend to capillaries, which display diameters ranging from around 10 μm to 200–300 μm. Remarkably, the dimensions of the leaf-inspired microvascular channels depend greatly on the plant species or on the specialized geometry of the individual leaf from the same plant applied as the lithography master. For instance, microvascular channels with a width of less than 10 μm (e.g., 8 or 9 μm) can be widely found in the bioinspired chip replicated from the leaf of Glechoma hederacea.40 Since the diameters of capillaries are generally 6–9 μm, such leaf-inspired microvascular networks can also be applied to mimic capillaries. On the other hand, the diameters of (small) arteries/veins are generally more than 200 μm, and thus, some leaves that have vein-widths as big as 1.2 mm (ref. 40) may also be applied to mimic (small) arteries and veins with bigger diameters.
2.2 Biocompatibility assay I: cell deformation
In this section, we verify that the leaf-inspired microdevice is biocompatible for cell deformation. We found that a large number of melanoma cells deform their shapes coincident with tiny microstructures of the microvascular wall (Fig. S1, ESI 1†), revealing a strong interference of the microvascular channels on the behavior of human melanoma cells inside the network. There are large numbers of tiny pores (average length similar to the average width) or tubes (average length much larger than the average width) on the inner surface of the biomimetic microvascular networks, as shown in Fig. 3. All these tiny pores/tubes are different in their shapes, with dimensional variances ranging from several micrometers to tens of micrometers. These tiny pores/tubes have similar dimensions with the nodes of porous animal vessels, such as venule and arterioles that are poorly developed with very thin endothelium walls of only one or two layers of muscle (elastic) tissue, or pathological vessels related with aging, hypertension, and arteriolosclerosis, or tumors causing emboli and nodules. Because of this, the tiny pores/tubes may be applied to mimic the vessel nodes.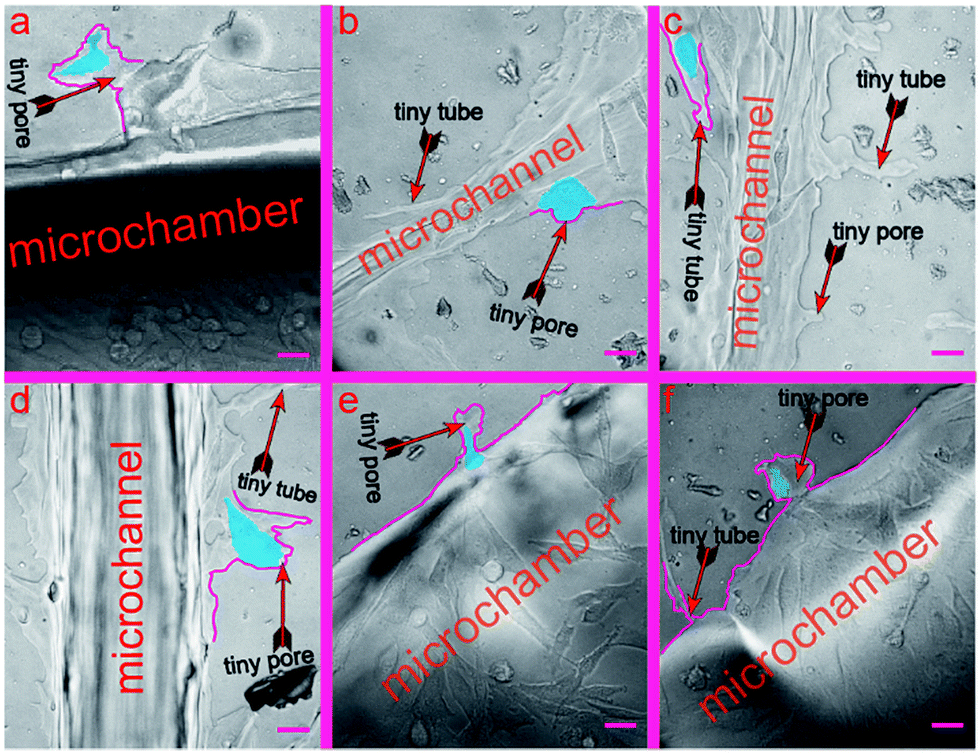 | ||
| Fig. 3 Cell deformation inside the leaf-inspired biomimetic microvascular networks. (a) The shoe-like deformational configuration of a cell. (b) The mushroom-like deformational configuration of a cell. (c) The bullet-like deformational configurations of a cell. (d)–(f) The cells are still undergoing the deformation process in accordance with the shapes of the tiny pores. Scale bars, 50 μm. | ||
After the cells are seeded and cultured inside the microchambers for several days, the tumor cells begin to extravasate from the microchambers into the microvascular networks. In the meanwhile, the tiny pores/tubes on the inner surface tend to influence the cell behavior by activating the cells to deform in a consistent manner with their shapes and dimensions. To better distinguish such phenomena, the deformed cells and interfering pores/tubes are highlighted in this work by blue and purple pseudo-colors, respectively (corresponding bright-field optical photos can be found in the ESI†). As shown in Fig. 3a, the tiny pores located on the wall of chamber look like converted shoes, with widths of 105.7 μm and 42.6 μm for the entrance and end, and 68.9 μm depth. Correspondingly, the activated the tumor cell deforms to a rare shoe-like configuration, with three feelers extruding toward three different directions at 120° intersection angles. In contrast, a shoe-like configuration here is impossible to arise in a traditional culture flask based system, and most cells instead display a spindle configuration if cultured inside a flask, Petri dish, or traditional microchip with a smooth inner channel surface (data not show). Similarly, the cell in Fig. 3b (the widths of the top entrance and bottom end for the tiny pore on the microchannel surface are 55.8 μm and 22.4 μm, respectively; the depth is 19.6 μm) displays a mushroom-like configuration, with an umbellate cover and an elliptic root embedded inside the tiny pore, which is also very rare compared with the cells cultured inside traditional devices. The analyzed cells in Fig. 3a and b finished the whole deformation process stimulated by the tiny pores. In contrast, the cells in Fig. 3c–f are still deforming against the shape of the tiny pores.
In Fig. 3c, there is one tiny tube located on the microvascular channel surface, which has a width of 40.9 μm for its entrance, 9.4 μm for its narrowest part, and 124 μm for its length. As a result, the cell deforms in a consistent manner with such a tube shape. There are two cells in Fig. 3d. The configuration of the bottom cell has deformed partially consistent with the tiny pore size (80.9 μm, 34.4 μm, and 50.3 μm for the entrance width, end width, and length, respectively) located on the channel surface. In Fig. 3e, the cell is still deforming and migrating into the tiny pore, which has dimensions of 16.9 μm, 40 μm, and 57.4 μm for the entrance width, end width, and length, respectively. In Fig. 3f, the cell has already migrated into the tiny pore. Nevertheless, it still needs more time to deform more, consistent with the tiny pore, which has dimensions of 30.7 μm, 69.2 μm, and 66.4 μm for the entrance width, end width, and length, respectively.
Because of the text limit in this paper, we only highlight several representative results (Fig. 3) to demonstrate the cell deformation in response with the tiny pores of the microvascular networks. Nevertheless, cell deformation widely exists all through the microvascular network (ESI 1†), especially in the locations with tiny pores/tubes.
2.3 Biocompatibility assay II: cell migration
In this section, we verify that the leaf-inspired microdevice is biocompatible for cell migration. The overall migration of cells inside the microvascular channel is displayed in Fig. 4, as captured by the optical microscope at 320×. The tumor cells are originally seeded only inside the microchamber (no cells are loaded inside the microvascular channel). After three days culture inside the incubator, most cells remain restricted inside the border of microchamber, but a few cells begin to extravasate from the microchamber into the microvascular channel. As shown in Fig. 4a, only one cell successfully extravasates from the microchamber into the microchannel in the third day. At its posterior site, the following cell only partially extravasates from the microchamber into the microchannel. If this cell can finally escape from the microchamber, then it should overcome the tension drag from the interconnected cells inside the microchamber (for this point, detailed clarification will be illustrated in a later section). It is noticeable that the configuration of the cells in different areas of the microvascular system is distinctly different. Most cells inside the microchamber are close-packed, with a spindle configuration; however, the cell located between the microchamber and microchannel has an elliptoid configuration instead of a spindle shape. On the other hand, the cell located inside the microchannel has a similar spindle configuration as those inside the microchambers, but it is much longer and narrower.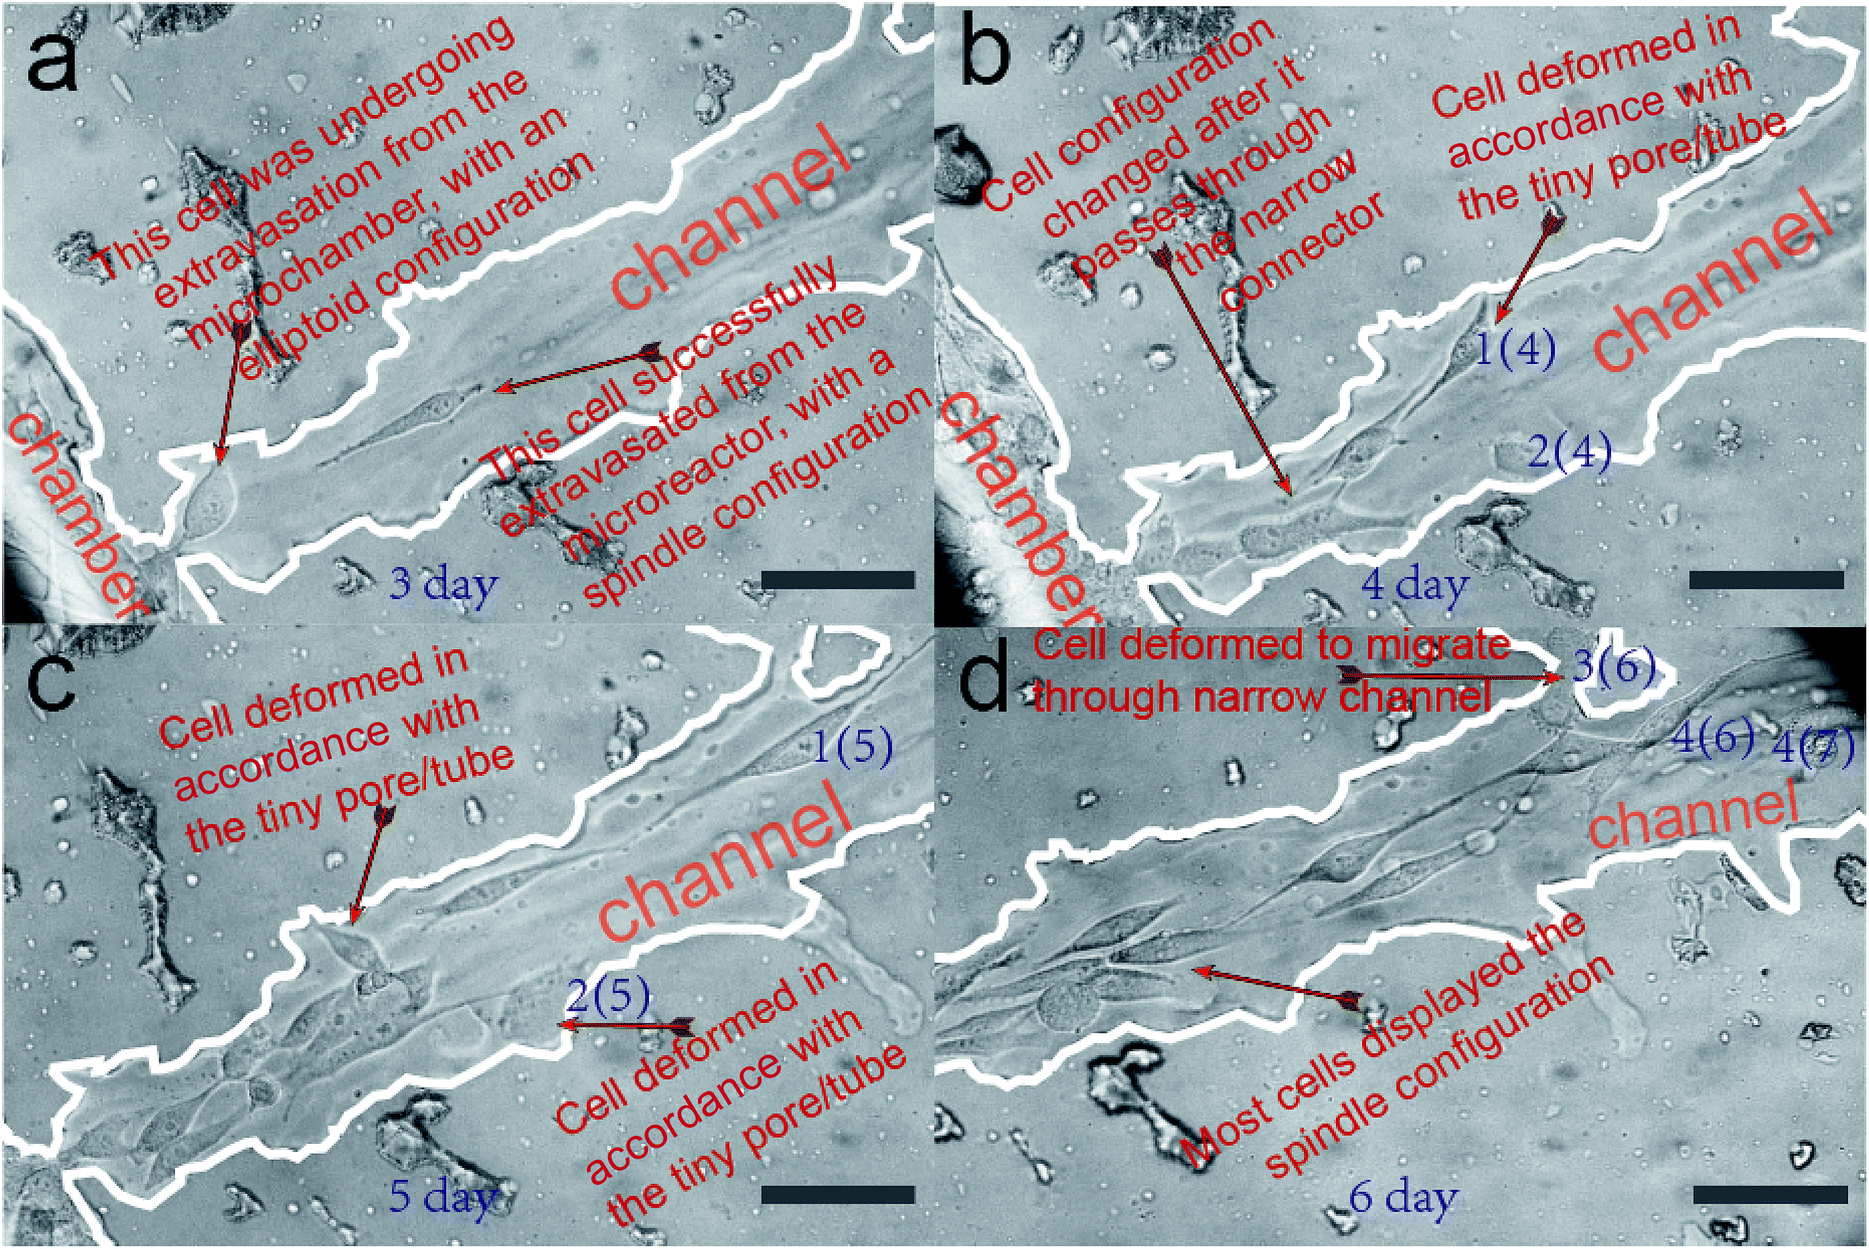 | ||
| Fig. 4 Tissue-like anatomic microvascular networks for cell extravasation analysis. (a) Cell configuration inside the microvascular channel after three days culture. (b) The optical microscopic results of cell migration inside the microvascular channel after four days of cell culture. (c) The optical microscopic results of cell migration inside the microvascular channel after five days of cell culture. (d) The optical microscopic results of cell migration inside the microvascular channel after six days of cell culture. Boarding line is highlighted by a white pseudo-color. Scale bars, 100 μm. | ||
Fig. 4b–d show the optical imaging results of cell migration inside the microvascular channel, after four, five, and six days of cell culture inside the microchamber. The distance between the Frontier cell and the microchamber border becomes farther and farther away as time passes, promising a sustained cell migration behavior after the tumor cells successfully extravasate from their originally loaded microchamber, as shown in Fig. 4a. The distance between the Frontier cell and the microreactor border at the third, the fourth, the fifth, and the sixth day was measured to be 237 μm, 320 μm, 665 μm, and 753 μm, respectively. Correspondingly, the daily migration velocity from the third day was calculated to be 83 μm per day, 338 μm per day, and 210 μm per day, respectively. As a result, it can be seen that the cell migration velocity is highest between the fourth day and the fifth day, but is lowest between the third day and the fourth day, which reveals dramatic variance in the daily migration velocity along the biomimetic microchannel over time.
As compared with the microchannels containing a highly smooth inner surface fabricated by traditional techniques, this is one obvious difference because the overall migration velocity is much more stable over time inside traditional microchannels.52,53 Such a dramatic overall velocity variability inside the biomimetic microvascular channel, as we hypothesize here, is caused by its rough inner surface.
It is also noticeable that some tiny pores/tubes are located on the inner surface of the microvascular channel, which may dramatically affect the cell behavior during its migration process. For easier recognition, several cells are labeled here as cell 1(4), 2(4), 1(5), 2(5), 3(6), 4(6), and 4(7), as shown in Fig. 4b–d. During the cell migration process, it was found that the two Frontier cells, namely 1(4) and 2(4), deform in accordance with the tiny pore located on the inner surface of the microchannel, and thus, their orientation is not in parallel with the microchannel during this time interval. As a result, the overall migration velocity along the microchannel decreases to only 83 μm per day. Between the fourth day and the fifth day, cell 1(4) changes to cell 1(5). Depending on our hypothesis, because there is no tiny pore here to activate the deformation of this cell, it can keep migrating with the cell orientation and migration direction in parallel with the microchannel, and thus it migrates much faster (338 μm within one day) than on the previous day. On the other hand, cell 2(4) can only move a much smaller distance during the same time interval. This is because there is another pore located on the inner surface, which activates cell 2(4) to deform to cell 2(5). Because the overall migration distance is determined by the difference between cell 1(4) and cell 1(5), which is 338 μm, the migration velocity is measured as high as 338 μm per day. As for the cell migration between the fourth day and the fifth day, it was noticeable that there was another tiny tube located on the microvascular channel, which activates the cell inside the microchannel to deform to cell 3(6) and thus this influences the cell migration along the microchannel. So the overall migration velocity decreases from 338 μm per day to 210 μm per day. Nevertheless, there are other Frontier cells like 4(6) and 4(7), which move in a direction parallel with the microchannel. This makes its overall migration velocity higher than the velocity achieved between the third day and the fourth day. The cells can finally detach from the tiny pores after they fail to pass through, as shown in the case of cells 1(4), 2(4), and 2(5) in Fig. 4b–d. In contrast, the cells can pass through the tiny tube, as shown in the case of cell 4(5) in Fig. 4d.
2.4 Biocompatibility assay III: tethers' formation
In this section, we verify that the leaf-inspired microdevice is biocompatible for the tether formation of mammalian cells. Through previous results, it could be clearly seen that tumor cells display obviously high deformability inside these venial-inspired biomimetic microvascular networks, but are dramatically unstable in terms of the migration velocity. To verify the mechanism behind these phenomena, we applied a video processing model for the live monitoring of the cellular dynamics inside the microvascular networks, at a single-cell resolution.Various configurations of the tethers of tumor cells are shown in Fig. 5. As can be easily seen, the cell tethers look like tiny ropes extending outside of the cell. The tethers of the cell display obvious hyperactivity. As shown in Fig. 5, the tether direction, tether length, and tether shape of both cell A and B show a big variance from time to time. In contrast, the main body of the cell does not reveal any changes at all during the same period. Such hyperactivity of tethers can ensure a melanoma cell can sense all the signals from the different directions of the microvasculature. Because of this, the cell does not leave out any stimulant signals from all directions of the microenvironment, and can finally move from its original position as indicated in Fig. 5a–e, to one tiny pore on its top left of the channel surface, as shown in Fig. 5f–i. After the cell migrates to its target position in Fig. 5f–i, new cell tethers grow out to sense other signals for further motion. Because the cell fails to pass through the tiny pore, as shown in Fig. 5j, it finally detaches from the tiny pore and returns back to the microchannel. The time-lapsed tether formation of cell B is indicated in Fig. 5k–t, displaying a similar hyperactivity as cell A.
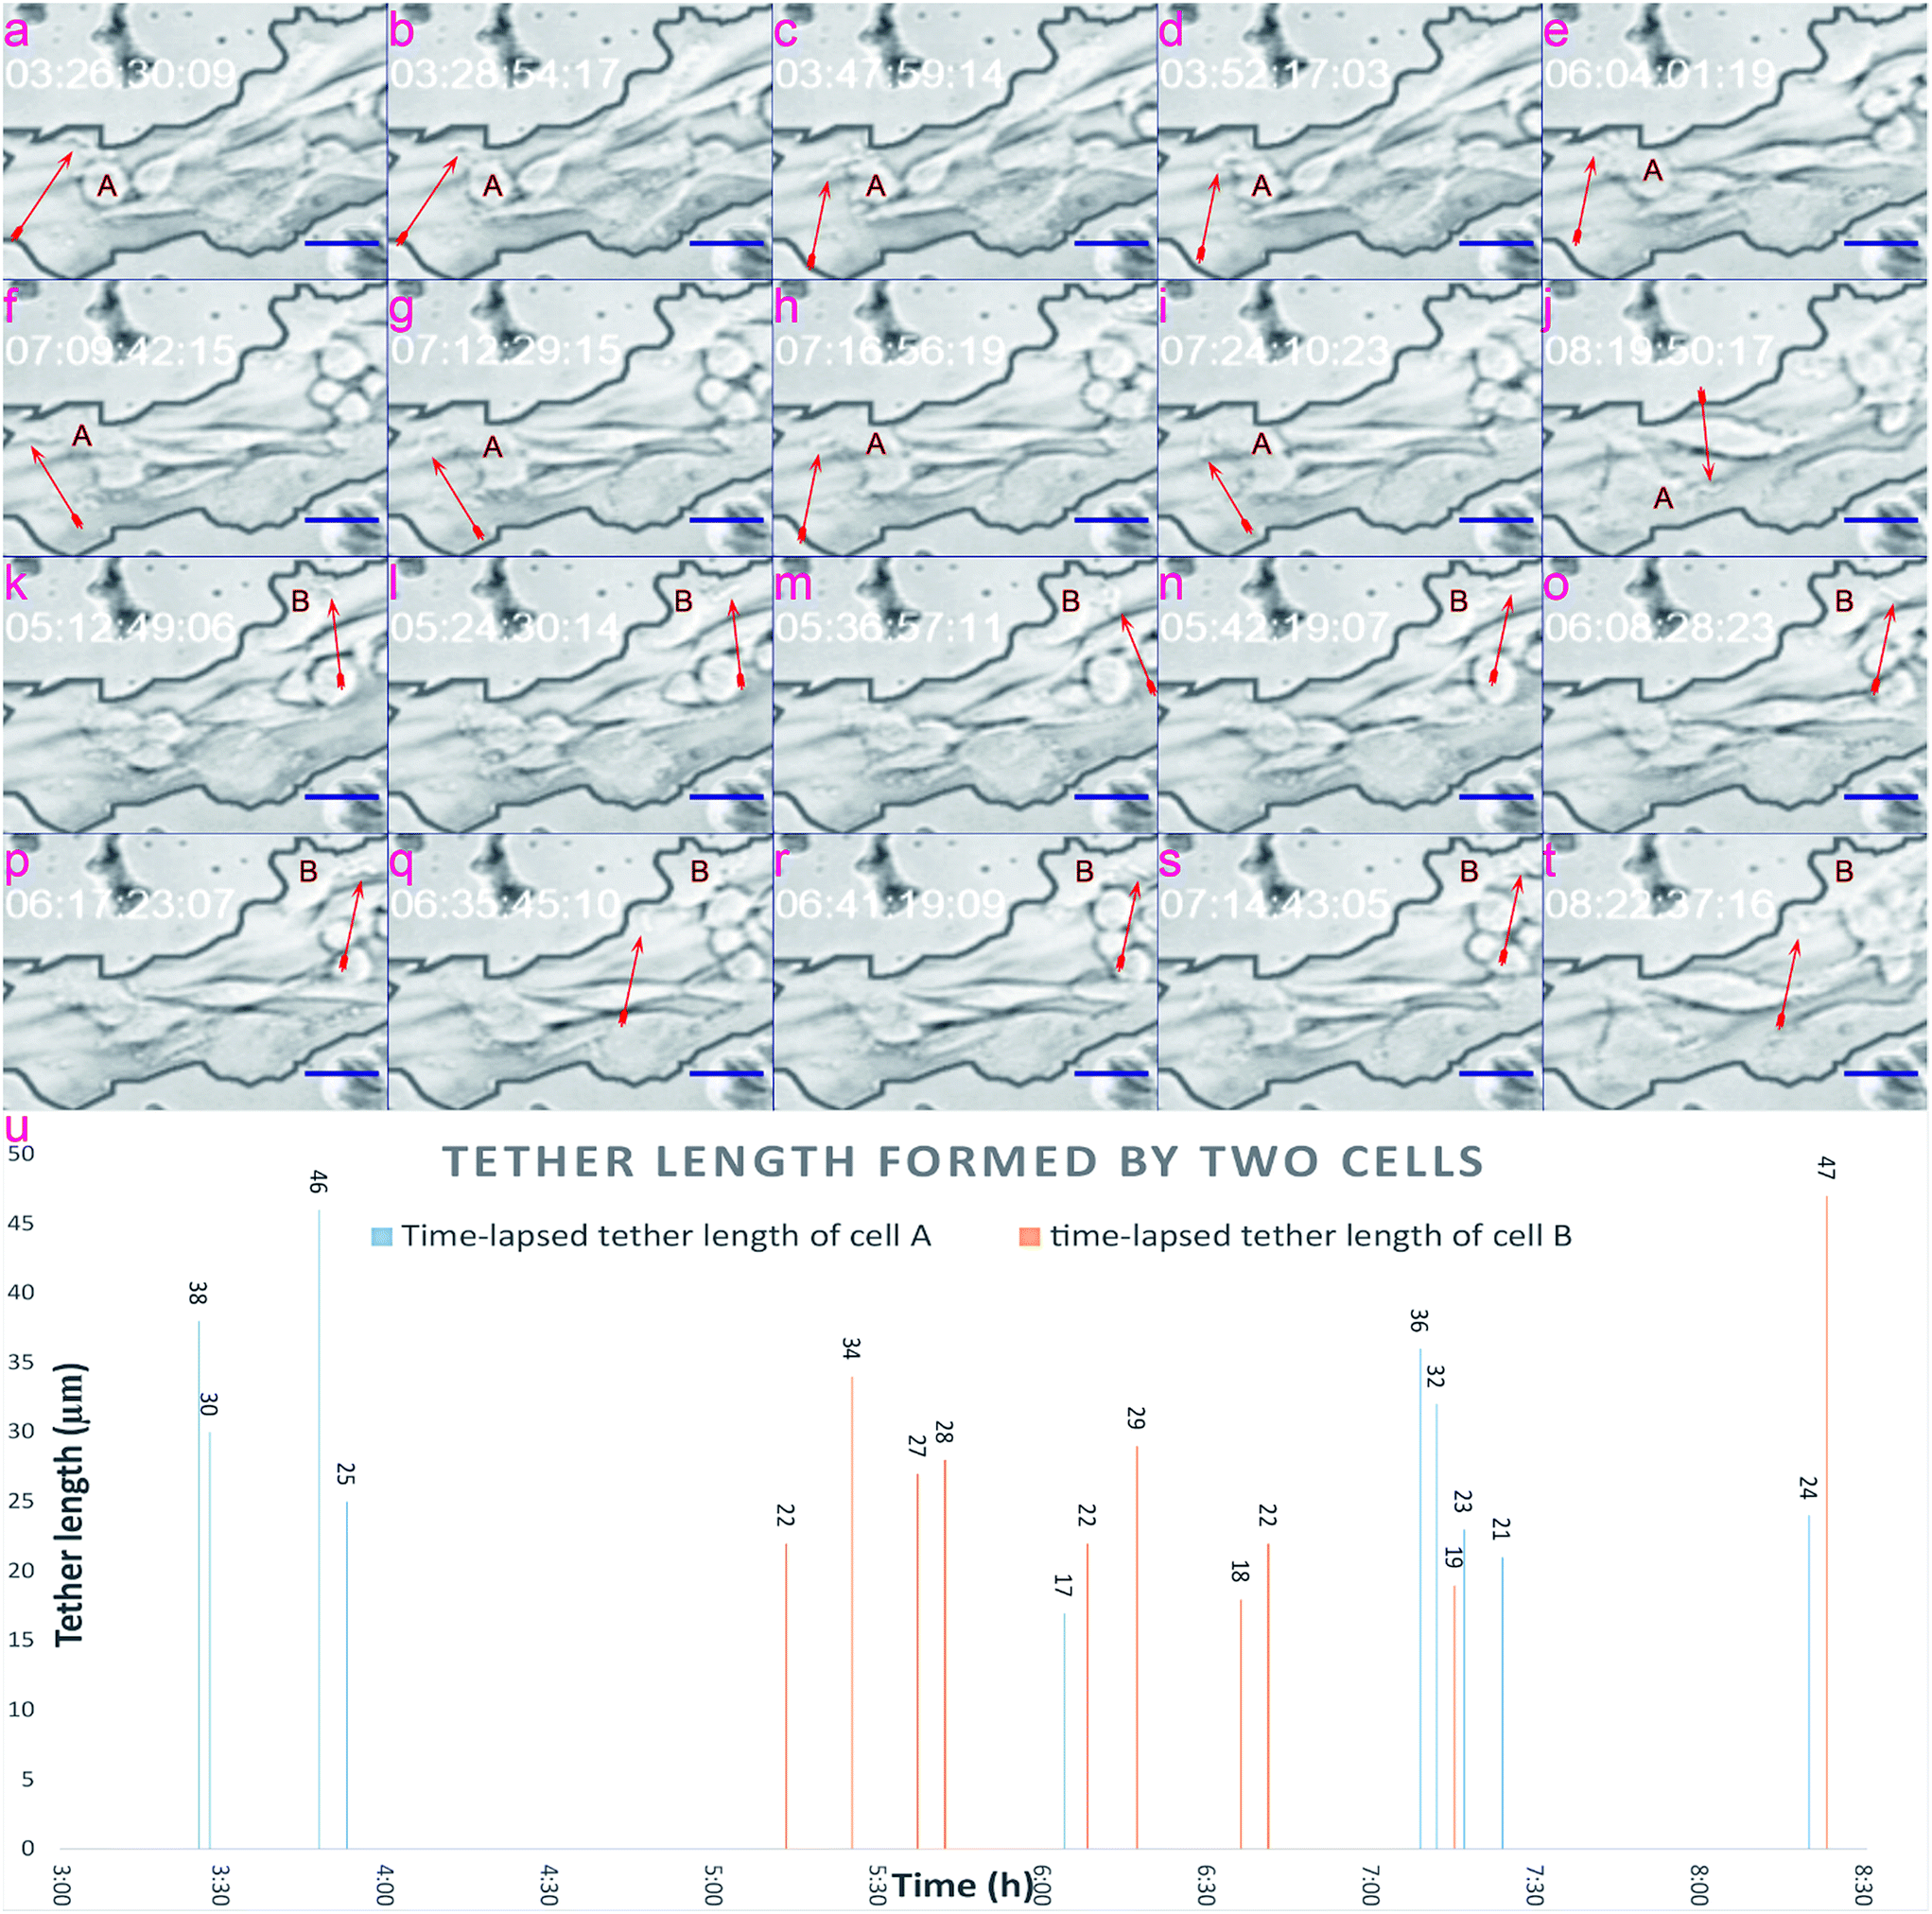 | ||
| Fig. 5 Tethers' activation by the tiny microvascular structure. (a)–(j) Tether variability of cell A. (k)–(t) Tether variability of cell B. The red arrows indicate the formation of tethers. Time codes displayed in each frame indicate the time when the frame is captured. (u) Tether formation and the hyperactive dynamics inside the biomimetic microvasculature: length of tethers formed by two independent melanoma cells inside the venially inspired microvascular networks. Scale bars, 50 μm. | ||
The tether lengths of cell A and cell B were also calculated, as shown in Fig. 5u, covering the timing period from 3:00 to 8:00 (h), with the average tether lengths of cell A and cell B estimated to be 29 μm and 27 μm from ten evaluated spots. The standard derivation (STDEV) of tether lengths formed by cell A and cell B were 8.87 and 8.67, while the variation coefficients (CVs) were 30.7% and 33.2%, respectively. Based on the video processing technique introduced here, a visual display of the dynamic behavior of cell tethers is provided in the ESI 2.†
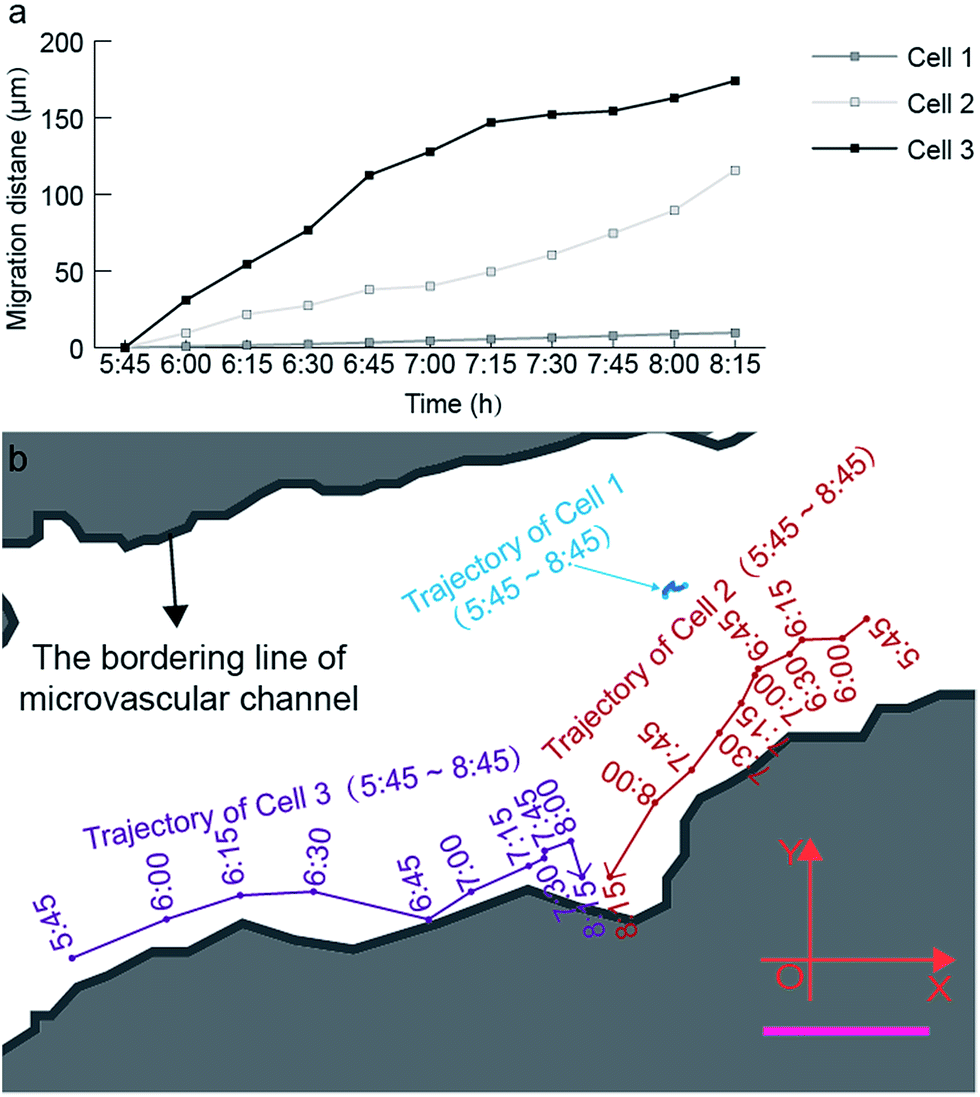 | ||
| Fig. 6 Quantitative analysis of the time-lapsed cell trajectory and migration distance at a single-cell level. (a) Time-lapsed migration distance of three cells inside the microvascular channel. (b) Time-lapsed migration trajectory of three cells inside the microvascular channel. The blue, red, and purple curves represent the trajectories of cells 1, 2, and 3 inside the microvascular channel with an interval of 15 min, during the recording period from 5:45 to 8:15 (ESI 3†). Scale bar, 50 μm. | ||
Based on Fig. 6, the migration velocity of cell 2 between 8:00 and 8:15 can reach 104.93 μm h−1, which is 2.3 times the average migration velocity in the monitoring period between 5:45 and 8:15. This phenomenon also supports our aforementioned hypothesis that the tiny pore of the microvasculature can strongly activate the formation of cell tethers, and further activates the cell deformation and migration. This is the reason why cell 1 reveals much lower migration activity compared with cell 2 and cell 3. The location of cell 1 is almost in the center of the microchannel, and thus lacks a stimulation signal from the channel surface to activate high amounts of cell tethers on its membrane.
Based on dynamic monitoring of three corresponding tumor cells, we also confirmed that when the cell begins to migrate, the cell tethers become extremely active. On the contrary, when the cell stays still, its tethers are inactive. As shown in Fig. 7, no tethers exist in cell 1 during the whole monitoring period. As a result, cell 1 stays in the same position during the whole monitoring process. On the contrary, tethers form in cell 2. Because of this, cell 2 migrates toward one tiny pore of the channel surface. Cell tethers also grow out in cell 3 and, correspondingly, cell 3 also migrates toward the same tiny pore along the channel surface. The tethers are located in the left bottom of cell 2, but are located on the right side of cell 3. Correspondingly, cell 2 migrates to the direction of the bottom left, while cell 3 migrates to the right direction. Based on the relationship between the migration routine and the location of the tethers, we can conclude that the melanoma cell will migrate in the same direction as the location of the cell tethers inside the biomimetic microvascular channel. There are less tethers on cell 2 as it is a little further away from the tiny pore, as shown in Fig. 7b and c. On the contrary, as it migrates closer and closer to the tiny pore, its tethers dramatically increase, as shown in Fig. 7d–f. As a result, the migration velocity of cell 2 increases as time passes.
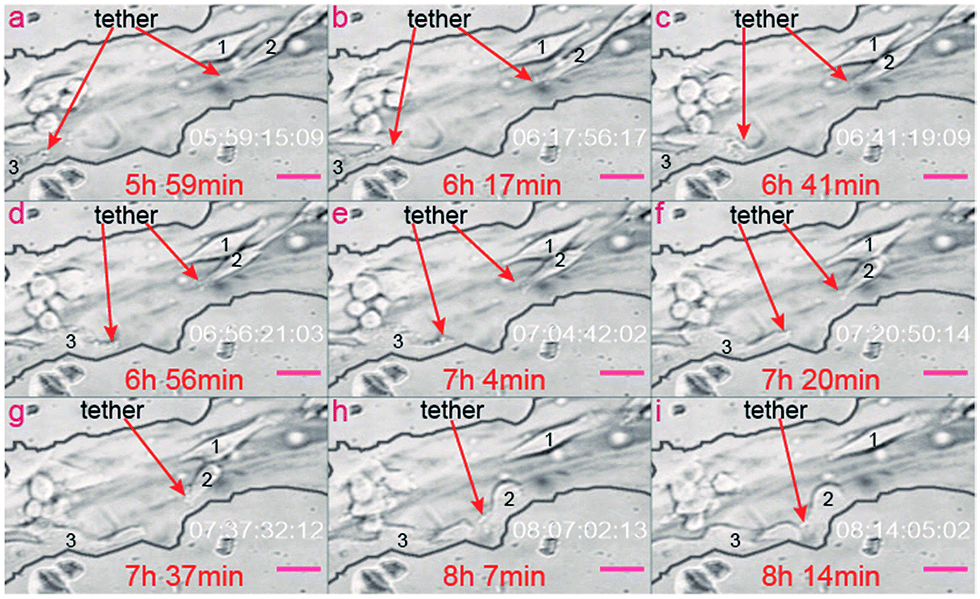 | ||
| Fig. 7 Tethers' activation by cell motion. (a)–(i) Cell 2 and cell 3 migrate to the same direction as their tethers' location, while cell 1 does not migrate to any directions due to the lack of tethers. The red arrows indicate the formation of tethers. The time codes in each frame indicate the time when the frame is captured. Scale bars, 50 μm. | ||
Besides, cell tethers are dramatically activated in the locations closer to the tiny pores (Fig. 7g–i) more than in locations further away from the tiny pores (Fig. 7a–f). Because of such a stimulating effect of microvascular pores on tethers formation, the migration velocity of the two pore-activated cells (cell 2 and cell 3) is much higher than the observed overall daily migration velocity along the microvascular channel direction, as aforementioned in “Section 2.2”. Cell 3 reveals the highest migration velocity within all the three cells of concern, since cell 3 always migrate along the biomimetic microvascular channel during the whole monitor period. The dramatically varying migration velocity of tumor cells inside the biomimetic microvascular channel as illustrated in previous sections can be virtually determined by the interaction between the tiny pores/tubes and the cell tethers.
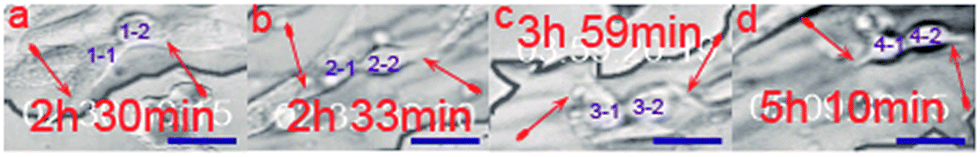 | ||
| Fig. 8 Tethers' activation by cell division inside the microvascular channels. (a)–(d) Four pairs of daughter cells just divided from four different mother cells. The red arrows indicate the formation of tethers. The time codes displayed in each frame indicate the moment when the video started to be record. Scale bars, 50 μm. | ||
Cell 2 in Fig. 7 is the same cell as cell 2–1 in Fig. 8. Even if the original position of cell 2 is similar to cell 1, as shown in Fig. 7, cell 2 just divides from another cell, which is also one factor activating the tether, as illustrated here. As a result, cell 2 grows out more cell tethers than cell 1, and correspondingly displays a higher cell activity as shown in Fig. 7a–f. More details concerning the related cells are provided in the ESI 3.†
2.5 Biocompatibility assay IV: comprehensive cell dynamics
Through long-term monitoring of the cell dynamics inside the biomimetic microvasculature following professional video processing, various cellular biophysical properties could be accurately analyzed at a single-cell resolution, including dynamic cytomembrane tension, extracellular communication, cell mobility, microvilli, and protonema configuration. These results further prove that the leaf-inspired microdevice is biocompatible for cell culture.3 Discussion
The leaf-inspired manufacturing methodology offers the potential to mimic microvascular networks obeying Murray's law. These microvascular networks allow for high-resolution and real-time observation of spatial–temporal single-cell dynamics, cell–cell communication, cell–microvasculature interactions, and cell population properties, etc.Human melanoma cells remain high physiological activity after 1 week culture inside the biomimetic microchip, promising our model an ideal methodology for long-term cell handing and analysis. We found that, herein the biomimetic microvascular model can dramatically heighten tumor deformability but also significantly labilizes migration velocity, implicating that mechanical stimuli can enhance cell adaption to the microvasculature during transmigration. Through 72 h assay of the cell migration inside the microchannel, the daily migration velocity was calculated to be 83 μm per day, 338 μm per day, and 210 μm per day, respectively, indicating a velocity difference as much as four-times under the same environmental conditions.
Compared with traditional systems, there are large amounts of tiny pores (with closed outlets) and tiny tubes (with open outlets) located on the inner microvascular surface of our biomimetic model here. We found that both the tiny pores and the tiny tubes could efficiently influence cell deformation, and decrease the overall cell migration velocity correspondingly. The difference is that for the case of tiny pores, the cells always return back to the microchannel after they fail to migrate through; while for the case of tiny tubes, the cells can migrate through, and even guide the following cells to motion toward the same tiny tubes via extracellular communication. The physiological significance of this phenomenon is that the tumor cells can easily pass through any permeable tubes located on the vascular walls and thus can invade to other organs, which can explain the high adjustability of tumor cells during their extravasation process through in vivo microvascular systems.
Relying on professional video processing of cell activities, it was confirmed that large amounts of cell tethers grow out from the cytomembrane. These cell tethers were highly active and motional, just like the claws of some animals (e.g., actiniae) which extend out from their body to grasp the signals from all directions around. Both the cell migration and the cell deformation occur in the same direction where cell tethers grow out. Furthermore, the tiny structures on the walls of biomimetic microvascular networks can efficiently stimulate the cell tethers of the tumor cells, which finally result in high cell deformability and unstable motion velocity during tumor metastasis, and thus, this verifies that the intrinsic enhanced accommodation of tumor cells to microvascular networks depends on extremely high tethers sensitivity to the mechanical stimuli from the tiny structures on the microvascular wall, further revealing the cell tethers as the organelle for the hyperactive cellular biophysical behaviors inside biomimetic microvasculature. The tethers dynamics at a single-cell level was also quantified, with a pore-activated tether as long as 46 μm concerning two tumor cells during a monitoring period of over 8 h.
One big difference between our system and other on-chip cell extravasation systems is that there was no additional attractant reagent added in our system to form a chemical gradient all through the microvasculature. So the dynamic behavior of cells in our model was not initiated by cell chemotaxis, but rather was initiated by the mechanical stimuli of the biomimetic microvascular network itself. The deformation and migration results implicate that such a kind of mechanical cell-stimulating cue is very strong, even comparable with chemotaxis stimuli. Depending on the video processing model raised here, we found that the cell migration velocity could be activated as high as 104.93 μm h−1 as the cell position was very close to the tiny pores, more than 2.5 times its average migration velocity farther away to tiny pores. As a result, we evaluated how the mechanical stimuli can possess a comparable function as a chemical cell-stimulating cue that influences tumor cell metastasis through a folded microvascular channel-like arteriosclerosis vessel, which thus, could lead to new anticancer targets for corresponding drug development.
4 Conclusion
Through the study of migration, division, deformation, proliferation, intercellular communication, cytomembrane dynamics, and tether activity at a single-cell resolution, we conclude that the manufacturing methodology developed here can be used to fabricate a microvascular device that is biocompatible for cell culture. Our future work includes the co-culture of different kinds of mammalian cells inside the multiple microchambers of the biomimetic system, to achieve a “leaf-inspired-microvasculature” for further body-on-chip applications.Acknowledgements
We would like to thank CAS Pioneer Hundred Talents Program for the support. We thank Ruth Eggers for providing the cells.Notes and references
- A. Manz, N. Graber and H. Widmer, Sens. Actuators, B, 1990, 1, 244 CrossRef CAS.
- D. J. Harrison, K. Fluri, K. Seiler, Z. Fan, C. S. Effenhauser and A. Manz, Science, 1993, 261, 895 CAS.
- M. U. Kopp, A. J. De Mello and A. Manz, Science, 1998, 280, 1046 CrossRef CAS PubMed.
- W. Wu, K. T. L. Trinh and N. Y. Lee, RSC Adv., 2015, 5, 12071 RSC.
- P. S. Dittrich and A. Manz, Nat. Rev. Drug Discovery, 2006, 5, 210 CrossRef CAS PubMed.
- P. Neužil, S. Giselbrecht, K. Länge, T. J. Huang and A. Manz, Nat. Rev. Drug Discovery, 2012, 11, 620 CrossRef PubMed.
- E. Lucchetta, J. H. Lee, L. A. Fu, N. H. Patel and R. F. Ismagilov, Nature, 2005, 434, 1134 CrossRef CAS PubMed.
- J. Liu, T. M. Fu, Z. Chen, G. Hong, T. Zhou and L. Jin, Nat. Nanotechnol., 2015, 10, 629 CrossRef CAS PubMed.
- M. Baker, Nature, 2011, 471, 661 CrossRef CAS PubMed.
- D. Huh, B. D. Matthews, A. Mammoto and M. Montoya-Zavala, Science, 2010, 328, 1662 CrossRef CAS PubMed.
- N. W. Choi, M. Cabodi, B. Held, J. P. Gleghorn and L. J. Bonassar, Nat. Mater., 2007, 6, 908 CrossRef CAS PubMed.
- S. N. Bhatia and D. E. Ingber, Nat. Biotechnol., 2014, 32, 760 CrossRef CAS PubMed.
- J. Ladewig, P. Koch and O. Brüstle, Nat. Neurosci., 2014, 17, 24 CrossRef CAS PubMed.
- Y. Luo and M. S. Shoichet, Nat. Mater., 2004, 3, 249 CrossRef CAS PubMed.
- A. M. Skelley, O. Kirak, H. Suh, R. Jaenisch and J. Voldman, Nat. Methods, 2009, 6, 147 CrossRef CAS PubMed.
- Y. Shin, S. Han, J. S. Jeon, K. Yamamoto and I. K. Zervantonakis, Nat. Protoc., 2012, 7, 1247 CrossRef CAS PubMed.
- G. M. Whitesides, Nature, 2006, 442, 368 CrossRef CAS PubMed.
- A. L. Fulton and D. J. Beebe, Nature, 2014, 507, 181 CrossRef PubMed.
- X. Y. Wang, Y. Pei, M. Xie, Z. H. Jin, Y. S. Xiao and Y. Wang, Lab Chip, 2015, 15, 1178 RSC.
- A. Hasan, A. Paul, N. E. Vrana, X. Zhao and A. Memic, Biomaterials, 2014, 35, 7308 CrossRef CAS PubMed.
- E. C. Novosel, C. Kleinhans and P. J. Kluger, Advanced drug delivery reviews, 2011, 63, 300 CrossRef CAS PubMed.
- K. Schimek, M. Busek, S. Brincker, B. Groth and S. Hoffmann, Lab Chip, 2013, 13, 3588 RSC.
- W. Wu, J. Wu, J. H. Kima and N. Y. Lee, Lab Chip, 2015, 15, 2819–2825 RSC.
- J. P. Morgan, P. F. Delnero, Y. Zheng and S. S. Verbridge, Nat. Protoc., 2013, 8, 1820 CrossRef PubMed.
- D. Huh, H. J. Kim, J. P. Fraser, D. E. Shea and M. Khan, Nat. Protoc., 2013, 8, 2135 CrossRef CAS PubMed.
- J. He, M. Mao, Y. Liu, J. Shao, Z. Jin and D. Li, Adv. Healthcare Mater., 2013, 2, 1108 CrossRef CAS PubMed.
- H. J. Koo and O. D. Velev, Sci. Rep., 2013, 3, 2357 CrossRef PubMed.
- Q. Zhang, T. Liu and J. Qin, Lab Chip, 2012, 12, 2837 RSC.
- J. S. Miller, K. R. Stevens, M. T. Yang and B. M. Baker, Nat. Mater., 2012, 11, 768 CrossRef CAS PubMed.
- W. Wu, K. T. L. Trinh and N. Y. Lee, Analyst, 2015, 140, 1416 RSC.
- W. Wu and N. Y. Lee, Sens. Actuators, B, 2013, 181, 756 CrossRef CAS.
- W. R. Hess, Arch. Anat. Physiol., Physiol. Abt., 1914, 1/2, 1 Search PubMed.
- C. D. Murray, Proc. Natl. Acad. Sci. U. S. A., 1926, 12, 207 CrossRef CAS.
- C. D. Murray, J. Gen. Physiol., 1926, 9, 835 CrossRef CAS PubMed.
- W. Wu, C. J. Hansen, A. M. Aragón, P. H. Geubelle, S. R. White, R. White and A. Lewis, Soft Matter, 2010, 6, 739 RSC.
- D. R. Emerson, K. Cieślicki, X. Gu and R. W. Barber, Lab Chip, 2006, 6, 447 RSC.
- R. W. Barber, K. Cieslicki and D. R. Emerson, Design and Nature III: Comparing Design in Nature with Science and Engineering, WIT Press, England, 2006 Search PubMed.
- K. A. McCulloh, J. S. Sperry and F. R. Adler, Nature, 2003, 421, 939 CrossRef CAS PubMed.
- C. A. Price, S. J. C. Knox and T. J. Brodribb, PLoS One, 2013, 8, e85420 Search PubMed.
- W. Wu, R. M. Guijt, Y. E. Silina, M. Koch and A. Manz, RSC Adv., 2016, 6, 22469 RSC.
- R. P. C. Wong, P. Ng, S. Dedhar and G. Li, Mol. Cancer Ther., 2007, 6, 1692 CrossRef CAS PubMed.
- A. F. Jerant, J. T. Johnson, C. Sheridan and T. J. Caffrey, Am. Fam. Physician, 2000, 62, 357 CAS.
- C. Zheng, Z. Yu, Y. Zhou, L. Tao, Y. Pang and T. Chen, Lab Chip, 2012, 12, 3063 RSC.
- M. Mehling, T. Frank, C. Albayrak and S. Tay, Lab Chip, 2015, 15, 1276 RSC.
- M. Chanasakulniyom, A. Glidle and J. M. Cooper, Lab Chip, 2015, 15, 208 RSC.
- N. Gopalakrishnan, R. Hannam, G. P. Casoni and D. Barriet, Lab Chip, 2015, 15, 1481 RSC.
- D. Gallego-Perez, N. Higuita-Castro and L. Denning, Lab Chip, 2012, 12, 4424 RSC.
- P. Sundd, E. Gutierrez, E. K. Koltsova and Y. Kuwano, Nature, 2012, 488, 399 CrossRef CAS PubMed.
- J. Diao, R. Liu, Y. Rong, M. Zhao, J. Zhang, Y. Lai and Q. Zhou, Nature, 2015, 520, 563 CrossRef CAS PubMed.
- O. M. de Brito and L. Scorrano, Nature, 2008, 456, 605 CrossRef PubMed.
- A. R. Houk, A. Jilkine, C. O. Mejean and R. Boltyanskiy, Cell, 2012, 148, 175 CrossRef CAS PubMed.
- K. Funamoto, I. K. Zervantonakis, Y. Liu, C. J. Ochs and C. Kim, Lab Chip, 2012, 12, 4855 RSC.
- C. H. Yeh, S. H. Tsai, L. W. Wu and Y. C. Lin, Lab chip., 2011, 11, 2583 RSC.
- J. Dai and M. P. Sheetz, Biophys. J., 1999, 77, 3363 CrossRef CAS PubMed.
- S. A. Nowak and T. Chou, Phys. Biol., 2010, 7, 026002 CrossRef PubMed.
Footnote |
| † Electronic supplementary information (ESI) available. See DOI: 10.1039/c7ra00290d |
| This journal is © The Royal Society of Chemistry 2017 |