
 Open Access Article
 This Open Access Article is licensed under a Creative Commons Attribution-Non Commercial 3.0 Unported Licence
Smart and designable graphene–SiO2 nanocomposites with multifunctional applications in silicone elastomers and polyaniline supercapacitors
Hualan Wang *a,
Risheng Liua,
Cheng Yanga,
Qingli Haob,
Xin Wangb,
Kai Gong*c,
Jirong Wu*a,
Yingqian Hua,
Zhifang Lia and
Jianxiong Jianga
*a,
Risheng Liua,
Cheng Yanga,
Qingli Haob,
Xin Wangb,
Kai Gong*c,
Jirong Wu*a,
Yingqian Hua,
Zhifang Lia and
Jianxiong Jianga
aKey Laboratory of Organosilicon Chemistry and Material Technology, Ministry of Education, Hangzhou Normal University, No. 58, Haishu Rd, Hangzhou, 311121, China. E-mail: hualanwang@163.com; 23wjr@163.com
bKey Laboratory of Soft Chemistry and Functional Materials, Ministry of Education, Nanjing University of Science and Technology, No. 200, Xiao Lingwei Street, Nanjing, 210094, China
cSchool of Pharmaceutical Science, Jiangnan University, No. 1800, Lihu Avenue, Wuxi, 214122, China. E-mail: kingong222@163.com
First published on 14th February 2017
Abstract
A novel method was developed to promote the multifunctional applications of chemically reduced graphene (rGE) in silicone elastomers (SE) and polyaniline (PANI)-based supercapacitors via the integration of SiO2. With the help of SiO2, the surface status of rGE can be designed according to actual needs and the generated rGE–SiO2 (rGES) showed various microstructures including lamellar, dendritic and sandwich-like shapes. The microstructures of rGES played a decisive role in the final functions of rGES-based polymer nanocomposites, which were better than the rGE-based polymer matrixes. Generally, lamellar rGES retained and stimulated the advantages of rGE, and the rGES-integrated PANI electrode (rGESP) showed better specific capacitance (555 F g−1) and cycling life (91%) than the rGE-integrated PANI electrode (381 F g−1 and 79%). Sandwich-like rGES promoted the mechanical performances of SE, and the values of rGES/SE (rGESSE) are ten times higher than those of rGE/SE, from 0.4 MPa to more than 7 MPa for the tensile strength and from 0.28 MPa to 3.7 MPa for the tensile modulus. Thus, the fabricated rGES is smart and designable, displaying multiple functions and applications.
1. Introduction
Multifunctional materials1–3 have attracted significant interest due to their diverse functions and flexibility, which are more adaptable than single functional materials. Graphene has further developed this type of materials due to unique properties such as high electrical conductivity, large specific surface area, excellent mechanical properties, high thermal conductivity and ease of functionalization.4–7 Graphene can not only show a variety of functions effectively in a single form,8–11 but can also serve many purposes in different fields of applications.12–15 For instance, Youngblood16 demonstrated a single graphene-based device that simultaneously provided efficient photodetection and optical modulation. Yan17 reported multifunctional three-dimensional graphene foams for high-performance supercapacitors and absorbers of hazardous organic liquids. Hence, graphene is able to achieve versatility individually.18,19There are also some multifunctional examples of graphene derivatives20,21 or graphene hybrids with other forms of carbon.22 For example, Wang23 combined graphene sheets and nanoribbons to form ultra-low density, highly porous, compressible and elastic aerogels for supercapacitor electrodes and adsorbents. Ye24 constructed graphene-tethered carbon fiber composite paper that was suitable as an electrocatalyst for oxygen reduction, oxygen evolution and hydrogen evolution reactions.
The versatility of graphene can also be displayed in the form of composites with polymers. Graphene can usually be directly introduced into the polymers.25–29 Wu30 used an alternating-current electric field to align graphene nanosheets in an epoxy polymer to simultaneously enhance mechanical, electrical, and thermal properties. However, graphene and polymers sometimes suffer from the limitations of poor compatibility, and functionalization of graphene is an effective choice to obtain the desired results. For example, Xue31 synthesized POSS-functionalized graphene nanosheets that showed superhydrophobic properties and could be used as nanofillers to increase the decomposition temperature and glass transition temperature for polymers. Yang32 incorporated polydopamine-coated graphene into polyurethane to enhance the tensile, thermomechanical, electromagnetic interference shielding properties and to reduce the electrical conductivity percolation threshold of the nanocomposites. Mai33 fabricated a polymethylmethacrylate (PMMA) matrix by introducing imidazolium ionic liquids to non-covalently functionalized graphene, which contributed to the large increases in the glass transition temperature and storage modulus.
Besides the above mentioned species, metals34 or their oxides35–37 are also able to expand and strengthen the multifunctions of graphene. Rajesh38 synthesized nanohole-structured and palladium-embedded 3D porous graphene for ultrahigh hydrogen storage and CO oxidation multifunctions. Liu39 presented nitrogen-rich carbon coupled multifunctional metal oxide/graphene nanohybrids for long-life lithium storage and efficient oxygen reduction. Upadhyay40 reviewed that metal oxide/graphene composites can perform multiple roles including (but not limited to): photocatalysts, adsorbents, antimicrobial agents. Wang41 prepared magnetic Fe3O4/graphene oxide nanocomposites with controlled drug delivery and magnetic resonance imaging.
However, there are still some unsettled issues about multifunctional graphene composites with metals, metal oxides and polymers. For example, many metals, especially transition metals and their oxides, are harmful to biology, and the destruction to the environment is irreversible. Moreover, some metals and their oxides are very precious with limited abundance on Earth. The excessive exploitation of resources may make them more expensive and rarer in the future. For another example, graphene is sometimes hard to bind and disperse in polymers, leading to inadequate performance release of graphene. Therefore, developing low cost, green, sustainable and well dispersed graphene based multifunctional materials has become a great challenge.
In this work, we have focused on exploring the potentials of SiO2 in promoting the multiple applications of rGE in silicone elastomers (SE) and polyaniline (PANI) supercapacitors. Silicon (Si) and oxygen (O) are the most abundant two elements, constituting 26.4% and 49.4% of the total mass of the earth's crust, respectively. If nonmetallic SiO2 could be utilized effectively, the resources and environmental advantages of SiO2 would exceed most metals, metal oxides and transition metal oxides. Therefore, more attention should be concentrated on SiO2, a low cost and environmental friendly material. And so far, it is still unknown whether such nonmetallic oxides can amplify and intensify the versatility of graphene or not. We expect to observe improvements in SiO2 promoting and expanding the multiple functions of graphene in various areas.
2. Experimental section
2.1 Fabrication of rGES
Graphite oxide (GO) was prepared using graphite (500 mesh) according to other literature by the Hummers method.42,43 Firstly, GO (5 g) in ethanol/distilled water (5000 mL, volume ratio 10![[thin space (1/6-em)]](https://www.rsc.org/images/entities/char_2009.gif) :1) was ultrasonicated for 1 h in a KQ-600 ultrasonic cleaner (600 W, Kunshan Ultrasonic Instrument Co., Ltd., China) to get a partly exfoliated yellow brown graphene oxide (GEO) suspension. Secondly, the dispersion was transferred to a flask (10000 mL), and a suitable amount of tetraethylorthosilicate (TEOS, CP.) and ammonia (AR.) were added into the solution under stirring. The mixture with a pH of 9–10 was reacted for 1 h at room temperature to prepared the GEO/SiO2. Thirdly, the hydrazine hydrate (AR., 6.25 mL, 69 millimol) was added to the dispersion, and the temperature was increased to 75 °C with refluxing and stirring for 3 h to prepare the reduced graphene/SiO2 (rGES). The fabricated rGES was collected, rinsed and dried in a vacuum at 80 °C. By changing the amount of raw materials, GO and tetraethylorthosilicate, a series of rGES with different SiO2 ratios were prepared.
:1) was ultrasonicated for 1 h in a KQ-600 ultrasonic cleaner (600 W, Kunshan Ultrasonic Instrument Co., Ltd., China) to get a partly exfoliated yellow brown graphene oxide (GEO) suspension. Secondly, the dispersion was transferred to a flask (10000 mL), and a suitable amount of tetraethylorthosilicate (TEOS, CP.) and ammonia (AR.) were added into the solution under stirring. The mixture with a pH of 9–10 was reacted for 1 h at room temperature to prepared the GEO/SiO2. Thirdly, the hydrazine hydrate (AR., 6.25 mL, 69 millimol) was added to the dispersion, and the temperature was increased to 75 °C with refluxing and stirring for 3 h to prepare the reduced graphene/SiO2 (rGES). The fabricated rGES was collected, rinsed and dried in a vacuum at 80 °C. By changing the amount of raw materials, GO and tetraethylorthosilicate, a series of rGES with different SiO2 ratios were prepared.
2.2 Fabrication of rGES based polymer nanocomposites
000, vinyl content 0.16% mol), rGES (5, 10, 20, 30 g), hydroxyl silicone oil (10 wt% of the rGES weight) and zinc stearate (CP, 0.1 g) were mixed on a SK-160 double roll open plastomil (Shanghai wings rubber machinery Co., Ltd, China) 5 times. Secondly, the mixture was put into a 150 °C vacuum oven for 4 h and taken out to cool before anti-refining with 2,5-dimethyl-2,5-di(tert-butylperoxy)hexane (1 g) on the SK-160 double roll open plastomil. Thirdly, the sample was put into a 11.5 × 11.5 × 0.25 cm mold and vulcanized (10 min, 170 °C, 14.5 MPa) on a QLB-50 vulcanizing machine (Shanghai wings rubber machinery Co., Ltd, China). Lastly, the sample was transferred into a blast oven (200 °C, 4 h) for depth curing and cut into strips before mechanical tests.:1) under ultrasonication for 1 h in a KQ-600 ultrasonic cleaner. Then, the mixture of aniline (9.9 mL, 100 millimol) and concentrated hydrochloric acid (9.0 mL, 100 millimol) was added into the suspension and stirred for 30 min. After that, ammonium persulfate (APS, 24.48 g) was added. The molar ratio of aniline, hydrochloric acid and APS was 1:1:1. The reaction was conducted at room temperature for 1 h, and the color of the mixture changed from black to dark green. Finally, the mixture was filtered and washed with distilled water several times, and dried at 60 °C in a vacuum oven for 24 h. The composite was called rGESP.2.3 Characterizations
3. Results and discussions
3.1 Morphology of rGES
TEM images of rGES with the SiO2 mass ratios 10, 50 and 90 wt% are shown in Fig. 1a, b, d, e, g and h, respectively. It can be seen that rGES-10 wt% is a lamellar structure that consists of approximately 2D wrinkled rGE and loaded nanoscale SiO2. The average diameter of loaded SiO2 is estimated to be less than 5 nm, according to the inset of Fig. 1b(i). The lamellar structure of rGES is much like the cross section of dragon fruit, shown in Fig. 1c. It is interesting that the lamellar structure changes into a 3D dendritic architecture when the SiO2 ratio increases to 50 wt%, shown in Fig. 1d and e. The special dendritic rGES is composed of a highly folded internal skeleton and densely outstretched zigzags on the edges. The size of zigzags is in the range of 100–200 nm in length and 10–30 nm in width according to the inset Fig. 1e(ii). The dendritic rGES in appearance is like a butterfly, as shown in Fig. 1f. The possible cause of the particular morphology will be discussed in detail shortly. | ||
| Fig. 1 TEM images of rGES with different SiO2 mass ratios: (a and b) 10 wt% (d and e) 50 wt%, (g and h) 90 wt%. The insets (i, ii, iii) are higher magnifications of rGES-10 wt%, rGES-50 wt% and rGES-90 wt%, respectively. The color images (c), (f) and (i) are figures of speech for rGES-10 wt%, rGES-50 wt% and rGES-90 wt%, respectively. | ||
Fig. 1g and h show that rGES-90 wt% develops into sandwich-like sesame cake architecture (Fig. 1i) with rGE as the core sheet and SiO2 as the external wrapping layers. It is the increased number of SiO2 particles that gradually covered the exposed regions of the rGE sheets on both sides and finally formed the outer sandwich-like structure. Compared with the lamellar structured rGES, obvious changes can be seen for sandwich-like rGES. For example, there is almost no exposed area on rGE, the sheets become thicker, and the size of SiO2 is larger (10–20 nm), which is shown in the inset (iii) of Fig. 1h. The bigger size is because of the sustained increase and growth of SiO2. Thus, three kinds of typical morphology, 2D lamellar, 3D dendritic, and sandwich-like rGES have been regulated simply by controlling the relative amount of raw materials.
It has been suggested that when the mass ratio of SiO2 is lower than rGE in rGES, SiO2 acts as the object and rGE acts as the body to show loaded structures. Conversely, when the SiO2 content exceeds rGE, SiO2 and rGE act as the body and object, respectively, in rGES, showing a sandwich-like biscuit architecture. However, when the contents of the two are nearly equal, there is an intense competition to get the body identity between rGE and SiO2. It is hard to determine the winner, and they finally act as a framework for each other. As a result, the rGE regions containing SiO2 become the skeleton, which is quite thick due to the wrinkling and stacking in the competition process. The exposed rGE regions without SiO2 become edges that are very thin and quite branched. Therefore, the 3D dendritic-like structure may be a result of competition, reflecting the intermediate or transition state between the lamellar state and sandwich-like structure.
Fig. 2a, d and g show the digital photos of the fluorescence screen for rGES-50 wt% taken from the observation window of the TEM instrument. These photos clearly display several artistic distributing states of rGES-50 wt% on the carbon support film of the copper mesh: apple, circle, and stars situated in a circle. Fig. 2b, e and h are the corresponding images of these samples collected by a TEM instrument equipped with a CCD camera at lower magnification. Whatever the accumulation mode is, the microcosmic morphologies are nearly the same. They are wrinkled and branched into a 3D hierarchical structure with sawtooth edges, as shown in Fig. 1d and e and 2c, f and i.
 | ||
| Fig. 2 rGES-50 wt% has several artistic distributing states on carbon support film of copper mesh: (a) apple, (d) circle, (g) stars situated in a circle. The first vertical column (a, d and g) is digital photos of the fluorescence screen shooting from the observation window of the TEM instrument. The second vertical column (b, e and h) TEM images of rGES-50 wt% recorded by the CCD camera of the TEM instrument at lower magnification. The third vertical column (c, f and i) corresponding TEM images recorded at higher magnifications, respectively. | ||
Detailed microstructural analysis of rGES-50 wt% by the TEM technique at the nanoscale reveals that these 3D hierarchical structures are formed in accordance with a certain way. The sawtooth edges are more likely from the discontinuous areas where rGE is not covered by SiO2. Thus, one possible formation mechanism for this 3D dendritic structure is that the rGE regions containing the SiO2 fold and stack in the center forming the skeleton, and the exposed rGE area without SiO2 naturally stretches around forming the zigzag edges.
Based on the variable structures mentioned above, we believe that rGES has potential diverse functions when used in polymers because the microstructure always determines the final performance of materials. One possible function is based on lamellar rGES, which may be a good electrode material for PANI based supercapacitors due to a large exposed area of rGE in rGES. The other possible function is based on sandwich-like rGES, which may act as enhancing filler for silicone matrixes due to the excellent compatibility between rGES (through SiO2) and silicone. The 3D dendritic structure is proposed as a critical point of function conversion from electrochemical to mechanical properties. Therefore, rGESSE and rGESP matrixes are constructed and discussed systematically to verify the speculations experimentally. We investigated the mechanical enhancing effect of rGES on silicone matrixes.
3.2 The rGES as an enhancing filler for silicone elastomers
The relationship between the tensile strength of corresponding silicone matrixes and SiO2 content in rGES is shown in Fig. 3. The tensile strength of pure rGE filled silicone matrix is about 0.4 MPa, corresponding to zero content of SiO2 in rGES. Increasing the filling fraction of rGE does not improve the tensile strength value, indicating that the mechanical property of rGE has not been utilized sufficiently. Poor compatibility between rGE and silicone may be an important reason, leading to poor dispersion. When the ratio of silica in rGES is below 75 wt%, the tensile strength of the rGES filled silicone matrix is still low and almost constant, except for a small oscillation at 50 wt%. However, the tensile strength value increases rapidly as the silica ratio exceeds 75 wt%, which can be considered as a threshold. Afterwards, the tensile strength value rises quickly and exceeds 7 MPa for rGES-90 wt% at a filling fraction of 30 wt%, equivalent to a content of 3 wt% for rGE. The tensile strength value for the rGESSE matrix reaches more than 18 times the individual rGE filled one. The good compatibility of SiO2 with silicone is helpful to aid the uniform dispersion of rGE in silicone, leading to better mechanical properties. | ||
| Fig. 3 Tensile strength as a function of SiO2 content (0–100 wt%) in rGES. The filling fraction of rGES in the silicone matrix ranges from 5 wt% to 30 wt%. Here, rGES includes lamellar, branched and sandwich-like rGES. | ||
It is observed that rGES with a higher ratio of SiO2 at the threshold of 75 wt% has completely changed into sandwich-like structures (not shown here). That is to say, the function of mechanical enhancing is mainly realized by sandwich-like rGES. Here, the contact between rGE and silicone is achieved through SiO2 indirectly. The incorporation of SiO2 and its excellent compatibility with both rGE and silicone have improved the dispersion of rGE in the silicone matrix. Therefore, a higher ratio of SiO2 in rGES leads to better dispersion in the silicone matrix and higher tensile strength. However, the tensile strength value declines when the silica content reaches 100 wt% (pure SiO2), indicating that the components in rGES show synergy in the mechanical performance, exceeding both rGE and SiO2. In addition, the tensile strength is also affected by the filling fraction of rGES, generally, a higher filling quantity leads to a bigger tensile strength value in our experimental ranging from 5 wt% to 30 wt%.
Young's modulus as a function of tensile strength is shown to further assess the mechanical performance of prepared silicone elastomers (SE) in Fig. 4. It was found that silicone matrixes filled by rGES with lower SiO2 content (50 and 75 wt%) exhibit lower Young's modulus (<0.94 MPa) and tensile strength (<0.73 MPa). Only higher SiO2 content in rGES (83 and 90 wt%) can bring significant improvement to Young's modulus (>3 MPa) and tensile strength (>5 MPa). In particular, the tensile modulus reaches 3.7 MPa at a rGES-90 wt% filling fraction of 30 wt%, nearly 5 times than the rGES-50 wt% filled one (0.8 MPa). From the TEM images in Fig. 1, we know that the higher SiO2 content in rGES (>75 wt%) can greatly reduce the exposed specific area of rGE, which lacks compatibility with silicone. Conversely, SiO2 possesses good compatibility with silicone chains; therefore, the interface contacts between silicone and rGES with higher SiO2 ratios can be effectively improved. Compared with the reported graphene/silicone in literature,44 the discussed rGESSE here shows better mechanical properties, implying a positive effect of the SiO2 integration. The improved dispersion and properties allow wide applications of rGESSE as O-rings, high and low temperature sealed tubes, gaskets, button rollers and so on.
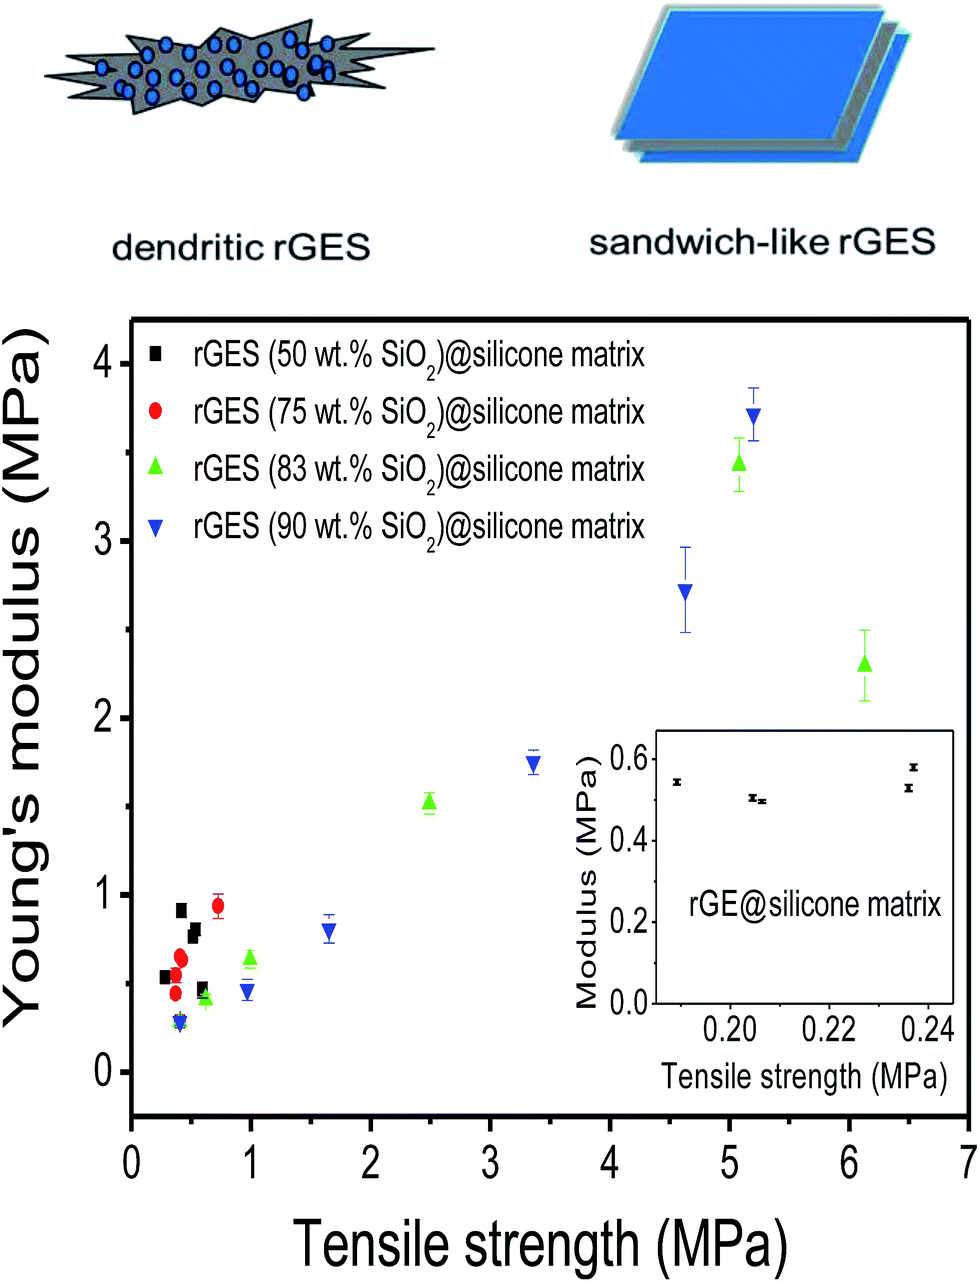 | ||
| Fig. 4 The Young's modulus as a function of tensile strength. SiO2 contents in rGES: 50, 75, 83, 90 wt%. The rGES filling fractions in silicone matrixes: 5, 10, 20, 30, 40 wt%. Here, rGES includes branched and sandwich-like rGES. | ||
It seems that interfacial interactions directly influence the dispersion level of fillers in polymer matrixes. For each filled silicone nanocomposite, the microstructure for the cross-section of the tensile fracture was characterized by SEM. Fig. 5a–c shows the TEM images of sandwich-like rGES. Fig. 5d, e, f, g and h are the SEM images of silicone composites filled by rGE, SiO2 and rGES, respectively. Fig. 5i is the SEM image of bare silicone for comparison. As for the rGE/silicone matrix, obvious micro cracks (see the red arrows in Fig. 5e) were seen between the two phase interfaces, resulting from the extra force and weak interaction between the rGE and silicone. In particular, the appearance of the interphase micro crack under continuous external force was believed to be an important fuse leading to fracture behaviors. Compared with the situation of the rGE/silicone matrix, the fracture surfaces of SiO2 and rGES filled silicone matrixes were more uniform and dense, and no obvious two phase interface micro cracks were observed. Furthermore, the dispersion states of rGES in the silicone matrix are far better than rGE and competitive to or even better than SiO2.
 | ||
| Fig. 5 (a–c) TEM images of sandwich-like rGES. SEM images of silicone matrixes filled by (d and e) rGE, (f) SiO2 and (g and h) rGES, respectively. (i) Pure silicone. | ||
Compared with the rGE/silicone, the SEM images of the silicone matrixes filled by rGES were more uniform. The vulcanized rGESSE matrix (Fig. 5h) shows a rougher surface than the one before vulcanization (Fig. 5g). The interactions between the rGES sheets and silicone are strong, and almost no micro-cracks emerge at the interfaces (Fig. 5h). On the other hand, however, the edges of the rGES sheets usually lack modification, especially for lower SiO2 content samples. Therefore, the rGES edges are less compatible with silicone and are weaker positions where fractures are most likely to occur under external force. It was suggested that the fracture preferentially occurs at the weakest interaction positions. For example, the fracture for rGE filled silicone matrix preferentially occurs at the planar interface contacted with silicone. Conversely, the fracture for the rGES filled silicone matrix preferentially happens at the sheet edges in contact with silicone due to weaker compatibility. In addition to these, the fracture can also happen at crosslinking points and polymer molecular chains if the phase interfacial interaction is large enough under external force.
3.3 The rGES as active material for PANI supercapacitors
In order to further reveal the versatility of rGES in polymers, the rGESP nanocomposites were prepared to explore whether there is a positive effect of rGES on the PANI supercapacitors. The preparation was achieved by adding a certain amount of rGES in the formation process of PANI using an in situ polymerization method, the addition order of materials and manufacturing process is illustrated in Fig. 6a. Fig. 6b shows the XRD patterns of rGE, SiO2, rGES, PANI and rGESP. The rGE shows a broad peak at 23.3°, signifying a certain degree of graphitization of rGE and corresponding to an interlayer spacing of about 0.38 nm. The peak of SiO2 was found at 22.6°, which also emerges in the peak of rGES, whose peaks are a comprehensive reflection of rGE and SiO2. A broad peak appearing at about 25° for PANI was observed, which is a typical polymer diffraction feature. After integrating with rGES in rGESP ternary composites, PANI shows several new peaks in the range of 15–40°, indicating that the regularity of PANI is enhanced largely. The existence of rGES promotes a more regular growth of PANI. Moreover, no obvious graphite peak at 26.6° can be found in rGESP, indicating a good dispersion of rGE, and the agglomeration is inhibited by SiO2 and PANI nanoparticles. | ||
| Fig. 6 (a) Fabrication route of rGESP. (b) XRD patterns of individual rGE, SiO2, PANI and their nanocomposites rGES and rGESP. (c) FT-IR spectra of SiO2, rGES, rGE, GO, rGESP and PANI. (d) Enlarged view for rGES and rGE in (c). | ||
The FT-IR spectra of GO, rGE, rGES, rGESP, PANI and SiO2 are compared in Fig. 6c. As we know, the characteristic peaks of GO at 1714 and 1032 cm−1 correspond to the carboxyl (COOH) and epoxide (C–O–C),45 respectively. The peak at 1622 cm−1 can be attributed to the C![[double bond, length as m-dash]](https://www.rsc.org/images/entities/char_e001.gif) C stretching vibration.46 Compared with GO, the rGE, rGES and rGESP show decreased or disappearing peak intensity for these oxygen-containing groups, indicating that GO was well reduced. For the case of SiO2, the peak at about 790 cm−1 could be assigned to the typical vibration mode of the framework Si–O–Si; 1064 cm−1 is the asymmetric stretching vibration of Si–O–Si; and this peak also emerges in rGES just as shown in Fig. 6d. A weak band located at 950 cm−1 for SiO2 was mainly attributed to the stretching vibrations of the Si–OH groups at defect sites.47 For PANI, the peaks at 1557 and 1480 cm−1 correspond to the CC stretching modes in quinoid and benzenoid ring for PANI, respectively. The peak at 1293 cm−1 was attributed to the C–N stretching vibration.48 Most of the characteristic peaks of PANI and SiO2 can be found in rGESP with a small chemical shift, indicating that the components are well combined and successfully constitute the final composite.
C stretching vibration.46 Compared with GO, the rGE, rGES and rGESP show decreased or disappearing peak intensity for these oxygen-containing groups, indicating that GO was well reduced. For the case of SiO2, the peak at about 790 cm−1 could be assigned to the typical vibration mode of the framework Si–O–Si; 1064 cm−1 is the asymmetric stretching vibration of Si–O–Si; and this peak also emerges in rGES just as shown in Fig. 6d. A weak band located at 950 cm−1 for SiO2 was mainly attributed to the stretching vibrations of the Si–OH groups at defect sites.47 For PANI, the peaks at 1557 and 1480 cm−1 correspond to the CC stretching modes in quinoid and benzenoid ring for PANI, respectively. The peak at 1293 cm−1 was attributed to the C–N stretching vibration.48 Most of the characteristic peaks of PANI and SiO2 can be found in rGESP with a small chemical shift, indicating that the components are well combined and successfully constitute the final composite.
To understand and evaluate the role of SiO2 on the capacitive character of an rGE based PANI electrode, it is necessary to figure out the role of SiO2 on the corresponding electrochemical behaviors of rGES first. Fig. 7a gives the cyclic voltammetry (CV) of rGES electrodes with different SiO2 mass ratios. The nearly rectangular CV curves of rGES demonstrate the electric double layer capacitor character,49 covering all proportions of SiO2 ranging from 5 wt% to 87.5 wt% at the scan rate of 10 mV s−1. The CV curves of rGES-50 wt% at different scan rates from 1 to 100 mV s−1 (Fig. 7b) also indicate the efficient charge transfer and the nearly ideal capacitive behaviors. Although non-conductive and non-electrochemically active, SiO2 is helpful to enhance the electrochemical response of rGE when added to less than 50 wt% (Fig. 7c) in rGES. However, it was observed that the specific capacitance of rGES decreased below the value of rGE when the amount of SiO2 exceeds 50 wt% in rGES (Fig. 7d). That is because the conductivity of SiO2 is poor, which is harmful to the whole electron transport of rGESP. Therefore, the role of SiO2 on the capacitive character of rGES is adjustable and positive with suitable SiO2 mass ratios (≤50 wt%).
 | ||
| Fig. 7 (a) CV curves of rGES with different mass ratios of SiO2 at the scan rate of 10 mV s−1. (b) CV for GES-50 wt% at different scan rates ranging from 1 to 100 mV s−1. (c) Enlarged view of (a) for rGES ≤ 50 wt% and rGE at a scan rates of 10 mV s−1. (d) Enlarged view of (a) for rGES > 50 wt% and rGE at a scan rates of 10 mV s−1. | ||
The specific capacitance (Cs) from the CV can be calculated by using the formula50 (1)
 | (1) |
 | ||
| Fig. 8 (a) The specific capacitance of rGES as a function of the mass ratio of SiO2 in rGES. (b) Specific capacitance of rGESP as a function of the rGES ratio in rGESP. (c) CV curves of rGE, rGES-10 wt%, rGEP, and rGESP at the scan rate of 1 mV s−1. (d) CV curves of rGESP (with 2 wt% of rGES) at different scan rates 1–10 mV s−1. | ||
Since rGES-10 wt% exhibits the best specific capacitance value among all the ratios, it was chosen and introduced into PANI instead of rGE to fabricate a series of rGESP hybrid materials. The mass ratio of rGES in rGESP in our experiments ranges from 0.56 wt% to 90.91 wt%. CV calculations indicated that the specific capacitance of the PANI electrode increases sharply after introducing a small amount of rGES (Fig. 8b). A peak Cs value of 555 F g−1 for rGESP was obtained at the rGES loading of 2 wt%, much higher than that of 381 F g−1 and 205 F g−1 for rGE/polyaniline (rGEP) and PANI at a scan rate of 1 mV s−1. That is to say, a small amount of rGES addition is beneficial for the capacitance improvement for PANI, while 2–5 wt% are the best ratios, corresponding to a SiO2 percent of 0.2–0.5 wt%. The improvements can be well maintained to different extents as the rGES ratio increases to a critical point at 50 wt%, and afterwards, the advantage disappears due to excess electrochemically inactive SiO2.
The CV curves of rGE, rGES-10 wt%, rGEP and rGESP are compared and shown in Fig. 8c. A larger area of the closed CV loop is observed in rGESP, indicating the specific capacitance is higher than rGES, rGEP and rGE. A pair of redox peaks (the oxidation peak at about +0.2 V and the reduction peak at about +0.05 V) existed in rGEP and can also be found in rGESP at similar positions. The redox peaks of rGESP can be ascribed to a comprehensive effect of the changes in the PANI structures and the remaining oxygenated groups of rGE or in rGES. From the shape of the curves, we can see that rGESP retains not only the EDLC of rGES but also the pseudocapacitance of PANI. Moreover, compared with rGEP, rGESP shows a larger area, indicating a better effect of rGES than rGE in improving the capacitance character of PANI supercapacitors. An obvious peak for rGESP with 2 wt% of rGES can be seen in Fig. 8d. The peak current density increases as the scan rate grows, and the shape of the CV curve does not change, exhibiting a good rate property.
To further understand the effect of rGES integration, the galvanostatic charge/discharge curves of rGES, PANI and rGESP were tested using a three-electrode system in 1 M H2SO4. As shown in Fig. 9a, the galvanostatic charge–discharge curve of PANI exhibits asymmetric triangular shapes, signifying the existence of pseudocapacitance and double layer capacitance in PANI. The observed pseudocapacitance originates from the oxidation–reduction of PANI chains. Compared with PANI, rGES-10 wt% shows a more symmetrical shape (Fig. 9b), implying a greater proportion of double layer capacitance and less proportion of pseudocapacitance. The relative symmetrical charge–discharge shape of rGES is consistent with its CV curves. In rGES, the residual oxygen groups of graphene provided pseudocapacitance while the carbon skeleton and SiO2 provided double layer capacitance. The observed pseudocapacitance and double layer capacitance in PANI and rGES accordingly emerged in the curves of rGESP (Fig. 9c and d) at five different current densities. While a deviation from a symmetrical triangular shape was also observed in the curves of rGESP, revealing the combination of the EDL capacitance with faradaic capacitance, which is in agreement with the results obtained from the CV of rGESP in Fig. 8c and d.
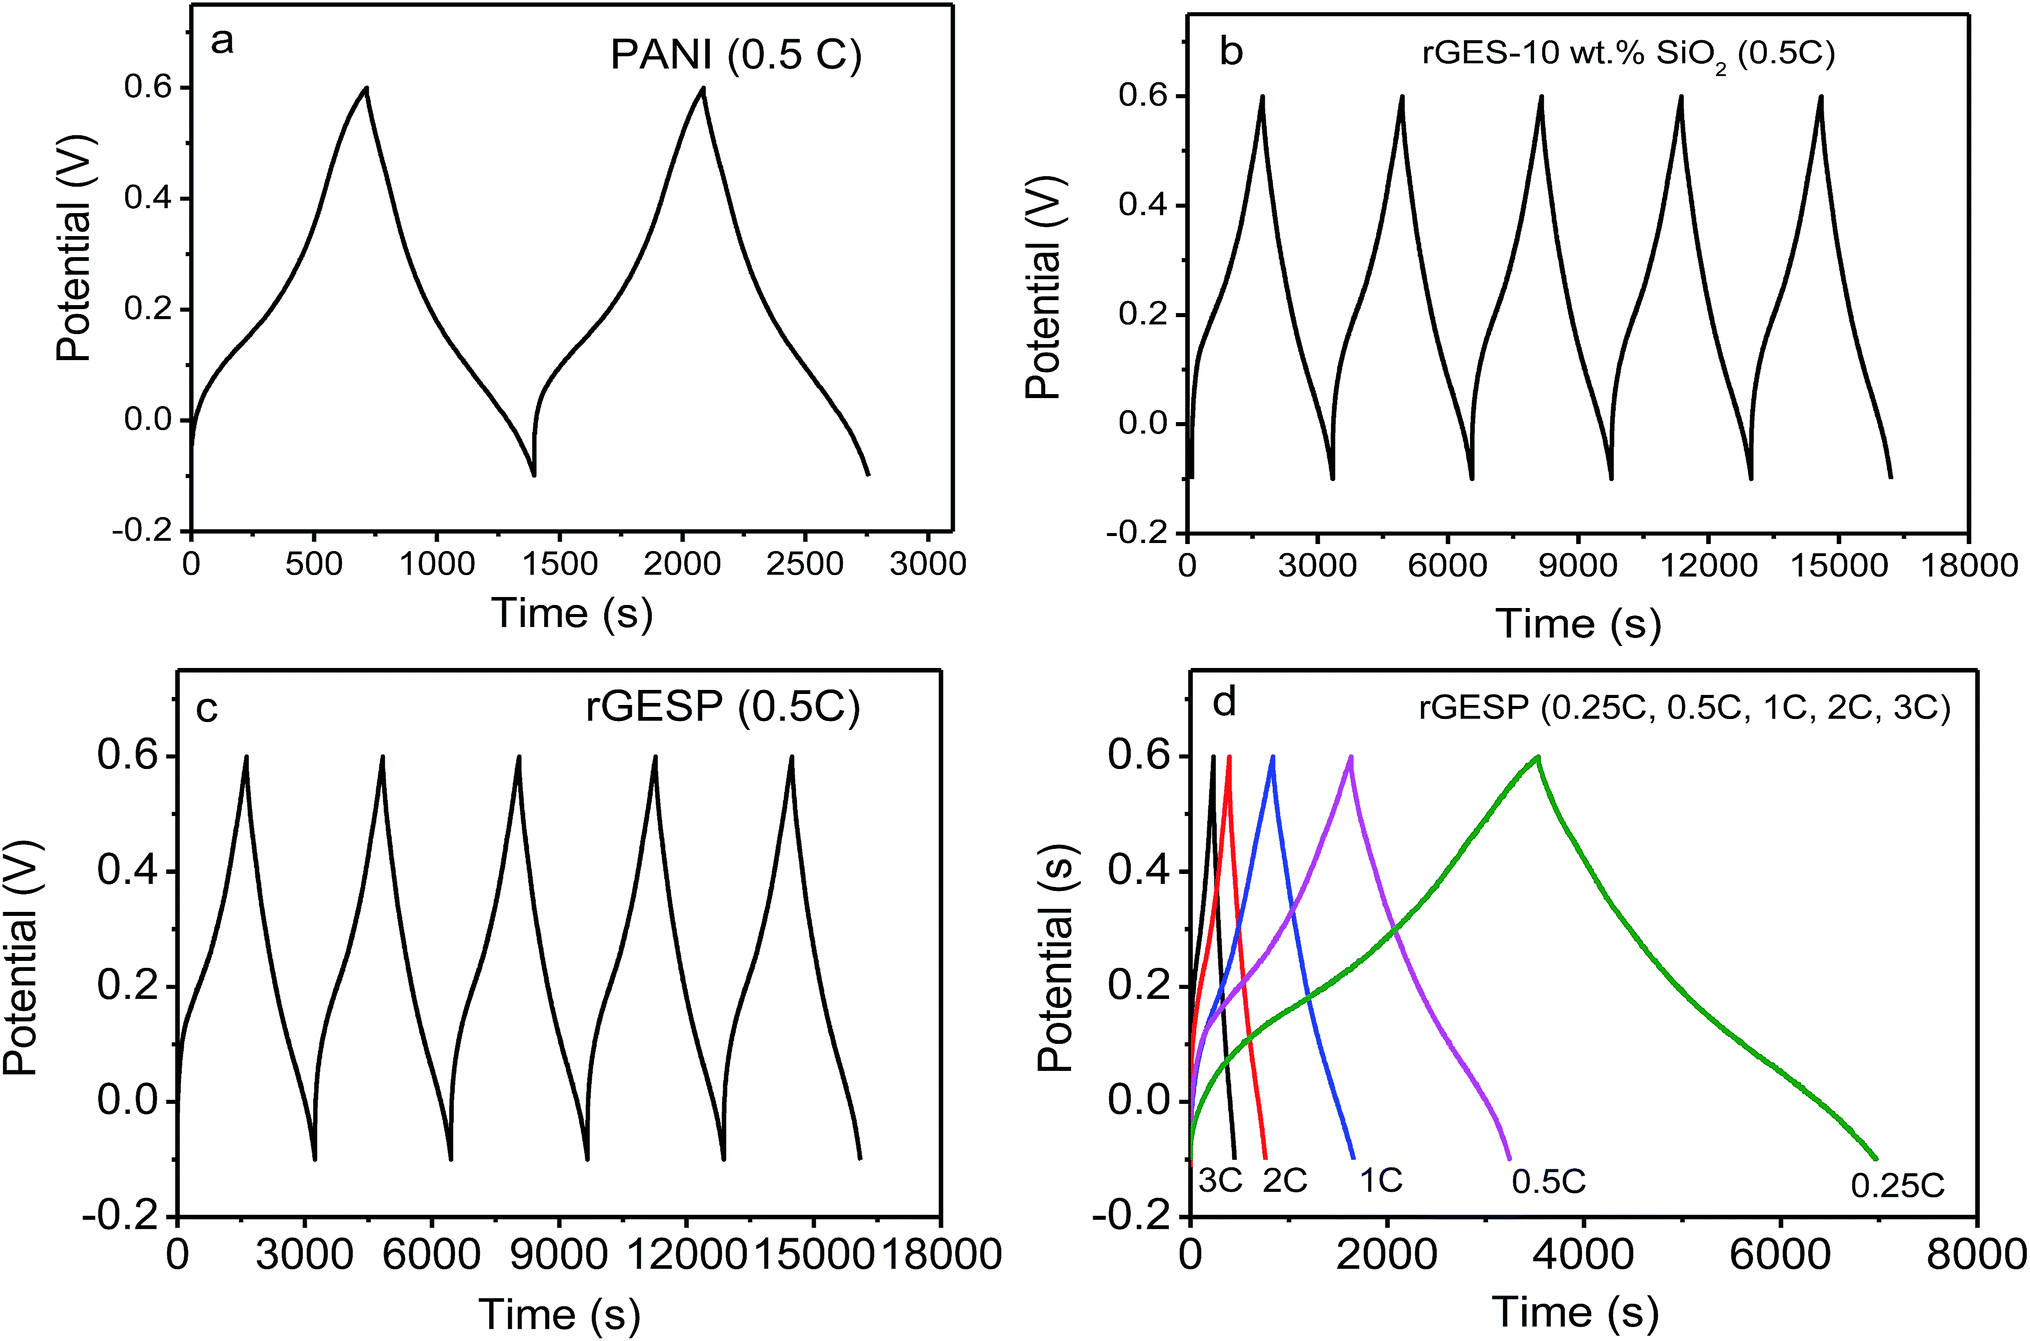 | ||
| Fig. 9 Galvanostatic charge/discharge curves of (a) PANI, (b) rGES-10 wt% SiO2, (c) rGESP at 0.1 A g−1 for the beginning several cycles and (d) rGESP at different current densities in 1 M H2SO4. | ||
As mentioned above, rGES exhibits a 2D lamellar structure when the SiO2 ratio is lower than rGE. Interestingly, the lamellar rGES hides in the TEM images of rGESP and becomes difficult to identify as the ratio of rGES is very low (2 wt%). Instead, the observed TEM images are mainly attributed to PANI, the morphology of rGESP mainly shows the characters of PANI other than rGES (Fig. 10a and b). Two typical morphologies, spherical and fibrous PANI, can be seen as interconnected states in rGESP-2 wt%, which was prepared in ethanol/water mixed solvents. The two different morphology patterns are speculated and probably correspond to the two different solvent micro-environments: ethanol and water. Moreover, based on further observations, we believe that rGES possibly exists at the junctions between the spherical and fibrous PANI in the rGESP composites, as shown in the blue circle of Fig. 10b. This kind of connecting perhaps helps preventing or reducing the chance of direct contact between spherical and fibrous PANI, and thus, weakens the excessive winding tendency between them.
 | ||
| Fig. 10 TEM images of (a and b) rGEPS and (c and d) rGES. TEM images of PANI prepared in (e and f) ethanol and (g and h) PANI. | ||
In order to verify the proposed speculations and further reveal the morphology formation conditions of rGESP, we prepared rGESP in pure ethanol and water. Fig. 10c and d are the images of rGES-10 wt% for comparison. Fig. 10e, f, g and h show the morphology of rGESP prepared in pure ethanol and water, respectively. For comparison, one can see that PANI mainly exhibits a fibrous character (Fig. 10e and f) when prepared in pure ethanol and shows a spherical shape in rGESP when fabricated in pure water (Fig. 10g and h). A small amount of lamellar rGE is inlaid in fibrous or spherical PANI structures. The observations are consistent with proposed speculations.
The improved specific capacitance of rGESP may be partly attributed to the morphology changes and the synergy of materials. In particular, multiple dimensions including 0D, 1D and 2D of materials simultaneously exist in the rGESP matrix. The assembly of these multiple dimensions produces great quantities of contact gaps, forming porous structures, including micro and nano open-channels. The special porous architecture can not only make full use of the high specific area of rGE, SiO2 and PANI nanoparticles, but also can provide abundant ion transfer paths, increasing the specific capacitance of rGESP.
Fig. 11a shows the Nyquist plots of rGE, rGES, PANI and rGESP tested in 1 M H2SO4 to further assess the effect of rGES on the capacitive energy storage of PANI. The high frequency intercepts of the real axis give the magnitude of the electrolyte resistance (Rs),51 and the solution resistances for the three electrodes are almost the same. The diameter of the semicircle in the high frequency region gives an indication of charge transfer resistance (Rct).52,53 Compared with PANI, rGE, rGES and rGESP show smaller diameters, which indicate smaller electron transfer resistance. At low frequency, the line of rGESP is more perpendicular to the real axis than those of rGE, rGES and PANI, indicating a better capacitive behavior,54 which is consistent with the outcomes of the CV tests. These improvements may be due to the synergistic effects of rGES and PANI, leading to a better capacitive performance for supercapacitors. Moreover, the integration of nanoscale SiO2 also increases the ion accessibility on the electrode surface by forming voids between rGE and PANI.
 | ||
| Fig. 11 (a) EIS of rGE, rGES, PANI and rGESP. (b) The Cs retention proportion of rGEP, PANI and rGESP (0.5 wt% SiO2) at 0.1 A g−1 during 1500 cycles, (c) Ragone plots of rGE, rGES, PANI, rGEP and rGESP electrodes. All data were obtained in 1 mol L−1 H2SO4. | ||
Furthermore, rGESP shows improved cycling stability, retaining 91% of the initial performance after 1500 charge/discharge cycles (Fig. 11b). It is much higher than that of PANI (11%, 500 cycles) and rGEP (79%). The rapid decline of PANI in cycling performance can be ascribed to the cross aggregation of PANI chains during repeated swelling/shrinkage (doping/de-doping) in the cycling process. Despite the contraction and expansion that still exists in rGESP, the cross agglomeration of PANI caused by swelling/shrinkage is suppressed greatly by rGES. Moreover, the integration of SiO2 helps to increase the ion accessibility on the electrode surface by forming voids between rGE and PANI. Thus, rGES is demonstrated to be able to improve the cycling life of PANI based supercapacitors.
The energy density and power density of the electrode materials can be calculated by eqn (2) and (3).55,56
 | (2) |
 | (3) |
4. Conclusions
Microstructure designable rGES were prepared and demonstrated to be a multifunctional material with potential applications in silicone enhancement and polyaniline based supercapacitors. Generally, the relative content of SiO2 and rGE largely impacts the microstructure of rGES and further determines the final functions. On the one hand, lamellar rGES shows a positive impact on the polyaniline supercapacitors with longer cycling life due to better structural stability. On the other hand, sandwich-like rGES mainly acts as a favorable reinforcing filler for silicone matrixes, exhibiting improved mechanical strength for the rGE due to better compatibility and dispersion. Moreover, 3D dendritic rGES plays the role of a demarcation point, exhibiting both electrical storage and mechanical enhancing properties, though not the best point. Based on these, one can easily obtain the required functions by regulating the microstructure of rGES and the preparation conditions of the corresponding polymer matrixes.Acknowledgements
This work was supported by the National Natural Science Foundation of China (No. 21303036, 51303069, 21576138 and 51572125), Zhejiang Provincial Natural Science Foundation of China (LQ13B040002, LY14E030010), Start-up Fund of Hangzhou Normal University (2012QDL021), the Fundamental Research Funds for the Central Universities of China (No. 30920130111003 and 30920140122003), Program for NCET-12-0629, the Ph. D. Programs Foundation of Ministry of Education of China (No. 20133219110018), Qing Lan Project and Six Major Talent Summit (XNY-011), the Science and Technology Support Plan (No. BE2013126), and PAPD of Jiangsu Province, China.Notes and references
- N. Behabtu, C. C. Young, D. E. Tsentalovich, O. Kleinerman, X. Wang, A. W. K. Ma, E. A. Bengio, R. F. ter Waarbeek, J. J. de Jong, R. E. Hoogerwerf, S. B. Fairchild, J. B. Ferguson, B. Maruyama, J. Kono, Y. Talmon, Y. Cohen, M. J. Otto and M. Pasquali, Science, 2013, 339, 182–186 CrossRef CAS PubMed.
- K. Evanoff, J. Benson, M. Schauer, I. Kovalenko, D. Lashmore, W. J. Ready and G. Yushin, ACS Nano, 2012, 6, 9837–9845 CrossRef CAS PubMed.
- R. F. Gibson, Compos. Struct., 2010, 92, 2793–2810 CrossRef.
- Z. F. Jiang, D. L. Jiang, Z. X. Yan, D. Liu, K. Qian and J. M. Xie, Appl. Catal., B, 2015, 170, 195–205 CrossRef.
- V. L. Reena, C. Pavithran, V. Verma and J. D. Sudha, J. Phys. Chem. B, 2010, 114, 2578–2585 CrossRef CAS PubMed.
- L. L. Chen, Y. Liu, Y. Zhao, N. Chen and L. T. Qu, Nanotechnology, 2016, 27 Search PubMed.
- K. H. S. Iessa, Y. Zhang, G. A. Zhang, F. Xiao and S. Wang, J. Power Sources, 2016, 302, 92–97 CrossRef.
- X. Hu, M. Tian, L. Qu, S. Zhu and G. Han, Carbon, 2015, 95, 625–633 CrossRef CAS.
- C.-L. Huang, C.-C. Huang, F.-D. Mai, C.-L. Yen, S.-H. Tzing, H.-T. Hsieh, Y.-C. Ling and J.-Y. Chang, J. Mater. Chem. B, 2015, 3, 651–664 RSC.
- L. Huang, Z. Zhang, Z. Li, B. Chen, X. Ma, L. Dong and L.-M. Peng, ACS Appl. Mater. Interfaces, 2015, 7, 9581–9588 CAS.
- S. Jang, E. Hwang, Y. Lee, S. Lee and J. H. Cho, Nano Lett., 2015, 15, 2542–2547 CrossRef CAS PubMed.
- P. Bhattacharya, S. Dhibar, G. Hatui, A. Mandal, T. Das and C. K. Das, RSC Adv., 2014, 4, 17039–17053 RSC.
- A. Bhirud, S. Sathaye, R. Waichal, C.-J. Park and B. Kale, J. Mater. Chem. A, 2015, 3, 17050–17063 CAS.
- A. Du, Z. Zhu and S. C. Smith, J. Am. Chem. Soc., 2010, 132, 2876–2877 CrossRef CAS PubMed.
- Y. Fu, Q. Chen, M. He, Y. Wan, X. Sun, H. Xia and X. Wang, Ind. Eng. Chem. Res., 2012, 51, 11700–11709 CrossRef CAS.
- N. Youngblood, Y. Anugrah, R. Ma, S. J. Koester and M. Li, Nano Lett., 2014, 14, 2741–2746 CrossRef CAS PubMed.
- J. Yan, Y. Ding, C. Hu, H. Cheng, N. Chen, Z. Feng, Z. Zhang and L. Qu, J. Mater. Chem. A, 2014, 2, 16786–16792 CAS.
- X. Zhang, D. Liu, L. Yang, L. Zhou and T. You, J. Mater. Chem. A, 2015, 3, 10031–10037 CAS.
- Z. Zhang, Y. Dong, F. Xiao and S. Wang, RSC Adv., 2015, 5, 83480–83485 RSC.
- D. Yu, L. Wei, W. Jiang, H. Wang, B. Sun, Q. Zhang, K. Goh, R. Si and Y. Chen, Nanoscale, 2013, 5, 3457–3464 RSC.
- M. Yusuf, F. M. Elfghi, S. A. Zaidi, E. C. Abdullah and M. A. Khan, RSC Adv., 2015, 5, 50392–50420 RSC.
- X. Yao, W. Yu, X. Xu, F. Chen and Q. Fu, Nanoscale, 2015, 7, 3959–3964 RSC.
- C. Wang, X. He, Y. Shang, Q. Peng, Y. Qin, E. Shi, Y. Yang, S. Wu, W. Xu, S. Du, A. Cao and Y. Li, J. Mater. Chem. A, 2014, 2, 14994–15000 CAS.
- T.-N. Ye, W.-J. Feng, B. Zhang, M. Xu, L.-B. Lv, J. Su, X. Wei, K.-X. Wang, X.-H. Li and J.-S. Chen, J. Mater. Chem. A, 2015, 3, 13926–13932 CAS.
- Q. L. Hao, H. L. Wang, X. J. Yang, L. D. Lu and X. Wang, Nano Res., 2011, 4, 323–333 CrossRef CAS.
- H. L. Wang, Q. L. Hao, X. J. Yang, L. D. Lu and X. Wang, Electrochem. Commun., 2009, 11, 1158–1161 CrossRef CAS.
- H. L. Wang, Q. L. Hao, X. J. Yang, L. D. Lu and X. Wang, ACS Appl. Mater. Interfaces, 2010, 2, 821–828 CAS.
- H. L. Wang, Q. L. Hao, X. J. Yang, L. D. Lu and X. Wang, Nanoscale, 2010, 2, 2164–2170 RSC.
- X. F. Xia, Q. L. Hao, W. Lei, W. J. Wang, H. L. Wang and X. Wang, J. Mater. Chem., 2012, 22, 8314–8320 RSC.
- S. Wu, R. B. Ladani, J. Zhang, E. Bafekrpour, K. Ghorbani, A. P. Mouritz, A. J. Kinloch and C. H. Wang, Carbon, 2015, 94, 607–618 CrossRef CAS.
- Y. Xue, Y. Liu, F. Lu, J. Qu, H. Chen and L. Dai, J. Phys. Chem. Lett., 2012, 3, 1607–1612 CrossRef CAS PubMed.
- L. Yang, S. L. Phua, C. L. Toh, L. Zhang, H. Ling, M. Chang, D. Zhou, Y. Dong and X. Lu, RSC Adv., 2013, 3, 6377–6385 RSC.
- Y.-K. Yang, C.-E. He, R.-G. Peng, A. Baji, X.-S. Du, Y.-L. Huang, X.-L. Xie and Y.-W. Mai, J. Mater. Chem., 2012, 22, 5666–5675 RSC.
- L.-F. Zhang and C.-Y. Zhang, Nanoscale, 2014, 6, 1782–1789 RSC.
- M. Zhang, R. Li, X. Chang, C. Xue and X. Gou, J. Power Sources, 2015, 290, 25–34 CrossRef CAS.
- Z. Zhang, F. Xiao, Y. Guo, S. Wang and Y. Liu, ACS Appl. Mater. Interfaces, 2013, 5, 2227–2233 CAS.
- B. Zhao, Y. Zheng, F. Ye, X. Deng, X. Xu, M. Liu and Z. Shao, ACS Appl. Mater. Interfaces, 2015, 7, 14446–14455 CAS.
- R. Kumar, J.-H. Oh, H.-J. Kim, J.-H. Jung, C.-H. Jung, W. G. Hong, H.-J. Kim, J.-Y. Park and I.-K. Oh, ACS Nano, 2015, 9, 7343–7351 CrossRef CAS PubMed.
- S. Liu, Y. Dong, C. Zhao, Z. Zhao, C. Yu, Z. Wang and J. Qiu, Nano Energy, 2015, 12, 578–587 CrossRef CAS.
- R. K. Upadhyay, N. Soin and S. S. Roy, RSC Adv., 2014, 4, 3823–3851 RSC.
- G. Wang, G. Chen, Z. Wei, X. Dong and M. Qi, Mater. Chem. Phys., 2013, 141, 997–1004 CrossRef CAS.
- K. Yao, J. Gong, N. Tian, Y. Lin, X. Wen, Z. Jiang, H. Na and T. Tang, RSC Adv., 2015, 5, 31910–31919 RSC.
- W. Ye, L. Zhang and C. Li, RSC Adv., 2015, 5, 25450–25456 RSC.
- J. Chen, Y. R. Li, L. Huang, C. Li and G. Q. Shi, Carbon, 2015, 81, 826–834 CrossRef CAS.
- X. L. Wang and W. Q. Dou, Thermochim. Acta, 2012, 529, 25–28 CrossRef CAS.
- R. Gusain, H. P. Mungse, N. Kumar, T. R. Ravindran, R. Pandian, H. Sugimura and O. P. Khatri, J. Mater. Chem. A, 2016, 4, 926–937 CAS.
- H. V. Kumar, S. J. Woltornist and D. H. Adamson, Carbon, 2016, 98, 491–495 CrossRef CAS.
- W. L. Xie and L. B. Hu, Food Chem., 2016, 197, 92–99 CrossRef CAS PubMed.
- N. Parveen, M. O. Ansari and M. H. Chot, Ind. Eng. Chem. Res., 2016, 55, 116–124 CrossRef CAS.
- J. J. Liu, Y. F. Deng, X. H. Li and L. F. Wang, ACS Sustainable Chem. Eng., 2016, 4, 177–187 CrossRef CAS.
- W. Wang, Q. Hao, W. Lei, X. Xia and X. Wang, J. Power Sources, 2014, 269, 250–259 CrossRef CAS.
- W. B. Fu, Y. L. Wang, W. H. Han, Z. M. Zhang, H. M. Zha and E. Q. Xie, J. Mater. Chem. A, 2016, 4, 173–182 CAS.
- Y. S. Fu, Q. Chen, M. Y. He, Y. H. Wan, X. Q. Sun, H. Xia and X. Wang, Ind. Eng. Chem. Res., 2012, 51, 11700–11709 CrossRef CAS.
- W. Q. Zhao, S. S. Wang, C. H. Wang, S. T. Wu, W. J. Xu, M. C. Zou, A. Ouyang, A. Y. Cao and Y. B. Li, Nanoscale, 2016, 8, 626–633 RSC.
- Q. Y. Lv, S. Wang, H. Y. Sun, J. Luo, J. Xiao, J. W. Xiao, F. Xiao and S. Wang, Nano Lett., 2016, 16, 40–47 CrossRef CAS PubMed.
- Q. Hao, X. Xia, W. Lei, W. Wang and J. Qiu, Carbon, 2015, 81, 552–563 CrossRef CAS.
- Z. H. Zhao, G. F. Richardson, Q. S. Meng, S. M. Zhu, H. C. Kuan and J. Ma, Nanotechnology, 2016, 27 Search PubMed.
- X. Xia, W. Lei, Q. Hao, W. Wang and X. Wang, Electrochim. Acta, 2013, 99, 253–261 CrossRef CAS.
| This journal is © The Royal Society of Chemistry 2017 |