 Open Access Article
Creative Commons Attribution 3.0 Unported Licence
A highly selective and sensitive fluorescent probe for lactate dehydrogenase based on ultrabright adenosine monophosphate capped gold nanoclusters†
Jiao Liu,
Hong-Wei Li * and
Yuqing Wu
 *
*
State Key Laboratory of Supramolecular Structure and Materials, Institute of Theoretical Chemistry, Jilin University, No. 2699 Qianjin Street, Changchun 130012, China. E-mail: lihongwei@jlu.edu.cn; yqwu@jlu.edu.cn
First published on 28th February 2017
Abstract
Ultrabright adenosine monophosphate (AMP) capped gold nanoclusters (AuNCs@AMP) were used as a novel fluorescent probe to detect lactate dehydrogenase (LDH), an important biomarker of common injuries and diseases. The fluorescence emission of AuNCs@AMP is quenched linearly in the presence of a wide concentration range of LDH (50–1000 nM), covering the range for clinical diagnosis. Particularly, the detection is very sensitive with an extremely low detection limit of 0.2 nM (26 pg μL−1, 0.8 U L−1), being more sensitive than the previously reported ones. However, the proposed probe does not response to other commercially available proteins with different isoelectric points, which shows a high selectivity toward LDH. In addition, the response mechanism is also investigated in detail, where the quenching response is attributed to the binding of AuNCs to the free thiol groups at the LDH surface. Therefore, the present study supplies a cost-effective, fast and easily performed approach to detect LDH with high selectivity and sensitivity, which has potential use in clinical diagnosis in future.
Introduction
Gold nanoclusters (AuNCs) have become one of the most important nanomaterials and attracted considerable attention due to their remarkable optical properties,1–4 as well as low toxicity, extremely small size, good biocompatibility, excellent chemical and photochemical stability, and other fascinating features.5,6 These properties endow them with the potential to be used as a new class of fluorophores in fluorescence bio-sensing and bio-imaging in place of quantum dots and organic chromophores.7 In fact, AuNCs have been widely applied to versatile bio-sensing ranging from in vitro to cellular detection and in vivo targeting and imaging.6,8 For example, Qiao et al. have utilized folic acid as the targeting ligand to modify AuNCs and applied them in HeLa cell imaging.9 An et al. have extended the biomedical applications of AuNCs through functionalizing them with special peptides and applying the AuNCs to inhibit the reductive activity of TrxR1.10 Zhang et al. have prepared AuNCs with tunable optical properties and applied them in the sensing of ions and in fluorescent inks.11 Although there have been a lot of achievements in the synthesis, modification and application of AuNCs, some challenges are still outstanding, for example, the relatively low quantum yield (QY, <10%),12,13 the limited application in biological systems, especially, in clinical diagnosis and so on,5 which need to be improved and explored urgently.Lactate dehydrogenase (LDH) is an ubiquitously expressed enzyme in animals, plants, and prokaryotes, which could be found in almost all the living tissues and cells.14,15 LDH is responsible for catalyzing the nicotinamide adenine dinucleotide phosphate-dependent conversion of pyruvate to lactate under anaerobic condition.16,17 In addition, LDH will be highly released during tissue damage so it is an important biomarker for common injuries and diseases such as heart failure, hypothyroidism, anemia, meningitis, acute pancreatitis, lung or liver disease and so on.18,19 Though an assay kit for LDH has been produced and widely used in clinical diagnosis, it is expensive and cannot be stored for a long time at 4 °C (<1 week); otherwise, it will be inactivated and show inveracious detection results.20 Therefore, the development of new methods is critically needed for LDH detection.
Recently, we have developed ultrabright adenosine 5′-monophosphate (AMP) capped AuNCs (AuNCs@AMP), showing a very high quantum yield (QY, 14.52%). Herein, the AuNCs@AMP are used to quantitatively detect LDH in a wide concentration range (50–1000 nM) with a very low limit of detection at 0.2 nM (26 pg μL−1, 0.8 U L−1) and high selectivity. Especially, the proposed method could also be used to detect LDH in diluted fetal calf serum with good linear response. In addition, the response mechanism has been investigated in detail, which will be very helpful to develop new fluorescent probes for clinical purposes.
Methods
Chemical
Adenosine 5′-monophosphate (AMP) is bought from TCI (Shanghai) Development Co., Ltd. and its purity is higher than 99%. HAuCl4, citrate, NaH2PO4 and Na2HPO4 are purchased from Beijing Chemical Factory (China) and the purities of them are higher than 99%. L-Lactate dehydrogenase from rabbit muscle (rLDH) is bought from Shanghai Ryon Biological Technology Co. Ltd. Bovine serum albumin (BSA), human serum albumin (HSA) and lysozyme are obtained from Gen-View Scientific Inc (USA). Trypsin is purchased from Amresco LLC (USA), and α-chymotrypsin A (CTRA) is bought from Sigma-Aldrich Co. LLC. All the proteins are obtained as lyophilized powders, and all stock solutions of them are prepared in 20 mM phosphate buffer solution (PBS, pH = 7.4). The fetal calf serum is obtained from Beijing Solarbio Science & Technology Co., Ltd (China). Other chemicals are obtained from commercial suppliers and used without further purification. Distill water (ρ = 18.2 MΩ cm, 25 °C) is obtained from a Millipore Milli-Q water purification system. And 20 mM phosphate buffer solution (PBS, pH = 7.4) is prepared with 20 mM NaH2PO4 and Na2HPO4 in aqueous solution.Fluorescence spectra
Fluorescence spectra are recorded on a Shimadzu (Japan) RF-5301PC spectrophotometer. To reduce the fluctuation of excitation intensity during measurement, the lamp is kept on for 0.5 h. All spectroscopic measurements of AuNCs are performed in 20.0 mM PBS (pH = 7.4), and the concentrations of AuNCs in the fluorescent experiments are fixed at 3.0 and 0.30 mg L−1, respectively, for different purposes, and an excitation wavelength at 328 nm is used.The temperature is controlled by using constant temperature liquid circulating device. The limit of detection (LOD) is detected by using a low concentration of AuNCs@AMP (0.30 mg L−1), and calculated through 3-fold standard deviation of the blank intensity corresponding to the concentration of rLDH at the linear response in the plot of fluorescence intensity vs. the concentration of rLDH. The concentration of AuNCs@AMP in stock solution is 300 mg L−1, and that of all proteins are 100 μM, respectively, which are stored at 4 °C in dark before use.
UV-vis absorption spectra
The UV-vis absorption spectra are recorded on a Shimadzu UV-3600 spectrophotometer, and all measurements are performed in 1 cm × 1 cm quartz cuvettes (4 mL volume). To reduce the fluctuation of intensity in the measurement, the lamp is kept on for 0.5 h before use. As the absorption of AuNCs@AMP is very weak, high concentrations of AuNCs@AMP (15 and 30 mg L−1) are used to detect the UV-vis absorption spectrum for rLDH and GSH, respectively.Results and discussion
The detection of L-lactate dehydrogenase from rabbit muscle (rLDH) by AuNCs@AMP
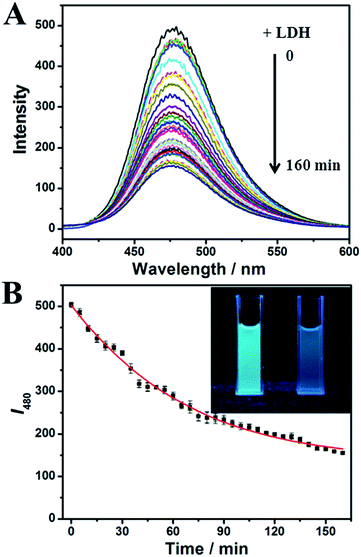
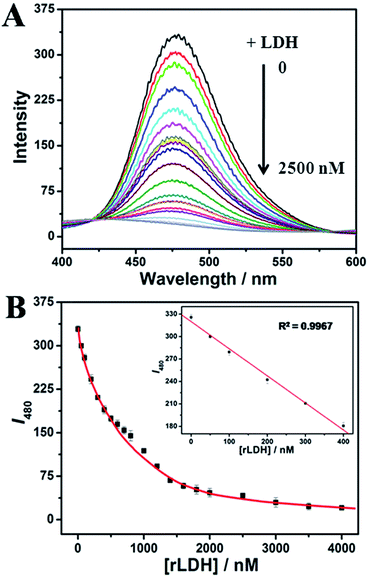
In the previous study we had obtained an ultrabright AuNCs@AMP, which contained a strong emission at 480 nm under excitation. The prepared AuNCs@AMP are characterized firstly by employing the transmission electron microscopy (TEM) and X-ray photoelectron spectroscopy (XPS). As shown in Fig. S1,† the Au cores are obviously observed, which show a large proportion of AuNCs was distributed between 1.40–2.15 nm, in addition the content and oxidation states of metal in samples indicated that the HAuCl4 have been reduced largely in the preparation. When apply them to detect enzyme and proteins in 20 mM phosphate buffer solution (PBS, pH = 7.4), the fluorescence emission of AuNCs@AMP was quenched obviously by L-lactate dehydrogenase from rabbit muscle (rLDH). As shown in Fig. 1A, upon excitation at 328 nm, AuNCs@AMP exhibited a strong emission band at 480 nm; in the presence of 2.0 μM rLDH the fluorescence emission of them was quenched gradually with time and resulted in a loss of near 70% intensity in accompanying with a slight blue-shift (Fig. 1B). Meanwhile, under ultraviolet light of 365 nm the blue color of solution was turned off (insert in Fig. 1B). In addition, although the fluorescence quenching response of AuNCs to rLDH required only a mild and simple condition, it needed a long time to be completed (≥160 min). Therefore, to optimize the response time a higher temperature (37 °C) was employed to perform the fluorescence response. Firstly, the fluorescence emission of AuNCs@AMP was tested by heating to 37 °C and then cooling down to room temperature through circulatory treatment (Fig. S2†). The results indicated the emission of AuNCs could be recovered well during the process, even after several circulatory treatments. Therefore, the fluorescence response of AuNCs@AMP to rLDH was conducted at 37 °C. As shown in Fig. S3,† it was observed that in the presence of 2.0 μM rLDH the emission of AuNCs decreased remarkably at first 30 min and then getting stable with time; while at room temperature it decreased slowly and could not be completed even in 160 min (Fig. 1). That indicated such response was more quickly at 37 °C than that at room temperature (Fig. S3B†). Therefore, in following we incubated the samples at 37 °C for 30 min before mixing to save time for the detection of rLDH. Furthermore, in considering the intensity was almost getting constant in 30 min after mixing, therefore, finally all the detection of AuNCs@AMP to rLDH and other proteins were carried out after incubation for 30 min at 37 °C.Then the AuNCs@AMP were used to detect rLDH in a broad concentration range. As shown in Fig. 2A, the emission intensity of the AuNCs@AMP was quenched rapidly and blue-shift slightly with the addition of rLDH. The fluorescence intensities at 480 nm were then plotted in responding to the concentration of rLDH, being positively changed in the range of 50–1000 nM (200–4000 U L−1, Fig. 2B). Meanwhile, a good linear relationship could be observed in the concentration range of 50–400 nM (inset of Fig. 2B). Therefore, the AuNCs@AMP were used to quantitatively detect rLDH in a wide concentration range. However, at the present case 3.0 mg L−1 AuNCs@AMP did not supply sensitive response to rLDH, which should be improved for further clinical application. Therefore, in following a diluted buffer solution of AuNCs@AMP (0.30 mg L−1) was used to detect rLDH, which showed a gradual quenching in the concentration range of 2.0–100 nM (8.0–400 U L−1) rLDH (Fig. S4†). And a low detection limit of 0.2 nM (26 pg μL−1, 0.8 U L−1) was achieved for rLDH (inset of Fig. S4B†), illustrating the possibility to detect trace amounts of rLDH at the present condition. Such a LOD was more sensitive than the reported ones by using molecular beacon DNA molecule,21 porous silicon microcavities,22 pyruvate and NADH as substrate,23 CdTe/CdS QDs24 and so on (Table S1†). Yang et al. had explored a highly selective fluorescent probe for LDH based on CdTe quantum dots, where the linear calibration plots of the activity of LDH were obtained from 250 to 6000 U L−1.25 And He et al. had prepared a novel enzyme sensor based on CdSe quantum dots (QDs) and polycaprolactone (PCL) composite porous fibers, where linear calibration plots of the activity of LDH were obtained from 200–2400 U L−1.26 In practice, the normal concentration of the LDH in serum is 100–300 U L−1, while higher than 1000 U L−1 would be shown for some injuries or disease.25,26 Therefore, the proposed method here was more sensitive than the previous reports for the quantitative detection of LDH, and covered all the required detection range for the clinical diagnosis. The results indicated the proposed method had a very high possibility in future application as it could be used to detect LDH in all the required concentration range.
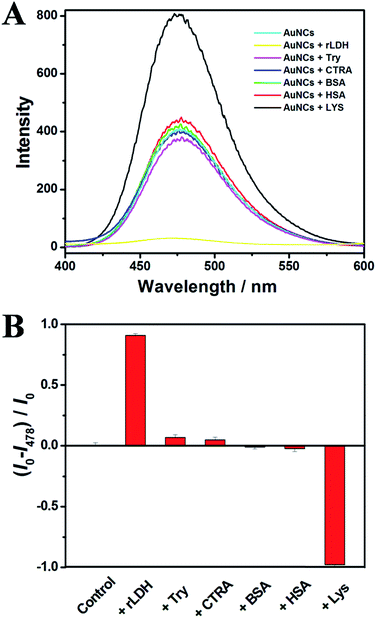
In addition, the AuNCs@AMP were then applied to detect other commercial available proteins with different isoelectric point (pI) under the identical neutral conditions, such as lysozyme (Lys), trypsin (Try) and α-chymotrypsin A (CTRA) containing high pI similar to rLDH, and bovine serum albumin (BSA), human serum albumin (HSA) containing acidic pI. As shown in Fig. 3, the titration of these proteins to the buffer solution containing AuNCs@AMP did not induce much change of the emission intensity excepting a strong fluorescence enhancement for Lys. The results indicated a high selectivity of AuNCs@AMP toward rLDH over other proteins with a fluorescent quenching response. In addition, to test the practical application of AuNCs@AMP as a selective fluorescence probe for rLDH, a competitive experiment was carried out either in mixing 2.0 μM rLDH with other proteins (2.0 μM). Though somewhat interference of the rLDH detection could not be ignored in the presence of these proteins, it observed the quenching response for all the mixture which induced by the addition of rLDH (Fig. S5†). Therefore, the proposed method did not show a strong anti-interference capability, which should be improved in future.
Response mechanism of AuNCs@AMP to rLDH
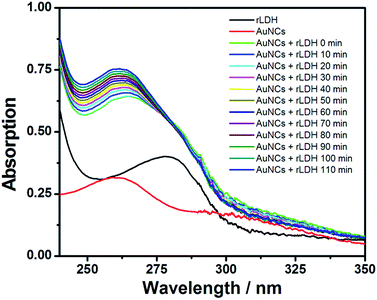
The response mechanism of AuNCs@AMP to rLDH was then studied in detail. Firstly, the UV-vis absorption spectrum was employed to monitor the response in PBS (20 mM, pH = 7.4). As shown in Fig. 4, the absorption peaks at ∼300 nm was decreased while that at ∼260 nm was increased and blue-shift in the presence of rLDH, showing an isoabsorptive point at 279 nm. Such phenomena indicated that the surface electron energy of AuNCs was changed with the incorporation of rLDH. Then the effect of free thiol groups in rLDH was studied, as the thiol group was often observed to quench the emission of AuNCs.27–29 Firstly, glutathione (GSH) was used as a model molecule to interact with AuNCs@AMP, which indeed induced a large emission quenching of AuNCs with time (Fig. S6†) and suggested the free thiol group in rLDH might play an important role for the quenching response. In following, the UV-vis absorption spectra were also measured to monitor the quenching response of AuNCs to GSH. As shown in Fig. S7,† upon the addition of different amounts of GSH the absorption peaks around 300 nm decreased while that at ∼260 nm increased gradually, showing a similar absorptive point at 274 nm as rLDH. The fluorescence and UV-vis absorption spectra changes were very similar as the response of AuNCs@AMP to rLDH, which might be caused by a similar mechanism. It had been reported that the AuNCs could be etched as an Au–thiol coordination complex and finally resulted in an electron injection from ligand molecules to AuNCs.5,8,30 Therefore, the observed quenching response to AuNCs were consistent well to the previous reports of GSH etching. That was, the present quenching response of AuNCs@AMP to rLDH was also attributed to the etching mechanism.In following, an agent, 2-maleimidoacetic acid,31,32 was introduced to the system to shield the free thiol group of rLDH. It was observed that the modified rLDH could not quench the emission of AuNCs at all excepting some fluorescence enhancement (Fig. S8†), which confirmed the key role of free thiol groups of rLDH in responding to the quenching indeed. However, it was interesting to observe that although the BSA contained either a free thiol group it could not quench the emission of AuNCs at all. Such result suggested other factors, such as the position of the free thiol group from the surface, the microenvironment around it were also very important for the quenching response. Therefore, the results indicated that the free thiol group in rLDH was a prerequisite, but not a sufficient condition for the quenching response; while, the microenvironment of thiol group might be more important for the response. Therefore, the response mechanism of AuNCs@AMP to rLDH could be attributed to the free thiol groups in the rLDH, especially, to the microenvironment of it closed to the protein surface (as shown in Scheme 1). That is, the highly match between the microenvironment of thiol group and the AuNCs@AMP lead to their strong binding, which finally etched the AuNCs to be disappear and quenched the emission of AuNCs vigorously.
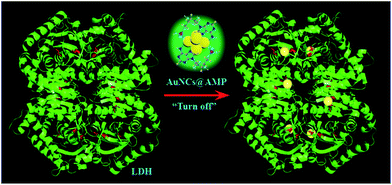 | ||
| Scheme 1 Schematic representation of the fluorescence detection strategy for rLDH by using AuNCs@AMP. The cysteines are represented with red sticks in the rLDH, which could bind to Au atoms. | ||
Finally, the AuNCs@AMP was used to detect human LDH (HLDH) at the identical condition. As shown in Fig. S9,† the fluorescence emission of the AuNCs was quenched rapidly and blue-shift slightly either with the increasing of HLDH, which indicated the proposed method with AuNCs@AMP could be extended to detect HLDH. That was, the proposed method was broad spectrum to the LDH detection, although it could not distinguish different types of LDH. Such result was not surprising as the non-specific groups of rLDH have been proposed to bind with AuNCs@AMP. Therefore, the next challenge originated from the present study would be how to develop a new method to discriminate different types of LDH.
In addition, to verify the practical application of the proposed method in clinical diagnosis, the AuNCs@AMP was then used to detect rLDH in serum. It could be observed that the emission of AuNCs was quenched directly by the gradual addition of rLDH in the diluted fetal calf serum (1% in PBS, Fig. S10†), and a good linear response could be observed (inset in Fig. S10B†) as well as a detection limit of 10 nM (40 U L−1) was achieved for rLDH. Such a response was sensitive enough to quantitatively detect rLDH in practice (the normal concentration was about 100–300 U L−1 in serum), which could be improved by using diluted AuNCs@AMP in PBS as needed. Thus, the proposed method has potential in clinical diagnosis for real blood samples from patients with some common injuries or diseases.
Conclusions
In conclusion, the obtained AuNCs@AMP was used as a fluorescence probe for LDH, which could quantitatively detect LDH in a wide concentration range and covered the scope in clinical diagnosis. Particularly, a very low detection limit of 0.2 nM (26 pg μL−1, 0.8 U L−1) was achieved for rLDH, being more sensitive than the previously reported ones for the quantitative detection of LDH. In addition, the AuNCs@AMP showed a high selectivity toward LDH over other commercially available proteins. The mechanism investigation in detail indicated such quenching response was attributed to the free thiol groups in the LDH, especially the microenvironment of it at protein surface, which finally lead to a strong binding and the formation of Au–thiol complex. Finally, the proposed method was also used to detect LDH in the diluted fetal calf serum in showing a good linear response, which suggested it would be possible for the real blood samples in clinical diagnosis. Therefore, the present study has extended the application of AuNCs to the biological system, especially, it has shown potential of application in clinical diagnosis.Acknowledgements
We greatly appreciate the financial support from the projects of NSFC (No. 21373101, 21003061 and 91027027) and the Innovation Program of the State Key Laboratory of Supramolecular Structure and Materials, Jilin University.Notes and references
- J. Zheng, P. R. Nicovich and R. M. Dickson, Annu. Rev. Phys. Chem., 2007, 58, 409–431 CrossRef CAS PubMed.
- L. Zhang and E. Wang, Nano Today, 2014, 9, 132–157 CrossRef CAS.
- G. Li and R. Jin, Acc. Chem. Res., 2013, 46, 1749–1758 CrossRef CAS PubMed.
- Y. Lu and W. Chen, Chem. Soc. Rev., 2012, 41, 3594–3623 RSC.
- M. Cui, Y. Zhao and Q. Song, Trends Environ. Anal. Chem., 2014, 57, 73–82 CrossRef CAS.
- L. Shang, S. J. Dong and G. U. Nienhaus, Nano Today, 2011, 6, 401–418 CrossRef CAS.
- J. Li, J.-J. Zhu and K. Xu, Trends Environ. Anal. Chem., 2014, 58, 90–98 CrossRef CAS.
- J. Sun and Y. Jin, J. Mater. Chem. C, 2014, 2, 8000–8011 RSC.
- J. Qiao, X. Mu, L. Qi, J. Deng and L. Mao, Chem. Commun., 2013, 49, 8030–8032 RSC.
- D. An, J. Su, J. K. Weber, X. Gao, R. Zhou and J. Li, J. Am. Chem. Soc., 2015, 137, 8412–8418 CrossRef CAS PubMed.
- J. Zhang, Y. Yuan, G. Liang, M. N. Arshad, H. A. Albar, T. R. Sobahi and S.-H. Yu, Chem. Commun., 2015, 51, 10539–10542 RSC.
- L. Shang, S. J. Dong and G. U. Nienhaus, Nano Today, 2011, 6, 401–418 CrossRef CAS.
- Y. Yu, Q. Zhang, Q. Yao, J. Xie and J. Y. Lee, Acc. Chem. Res., 2014, 47, 3530–3540 CrossRef CAS PubMed.
- R. M. Nagler, S. Lischinsky, E. Diamond, I. Klein and A. Z. Reznick, J. Lab. Clin. Med., 2001, 137, 363–369 CrossRef CAS PubMed.
- R. S. Holmes and E. Goldberg, Comput. Biol. Chem., 2009, 33, 379–385 CrossRef CAS PubMed.
- P. Gaspar, F. A. Albayati, P. W. Andrew, A. R. Neves and H. Yesilkaya, Infect. Immun., 2014, 82, 5099–5109 CrossRef PubMed.
- R. P. Kristjansson, A. Oddsson, H. Helgason, G. Sveinbjornsson, G. A. Arnadottir, B. O. Jensson, A. Jonasdottir, A. Jonasdottir, G. B. Walters, G. Sulem, A. Oskarsdottir, S. Benonisdottir, O. B. Davidsson, G. Masson, O. T. Magnusson, H. Holm, O. Sigurdardottir, I. Jonsdottir, G. I. Eyjolfsson, I. Olafsson, D. F. Gudbjartsson, U. Thorsteinsdottir, P. Sulem and K. Stefansson, Nat. Commun., 2016, 7, 10572 CrossRef CAS PubMed.
- Z. Rotenberg, I. Weinberger, E. Davidson, J. Fuchs, O. Sperling and J. Agmon, Clin. Chem., 1988, 34, 1882–1884 CAS.
- E.-C. Hu, J.-G. He, Z.-H. Liu, X.-H. Ni, Y.-G. Zheng, Q. Gu, Z.-H. Zhao and C.-M. Xiong, Exp. Ther. Med., 2015, 9, 2109–2113 CAS.
- D. Mishra, F. Aldeek, E. Lochner, G. Palui, B. Zeng, S. Mackowski and H. Mattoussi, Langmuir, 2016, 32, 6445–6458 CrossRef CAS PubMed.
- X. H. Fang, J. W. Jeff Li and W. H. Tan, Anal. Chem., 2000, 72, 3280–3285 CrossRef CAS PubMed.
- S. N. A. Jenie, B. Prieto-Simon and N. H. Voelcker, Biosens. Bioelectron., 2015, 74, 637–643 CrossRef CAS PubMed.
- Q.-J. Li, Y.-S. Li and X.-F. Gao, Anal. Sci., 2015, 31, 413–419 CrossRef CAS PubMed.
- X. L. Ren, L. Q. Yang, F. Q. Tang, C. M. Yan and J. Ren, Biosens. Bioelectron., 2010, 26, 271–274 CrossRef CAS PubMed.
- L. Yang, X. Ren, X. Meng, H. Li and F. Tang, Biosens. Bioelectron., 2011, 26, 3488–3493 CrossRef CAS PubMed.
- X. He, L. Tan, X. Wu, C. Yan, D. Chen, X. Meng and F. Tang, J. Mater. Chem., 2012, 22, 18471–18478 RSC.
- C.-Y. Ke, T.-H. Chen, L.-C. Lu and W.-L. Tseng, RSC Adv., 2014, 4, 26050–26056 RSC.
- X. Qu, Y. Li, L. Li, Y. Wang, J. Liang and J. Liang, J. Nanomater., 2015, 2015, 784097 Search PubMed.
- K. S. Park, M. I. Kim, M.-A. Woo and H. G. Park, Biosens. Bioelectron., 2013, 45, 65–69 CrossRef CAS PubMed.
- C.-Y. Ke, T.-H. Chen, L.-C. Lu and W.-L. Tseng, RSC Adv., 2014, 4, 26050–26056 RSC.
- L. Tao, C. S. Kaddis, R. R. O. Loo, G. N. Grover, J. A. Loo and H. D. Maynard, Macromolecules, 2009, 42, 8028–8033 CrossRef CAS PubMed.
- A. J. García, Ann. Biomed. Eng., 2014, 42, 312–322 CrossRef PubMed.
Footnote |
| † Electronic supplementary information (ESI) available: Additional fluorescence spectra and UV-vis absorption spectra. See DOI: 10.1039/c7ra00158d |
| This journal is © The Royal Society of Chemistry 2017 |

