 Open Access Article
Creative Commons Attribution 3.0 Unported Licence
Nitrogen-doped activated carbon/graphene composites as high-performance supercapacitor electrodes
Yue Li ,
Tong-Xin Shang,
Jian-Min Gao and
Xiao-Juan Jin*
MOE Key Laboratory of Wooden Material Science and Application, Beijing Key Laboratory of Lignocellulosic Chemistry, MOE Engineering Research Center of Forestry Biomass Materials and Bioenergy, Beijing Forestry University, 35 Qinghua East Road, Haidian, 100083, Beijing, China. E-mail: jxj0322@163.com; Tel: +86 13718160441
First published on 30th March 2017
Abstract
Nitrogen-doped activated carbon/reduced graphene oxide composites are prepared by pre-carbonization of the precursors (mixture of graphene oxide and nitrogen-doped activated carbons) and KOH activation of the pyrolysis products. Nitrogen-doped activated carbons were prepared from waste particleboard bonded with ureaformaldehyde resin adhesives. Graphene oxide was prepared from graphite according to the modified Hummers' method. The effects of the mass ratio of KOH and the precursor and the mass radio of graphene oxide in the precursor on electrochemical properties are investigated, respectively. The results demonstrated that graphene oxide as precursor was activated and reduced via high temperature and wrapped on the outer surface of the active carbon particles. The thermally reduced graphene oxide sustains the activated carbon particles as a wrinkled carrier after activation. The electrode of GO–AC–KOH 1–4–4 has achieved the highest specific capacitance of 265 F g−1 and increased 17.8% comparing with the activated carbon (225 F g−1) under a current density of 50 mA g−1 in a 7 mol l−1 KOH electrolytic solution. Moreover, the symmetrical supercapacitor show an excellent cycling stability with capacitance retention 92% of the initial capacitance after 3000 cycles at a current density of 5 A g−1. It is also found that KOH activation of disused composite panels is an efficient and straightforward approach to production of low-cost GO–AC composite for electrochemical capacitors.
1. Introduction
The growing concerns about global warming and the oil crisis have stimulated intensive development of sustainable energy economy based on renewable, high efficiency energy conversion and storage technologies. Supercapacitors are a new electrochemical energy storage system applied for harvesting energy and delivering high power in short time,1 which can fill the current gap between batteries and traditional capacitors. Simultaneously, they are known to store energy in the electrical double layer capacitors region based on ion adsorption. Besides pseudocapacitors are sometimes considered to be supercapacitors due to their fast reversible faradic reactions.2 In general, the performance of supercapacitors are mainly depend on the electrode material, which have direct relation with the performance parameters such as energy density, power density, and specific capacitor.3,4 To enhance the performance of supercapacitors, many efforts have been focused on developing new kinds of electrode materials, such as carbon nanotubes,5,6 graphene,7,8 and carbon nanotubes/graphene hybrid materials,9,10 as well as transition metal oxides11,12 and conductive polymers13–15 having pseudocapacitive behaviors. Unfortunately, up to now only activated carbon has been commercially used as supercapacitor electrode materials due to its well-developed microstructure, high specific surface area, relatively high packing density, and low cost. However, compared with batteries, the energy density of activated carbon-based supercapacitors is still significantly low due to the limited capacitance.16 As is known to all, the specific capacitance of activated carbon depends on its effective specific surface area accessible by electrolyte ions. Therefore, the activated carbon has a very large specific surface area but a disproportionate specific capacitance due to its inappropriate pore structure for ionic transport, which results in a long diffusion pathway for ions, as well as relatively low conductivity.17 These defects make activated carbon unfavorable in the process of rapid charge/discharge and for the requirement of excellent cyclability. We can enhance the effective specific surface area, maintain high packing density, control pore size distribution, reduce diffusion resistance and improve conductivity for activated carbon to obtain perfect performance.Chemically modified graphene,18 which is a one-atom-thick carbon material with carbon atom packed densely in a hexagonal honeycomb lattice, is a promising candidate for structural design because of its high electrochemical stability and excellent structural flexibility. It also has a large theoretical specific surface area of 2630 m2 g−1 and high conductivity of 10−6 Ω cm which shows promising application in supercapacitors. However, pure graphene prepared by either chemical reduction or thermal reduction of graphene oxide usually exhibits a low capacitance due to agglomeration of the graphene sheets.19 The excellent electric and surface properties of graphene sheets are not completely revealed. The dispensability of reduced graphene oxide is important because most of their unique properties are only associated with individual sheets. In the high temperature environment, the graphene oxide was reduced by the activated carbon and the reduced graphene oxide sustains the activated carbon particles as a wrinkled carrier after activation which can appropriately weaken the reduced graphene oxide agglomeration. Besides, the KOH activation method was employed to generate nanoscale pores in graphene with a high specific surface area21 which can also attenuate the reduced graphene oxide agglomeration.20
In this work, we aimed to develop a novel route for the preparation of the porous graphene/activated carbon composite material and systematically investigate the effect of the chemical activation with KOH on the graphene/activated carbon composite and the promotion of the introduction of reduced graphene oxide into activated carbon on the electrochemical performance of electrochemical supercapacitors.
2. Materials and methods
2.1 Materials
Waste medium density fiberboard containing 12% ureaformaldehyde resin adhesive of the mass was provided by Beijing Jiahekailai Furniture and Design Company. Graphene oxide was prepared by modified Hummers method and investigated by using natural flake graphite. Other chemicals of analytical grades were purchased from Beijing Lanyi Chemical reagent.2.2 Graphene oxide preparation
Graphene oxide power was prepared through a modified Hummers method. Typically, natural graphite power (3 g) and NaNO3 (1.5 g) were added into 70 ml of 98 wt% sulfuric acid and stirred in an ice bath. Subsequently, KMnO4 (9 g) was added slowly to the above mixture, and the mixture was kept in the ice bath for 2 h. Then the mixture was transferred into the water bath and kept at 35 °C for 30 min. Next, 150 ml of deionized water was gradually added into the mixture, and during this process, the temperature was maintained lower than 50 °C by controlling the speed of dripping water. After introducing water into the mixture, the temperature of the water bath was raised up to 95 °C and kept constant for 30 min. The resulting bright yellow suspension was diluted and further treated by 15 ml H2O2 (30 wt%) solution and 50 ml warm deionized water. The solid obtained by centrifugation was washed to pH about 7. The wet graphite oxide was dewatered by drying for 48 h in the oven. In the end, the sample was ground into power by ball-milling for an hour.2.3 Preparation of activated carbon
The waste particleboards as raw materials were carbonized in a high-purity nitrogen atmosphere in an electric furnace at 500 °C with a temperature increase rate of 10 °C min−1. The products after carbonization were mixed with KOH at the mass ratio of 1![[thin space (1/6-em)]](https://www.rsc.org/images/entities/char_2009.gif) :
:![[thin space (1/6-em)]](https://www.rsc.org/images/entities/char_2009.gif) 3. The sample was then activated at the temperature 800 °C for 60 min in nitrogen atmosphere. The resultant AC was washed first with hot distilled water, then 1 M HCl solution and rinsed repeatedly with hot and cold distilled water until the filtrate reached to pH = 7.
3. The sample was then activated at the temperature 800 °C for 60 min in nitrogen atmosphere. The resultant AC was washed first with hot distilled water, then 1 M HCl solution and rinsed repeatedly with hot and cold distilled water until the filtrate reached to pH = 7.
2.4 Preparation of activated carbon/graphene composites
Graphene oxide powder used in this work was obtained by chemical exfoliation of natural graphite following the modified method as described elsewhere. The experimental steps ware shown in Fig. 1. Briefly, 0.5 g of obtained GO powder and 1.0, 1.5, 2.0, 2.5 g of carbonization based on waste particleboard were firstly added into 10 ml of deionized water and then dispersed by ultrasonication with power of 300 W for 15 min, and the obtained modified mixture were marked GO–AC–KOH 1–2–4, GO–AC–KOH 1–3–4, GO–AC–KOH 1–4–4, GO–AC–KOH 1–5–4. After that, weighting KOH by a KOH and carbonization plus graphene oxide weight ratio of 3, 4, 5, respectively, and added into the dispersion mixture in the ice water bath which promising the temperature of mixture lower than 30 °C. After 24 h, the mixtures were then activated at the temperature of 800 °C for 60 min in a nitrogen atmosphere, and the obtained modified mixture were marked GO–AC–KOH 1–4–3, GO–AC–KOH 1–4–4, GO–AC–KOH 1–4–5. The obtained porous graphene/activated carbon composites were flushed first with 0.5 mol l−1 HCl solution and then boiled with distilled water, flushed until the pH of the solution reached about 6–7. Finally, these porous graphene/activated carbon composites were dried at 105 °C in an oven for 8 h.Scanning electron microscopy, X-ray diffraction, Raman spectra were used to identify the characteristics of activated carbon/graphene composites. Scanning electron microscopy (SEM) investigations were carried out on S-3400N (Hitachi). The X-ray diffraction (XRD) patterns were acquired on a XRD-6000 (SHIMADZU) diffractometer operating at 40 kV and 20 mA using Cu Kα radiation (λ = 1.5406 Å). Raman spectra were recorded with LABRAM HREVOLUTION (HORIBA) at 473 nm with a charge-coupled device detector.
2.5 Fabrication of the supercapacitors and electrochemical testing
The dried activated carbon/graphene composites were grinded in an agate mortar. Electrodes used for fabrication of supercapacitors were prepared by mixing activated carbon/graphene composites, 60% polytetrafluoroethylene and acetylene black in a mass ratio of 87![[thin space (1/6-em)]](https://www.rsc.org/images/entities/char_2009.gif) :
:![[thin space (1/6-em)]](https://www.rsc.org/images/entities/char_2009.gif) 3
3![[thin space (1/6-em)]](https://www.rsc.org/images/entities/char_2009.gif) :
:![[thin space (1/6-em)]](https://www.rsc.org/images/entities/char_2009.gif) 10, and dispersed in C2H5OH aqueous solution forming a homogeneous slurry. Next, the slurry was coated onto a nickel foam substrate, the square of which is about 1 cm2 and dried in an oven at 105 °C for over 4 h. The electrodes were weighted and two electrodes with identical weight were selected for the measurements. The capacitive performance of all samples was investigated in 7 mol KOH using two-electrode cells. Galvanostatic charge–discharge, cyclic voltammetry, and alternating current impedance were used in evaluation of the capacitive performance of the assembled supercapacitor. Constant current density charge–discharge and rate performance were tested using the BT2000 battery testing system (Arbin Instruments, USA) at room temperature. Cyclic voltammetry and alternating current impedance were employed in each sample for the electrochemical measurements using the 1260 electrochemical workstation (Solartron Metrology, UK) at room temperature. The gravimetric capacitance analyzed, which mean the specific per mass weight activated carbon in the electrode, is expressed in F g−1 and calculated by the following formulas:21
10, and dispersed in C2H5OH aqueous solution forming a homogeneous slurry. Next, the slurry was coated onto a nickel foam substrate, the square of which is about 1 cm2 and dried in an oven at 105 °C for over 4 h. The electrodes were weighted and two electrodes with identical weight were selected for the measurements. The capacitive performance of all samples was investigated in 7 mol KOH using two-electrode cells. Galvanostatic charge–discharge, cyclic voltammetry, and alternating current impedance were used in evaluation of the capacitive performance of the assembled supercapacitor. Constant current density charge–discharge and rate performance were tested using the BT2000 battery testing system (Arbin Instruments, USA) at room temperature. Cyclic voltammetry and alternating current impedance were employed in each sample for the electrochemical measurements using the 1260 electrochemical workstation (Solartron Metrology, UK) at room temperature. The gravimetric capacitance analyzed, which mean the specific per mass weight activated carbon in the electrode, is expressed in F g−1 and calculated by the following formulas:21
 | (1) |
 | (2) |
At room temperature, the BT2000 battery testing system was used to evaluate the constant current density charge–discharge and rate performance. Furthermore, the specific capacitance of the carbon electrode could be counted in accordance with the following formula:
 | (3) |
 | (4) |
 | (5) |
 | (6) |
3. Results and discussion
3.1 Surface composition and morphology
Fig. 2 shows the SEM photographs of GO–AC–KOH 1–2–4, GO–AC–KOH 1–4–4. For sample GO–AC–KOH 1–2–4, a sponge-like structure was observed, and many cavities were found on the particle surface. GO–AC–KOH 1–4–4 has a similar sponge-like structure and exhibits a rougher surface and more abundant porosity on its surface than that on the surface of GO–AC–KOH 1–2–4. According to the magnified picture (Fig. 2(b) and (d)), the graphene oxide as precursor was activated and reduced via high temperature and the reduced graphene oxide sustains the activated carbon particles as a wrinkled carrier after activation. Chemical activation has been extensively used to obtain porous activated carbon/graphene composites. Amit Bhatnagar has reported that KOH activation has been used on activated carbon/graphene composites and improved porosity and enhanced supercapacitor performance and the chemical activation is not merely digesting the activated carbon/graphene composites but also dramatically restructuring it.23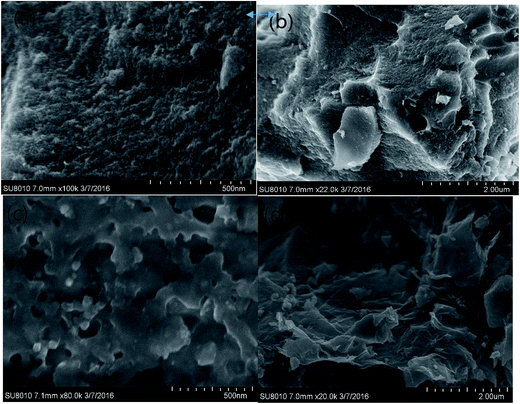 | ||
| Fig. 2 The SEM maps of GO–AC–KOH samples: (a) GO–AC–KOH 1–2–4, 500 nm; (b) GO–AC–KOH 1–2–4, 2 μm; (c) GO–AC–KOH 1–4–4, 500 nm; (d) GO–AC–KOH 1–4–4, 2 μm. | ||
Characterization of samples of GO–AC–KOH by means of X-ray photoelectron spectroscopy (XPS) is shown in Fig. 3(a) and (b). All samples show a weak and broad diffraction peak at around 2θ ≈ 43° assigned to the diffraction (100) of GO–AC–KOH samples. With increasing the mass ratio of graphene oxides in the precursors, the diffraction peak of (002) plane slightly shifts to the right direction, which may be related with the introduction of reduced activated carbon. The graphene oxide was activated and reduced by activated carbon via high temperature and the reduced graphene oxide as a wrinkled carrier sustains the activated carbon particles after activation. The surface structure strongly affects the formation of the electrochemical double layers, further determining the specific capacitance of the electrode materials.24
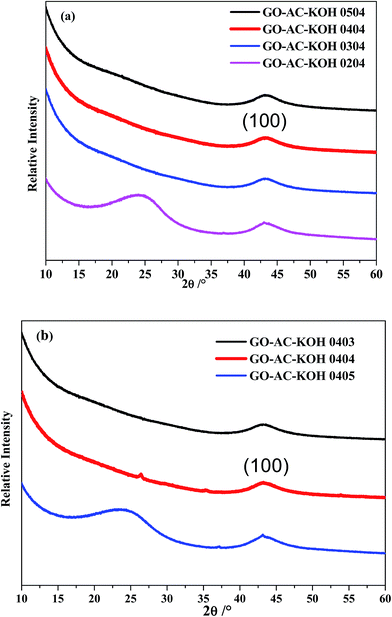 | ||
| Fig. 3 The XRD patterns of GO–AC–KOH samples: (a) different dosage of graphene oxide; (b) different dosage of KOH. | ||
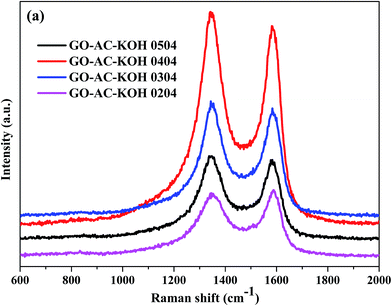
Raman spectroscopy is the most direct and nondestructive technique to characterize the structure and quality of carbon materials, particularly to determine the defects, the ordered and disordered structures.25 So it is essential to investigate the structural variation of GO–AC–KOH samples. Fig. 4(a) shows the Raman spectra of GO–AC–KOH samples, all of samples displaying two characteristic D-band at ∼1340 cm−1 and G-band at ∼1584 cm−1. The D band is related to the disordered carbonaceous structure, while the G band is related to the ordered graphitic structure. The peak intensity ratio (ID/IG) represents the degree of graphitization of the carbon samples.26 The D/G intensity ratios (ID/IG) for these samples are shown in Table 1. It is seen that ID/IG increases along with the increase of the graphene oxides ratio in the precursors while the value of ID/IG of GO–AC–KOH 1–4–4 is larger than the value of GO–AC–KOH. This suggests that the reduced graphene oxides should be covered by sp2 domains with the smallest average size and in the way the domains could reach the most numerous in number. Thus, the electric conductivity of the composite is enhanced by introducing reduced graphene oxides, which is beneficial to the rate capability.27 In addition, the ID/IG ratio was significantly increased from 1.06 to 1.10 with the increase of proportion of KOH, which is contributed to the creation of defects of the sample. In this case, the increased defect degree is apparently due to the increased ratio of sp3 hybridized carbon near the edges of the pores etched by KOH.
| Materials | 1–2–4 | 1–3–4 | 1–5–4 | 1–4–3 | 1–4–4 | 1–4–5 |
| I (ID/IG) | 0.96 | 1.05 | 1.07 | 1.06 | 1.11 | 1.10 |
3.2 Electrochemical performance
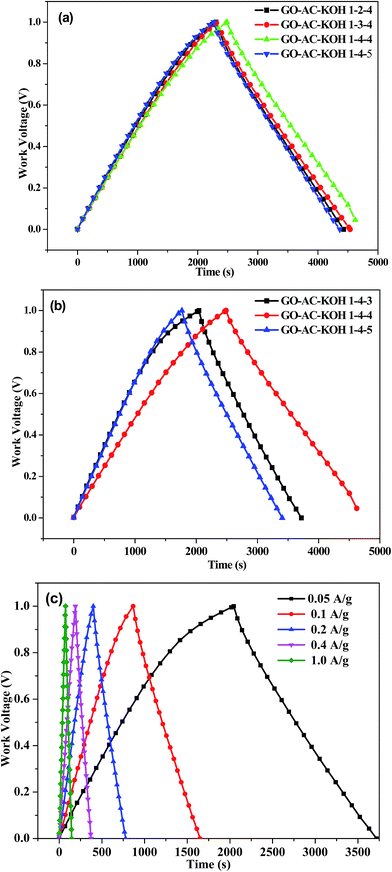
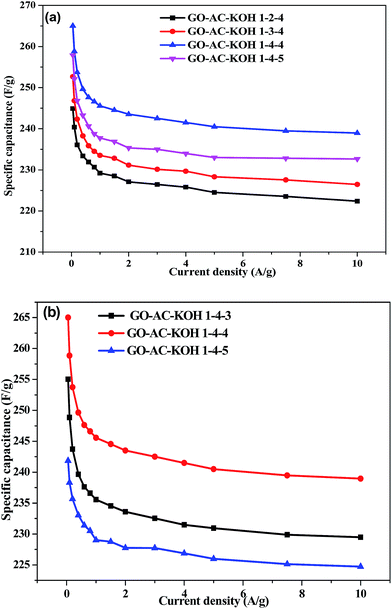
The galvanostatic charging/discharging characteristics of the GO–AC–KOH electrodes were also studied, with the results shown in Fig. 5. As shown in Fig. 5(a) and (b), all the charging/discharging curves appeared triangular shapes which is the typical charge–discharge characteristic of electric double layer capacitors. Moreover, it is observed that the GO–AC–KOH electrodes display straight discharge slopes, indicating excellent discharge capabilities and highly stability and reversibility features.27 These curves exhibited a symmetric linear profile with a little deviation from the line of the peak. Comparing with other GO–AC–KOH electrodes, the GO–AC–KOH 1–4–4 has longer charge–discharge time at the same current density, which indicated that the GO–AC–KOH 1–4–4 electrode has the best charge–discharge property and more capacitance. The possible reason is that the mass ratio of KOH and carbonization plus graphene oxide and the mass ratio of graphene oxide and activated carbon is the optimum ratio which result in electrolyte magnify the wetting property of activated carbons surface and decrease resistance to the charge transfer on the surface of the electrode which in favor of electrolyte ion rapidly transfer to the surface of the electrode. As shown in Fig. 5(c), the charging/discharging curves appeared linear and symmetric even at the high current density, indicating excellent electrochemical reversibility, negligible iR drops, and outstanding columbic efficiencies.28The galvanostatic charge–discharge measurements were carried out to calculate the specific capacitances of all the GO–AC–KOH electrodes at various current densities ranging from 0 to 10 A g−1 within a potential window from 0 to 1 V. The results are shown in Fig. 6(a) and (b). An obvious and sudden potential drop at the beginning of the constant current discharge is usually observed for electric double layer capacitors. The drop has been designated to be the iR drop, which can be attributed to the resistance of electrolyte solution and inner resistance of ion diffusion. The charge–discharge time decreases with the increase of current density, then follows the desolvated ions transfer rapidly and the electric double layer is formed simultaneously. Thus, the specific capacitance decreases a little when the current density increases from 2 A g−1 to 10 A g−1. The specific capacitance of GO–AC–KOH 1–4–4 electrode decreases from 265 F g−1 to 243 F g−1 as the current density increases from 50 mA g−1 to 10 A g−1, indicating a capacitance loss of approximately 8.3%. Similarly, calculation indicate that 14.3% decrease of GO–AC–KOH 1–3–4 in specific capacitance and 13.9% decrease of GO–AC–KOH 1–5–4 in specific capacitance. It is seen that the high-rate capability of the electrode is improved with the addition of GO in the precursors, and when the mass ratio of GO is 4 in the precursors and the mass ratio of the KOH and carbonization plus graphene oxide is 4 during the activation phase, the performance loss is lowest at high current density, which is accordant with the analysis results of cyclic voltammetric and Raman spectra.
A cyclic voltammetric measurement is helpful to understand the macroscopic electrochemical surface reactions at the electrode of the supercapacitor during the charging and discharging process.29 Cyclic voltammetric curves of GO–AC–KOH samples with different dosage of graphene oxide and different dosage of KOH in 7 mol KOH electrolytes within a potential window from −0.1 V to 1.1 V and at a scan rate of 5 mV s−1 are shown in Fig. 7(a) and (b) respectively. The cyclic voltammetric curve of GO–AC–KOH electrode exhibits an ideal rectangular shape, which indicated that the electrochemical performance of the GO–AC–KOH electrode is mainly dominated by double-layer capacitance. As shown in Fig. 7(a), with increasing the ratio of GO in the composites, the deviation of the cyclic voltammetric curves from rectangular is obviously lowed, which means the high-rate performance of GO–AC–KOH electrodes is promoted by the introduction of RGO. The higher the mass ratio of GO, the better the high-rate performance.
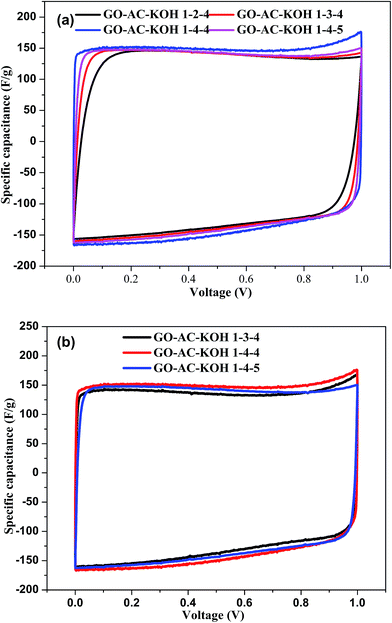 | ||
| Fig. 7 The cyclic voltammograms of GO–AC–KOH electrodes in 7 mol KOH: (a) different dosage of graphene oxide; (b) different dosage of KOH. | ||
Nyquist plot, also known as electrochemical impedance spectroscopy (EIS), shows the frequency response of the electrode/electrolyte system and is a plot of the imaginary component of the impedance against the real component.30,31 The Nyquist plot toward the prepared carbons were measured further fitted by Chi604d software. As indicated in Fig. 8. The Nyquist plot basically consists of a depressed semicircle at high frequency, a not well expressed linear variation of the impedance in the middle frequency region and a vertical tail at low frequency. In details, the semicircle associates with the surface properties of porous electrode and corresponds to the faradic charge-transfer resistance. The EIS of GO–AC–KOH 1–4–3 and GO–AC–KOH 1–4–4 electrodes in 7 mol aqueous electrolyte were shown in Fig. 8. The equivalent series resistance (ESR) reflects the resistance to the electron conduction and ionic transportation in an electrochemical system. As shown in Fig. 8, at very high frequencies, the intercept at the real axis is the ESR value, the ESR of the GO–AC–KOH 1–4–4 is 0.21 Ω and the GO–AC–KOH 1–4–3 is 0.56 Ω. At the lower frequency range, the curve of GO–AC–KOH 1–4–4 electrode is nearly vertical to the Z′ axis, showing that the good capacitance behavior of GO–AC–KOH 1–4–4 is due to its high pore volume and proper pore size distribution. However, the curve of GO–AC–KOH 1–4–3 electrode is sloping to the Z′ axis, as its low pore volume and specific surface. This result is consistent with that of Raman spectrum and the electrochemical performance shown in Fig. 6.
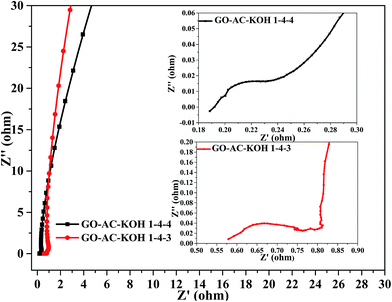 | ||
| Fig. 8 Nyquist plot of the GO–AC–0403 and GO–AC–0404 electrodes in 7 M KOH electrolyte over the frequency range from 0.01 Hz to 20 kHz. | ||
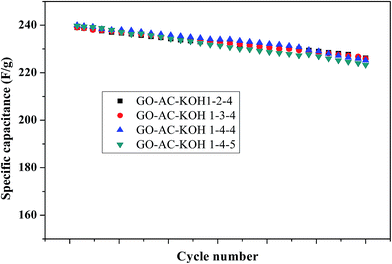
High durability is a urgent required parameter for electrode materials to endure good structural integrity over long term operation.32 To check this performance, electrochemical impedance spectroscopy and galvanostatic charge/discharge of activated carbon/grapheme composites electrodes were examined over a large number of charge/discharge cycles. As shown in Fig. 9, the GO–AC–KOH electrodes was tested for 3000 cycles of galvanostatic charge–discharge at a constant current density of 5 A g−1. The electrode of GO–AC–KOH 1–4–4 has retained over 92.3% of the initial value, comparing with other electrode materials (GO–AC–KOH 1–2–4: 91.7% GO–AC–KOH 1–3–4: 91.9% GO–AC–KOH 1–5–4: 92.1%) which reflecting that the GO–AC–KOH 1–4–4 electrode has good electrochemical stability and a high degree of reversibility in the repetitive charge–discharge cycling test.
4. Conclusions
Activated carbon/reduced graphene oxide composites electrode materials for electrochemical capacitors can be prepared from waste medium density fiberboard and graphene oxide by modified Hummers method and KOH activation. According to the XRD, the introduction of GO promotes the surface structure strongly which affects the formation of the electrochemical double layers. Also the increase of the degree of graphitization will lead the electrical conductivity of the activated carbons to increase. The specific capacitance was firstly ascending and then descending with increasing the GO mass ratio in the precursor. The electrode of GO–AC–KOH 1–4–4 has achieved the highest specific capacitance (265 F g−1 at 0.05 A g−1, 215 F g−1 at 15 A g−1). And the specific capacitance of the GO–AC–KOH 1–4–4 electrode retained 92% of the initial capacitance after 3000 cycles. It is found that KOH activation of disused composite panels is an efficient and straightforward approach to production of low-cost GO–AC composite for electrochemical capacitors.Acknowledgements
The authors gratefully acknowledge the financial support of National Natural Science Foundation, project 51572028: the study on the technology and mechanism of the activated carbon electrode from waste hard board.References
- A. Pandolfo and A. Hollenkamp, J. Power Sources, 2006, 11, 157 Search PubMed.
- J. Xu, X. Gu, J. Cao, W. Wang and Z. Chen, J. Solid State Electrochem., 2012, 16, 2667 CrossRef CAS.
- J. S. Bonso, A. Rahy, S. D. Perera, N. Nour, O. Seitz, Y. J. Chabal, K. J. Balkus, J. P. Ferraris and D. J. Yang, J. Power Sources, 2012, 203, 227 CrossRef CAS.
- S. J. Ashon, K. J. J. Mayrhofer, J. Kreuzer and M. Arenz, J. Electrochem. Sci., 2009, 1, 4 Search PubMed.
- C. Zheng, W. Z. Qian, C. J. Cui, Q. Zhang, Y. G. Jin, M. Q. Zhao, P. H. Tan and F. Wei, Carbon, 2012, 50, 5167 CrossRef CAS.
- A. Izadi-Najafabadi, S. Yasuda, K. Kobashi, T. Yamada, D. N. Futaba, H. Hatori, M. Yumura, S. Lijima and K. Hata, Adv. Mater., 2010, 22, 235 CrossRef PubMed.
- Y. W. Zhu, S. Murali, M. D. Stoller, K. J. Ganesh, W. W. Cai, P. J. Ferreira, A. Pirkle, R. M. Wallace, K. A. Cychosz, M. Thommes, D. Su, E. A. Stach and R. S. Ruoff, Science, 2011, 41, 332 Search PubMed.
- C. G. Liu, Z. N. Yu, D. Neff, A. Zhamu and B. Z. Jang, Nano Lett., 2010, 10, 4863 CrossRef CAS PubMed.
- N. Jia, P. Ramesh, E. Bekyarova, M. E. Itkis and R. C. Haddon, Adv. Energy Mater., 2012, 2, 438 CrossRef.
- M. Q. Zhao, Q. Zhang, J. Q. Huang, G. L. Tian, T. C. Chen, W. Z. Qian and F. Wei, Carbon, 2013, 54, 403 CrossRef CAS.
- G. H. Yu, L. B. Hu, M. Vosgueritchian, H. L. Wang, X. Xie, J. R. McDonough, X. Cui, Y. Cui and Z. N. Bao, Nano Lett., 2011, 11, 2905 CrossRef CAS PubMed.
- J. Yan, Z. J. Fan, T. Wei, W. Z. Qian, M. L. Zhang and F. Wei, Carbon, 2010, 48, 3825 CrossRef CAS.
- S. Biswas and L. T. Drzal, Chem. Mater., 2010, 22, 5667 CrossRef CAS.
- J. J. Xu, K. Wang, S. Z. Zu, B. H. Han and Z. X. Wei, ACS Nano, 2010, 4, 19 Search PubMed.
- A. V. Murgan, T. Muraliganth and A. Manthiram, Chem. Mater., 2009, 21, 5004 CrossRef.
- J. Wang, X. Wang and C. Xu, et al., Polym. Int., 2011, 5, 816 CrossRef.
- T. Chen and L. Dai, Mater. Today, 2013, 16, 272 CrossRef CAS.
- A. Düvel, J. Bednarcik and V. Šepelák, J. Phys. Chem. C, 2014, 13, 7117 Search PubMed.
- J. Senthilnathan, K. S. Rao and W. H. Lin, et al., Carbon, 2014, 78, 454 CrossRef.
- R. K. Layek, A. K. Das and J. P. Min, et al., Carbon, 2015, 81, 329 CrossRef CAS.
- T. X. Shang, M. Y. Zhang and X. J. Jin, RSC Adv., 2014, 73, 39037 RSC.
- S. Maiti, A. Pramanik and S. Chattopadhyay, et al., J. Colloid Interface Sci., 2015, 464, 73 CrossRef PubMed.
- A. Bhatnagar, W. Hogland and M. Marques, et al., Chem. Eng. J., 2013, 219, 499 CrossRef CAS.
- Y. Zhu, S. Murali, M. D. Stoller, K. J. Ganesh, W. Cai, P. J. Ferreira, A. Pirkle and R. M. Wallace, et al., Science, 2011, 332, 1537 CrossRef CAS PubMed.
- C. Monachon and L. Weber, Adv. Eng. Mater., 2015, 17, 68 CrossRef CAS.
- E. Petrova, S. Tinchev and P. Nikolova. Eprint Arxiv, 2017, 62, 717.
- M. Boota, K. B. Hatzell and E. C. Kumbur, et al., Chemsuschem, 2015, 5, 835 CrossRef PubMed.
- W. Liu, X. Yan and J. Lang, et al., J. Mater. Chem., 2011, 21, 13205 RSC.
- Q. Zhang, Q. Wang and M. Tian, et al., Mater. Res. Express, 2014, 1, 1 Search PubMed.
- X. Dominguez-Benetton, S. Sevda and K. Vanbroekhoven, et al., Chem. Soc. Rev., 2012, 41, 7228 RSC.
- M. A. Hegazy, A. A. Nazeer and K. Shalabi, J. Mol. Liq., 2015, 209, 419 CrossRef CAS.
- D. Bhattacharjya and J. S. Yu, J. Power Sources, 2014, 262, 224 CrossRef CAS.
| This journal is © The Royal Society of Chemistry 2017 |


