 Open Access Article
Creative Commons Attribution 3.0 Unported Licence
Rapid synthesis of graphene quantum dots using a continuous hydrothermal flow synthesis approach†
Suela Kellici *a,
John Acordb,
Nicholas P. Powerc,
David J. Morgan
 d,
Paolo Coppoe,
Tobias Heilf and
Basudeb Sahaa
aSchool of Engineering, London South Bank University, 103 Borough Road, London, SE1 0AA, UK. E-mail: kellicis@lsbu.ac.uk
bSchool of Applied Sciences, London South Bank University, 103 Borough Road, London, SE1 0AA, UK
cSchool of Life Health & Chemical Sciences, Open University, Walton Hall, Milton Keynes, MK7 6AA, UK
dCardiff Catalysis Institute, School of Chemistry, Cardiff University, Park Place, Cardiff, CF10 3AT, UK
eCentre for Phosphors and Display Materials, The Wolfson Centre, Brunel University, Kingston Lane, UB8 3PH, Uxbridge, UK
fNanoinvestigation Centre at Liverpool, Liverpool University, 1-3 Brownlow Street, Liverpool, L69 3GL, UK
First published on 6th March 2017
Abstract
A rapid, continuous, environmentally benign and innovative approach is employed for the synthesis of green fluorescent graphene quantum dots (GQD) with low cytotoxicity by utilising a Continuous Hydrothermal Flow Synthesis (CHFS) process as an efficient cutting tool in combination with calix[4]arene tetrasulfonic acid (SCX4) as an effective particle size limiting agent.
Unlike other carbon forms, graphene is a unique two-dimensional single layer of sp2 carbon in which the atoms are arranged in an hexagonal lattice.1,2 The properties of graphene are revealed when layers of graphite are reduced to give a single sheet of carbon atoms as one the thinnest materials ever made.3 Graphene is a zero bandgap material (due to the overlap of valence and conduction bands), and as such it is not expected to show any luminescence.4,5 However, it interestingly exhibits an infinite exciton Bohr radius when “cutting” or fragmenting the graphene sheets into particles smaller than this radius (typically below 20 nm) resulting in graphene quantum dots (GQD).6,7 Consequently, GQD show fascinating physical and chemical properties such as high stability and luminescence on excitation, which is assigned to pronounced quantum confinement and edge effects.8 Additionally, the bandgap can be tuned by changing the size (which generally increases when the GQD particle size decreases) and surface chemistry of the GQD.4 Therefore, excellent optical properties combined with low cytotoxicity render these materials as candidates for applications in biological tagging,9 bio-sensing6 and in photovoltaic devices.10 Current methods for producing graphene quantum dots involve top-down and bottom-up approaches, both of which are demanding in terms of time, materials and energy. The bottom-up routes include solution chemistry11,12 or carbonization, and are relatively complex procedures that utilise exotic precursors (e.g. synthesis of hexa-peri-hexabenzocoronene) and/or use significant quantities of organic solvents (e.g. chloroform) generating large volumes of waste.13 Moreover, GQD from these processes are inferior and generally exhibit poor solubility. The top down routes have more advantages including higher solubility and reported techniques involve hydrothermal cutting,14 electron beam lithography,15 electrochemical exfoliation16 and surface passivating agents.17 However, many of these methods can be time-consuming (up to 32 h), multi-stepped (e.g. involving the oxidation of graphene in concentrated acid (12 h) followed by ultrasonication (12 h), heat-treatment and re-dispersion of the powders in water)18 and with limited control over particle properties such as size and size distribution of the GQD. In this context, it would be highly desirable to have a more efficient top-down rapid and greener approach for synthesis of GQD, which allows a greater degree of control of the process parameters and hence particle properties, as well as having potential for a more environmentally benign and continuous production of large scale quantities of GQD.
Continuous Hydrothermal Flow Synthesis (CHFS) involves mixing continuously a stream of supercritical water with a stream of water soluble precursor(s) for the rapid, controlled and green manufacture of a diverse spectrum of nanomaterials for a broad range of applications.19–29 For instance, utilising this route we have recently reported the synthesis of high quality reduced graphene oxide (rGO) from GO and KOH, and Ag–GO nanocomposites from GO, KOH and AgNO3 in single rapid steps, which were noted to have antibacterial activity.25
Hence, we postulate that utilising a rapid continuous hydrothermal environment in combination with an effective particle-sizing agent, this could facilitate the efficient hydrothermal cutting of graphene oxide to GQD, control particle size and consequently optical properties, whilst demonstrating an efficient, low cost, continuous, reproducible and readily scalable green synthetic procedure.
As such calix[n]arenes (typically, n = 4, 6, 8), and in particular the water soluble p-sulfonic acid calixarene derivatives, would be a suitable candidate as a molecular tool to control particle size. Calixarenes of interest are typically cavity-shaped, a consequence of their cyclic arrangement of [n] phenol molecules linked via methylene bridges with their 3-dimensional cavity arrangement maintained via intramolecular hydrogen bonding of the hydroxyl groups. The water soluble p-tetrasulfonic acid-calix[n]arenes with their inherent supramolecular properties and biocompatibility30 have seen diverse development and utilisation in biological applications in sensors and receptors,31 assays, drug delivery vesicles,32 protein mapping and crystallisation agents,33 as well as applications in catalysis,34 inclusion and crystal engineering.35
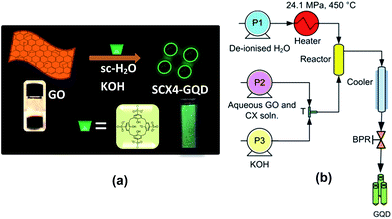
Herein, we report a new approach using supercritical water and p-tetrasulfonic acid calix[4]arene (SCX4) to make GQD from GO with tuneable physical properties. This process has many advantages: it does not utilise a complex and lengthy process, nor is it potentially explosive and it limits the use of harmful or toxic reagents, while effectively reducing the reaction time to a few seconds. The scheme for the synthesis of GQD is shown in Fig. 1a.
In this process (schematic of which is shown in Fig. 1b), the pre-mixed aqueous solution of GO (made via Hummers method from graphite, ESI†) and SCX4 (ESI†) was pumped to mix with a flow of KOH at room temperature at a T-junction (‘T’). This mixture was then brought into contact with supercritical water (450 °C, 24.1 MPa) in a counter-current ‘Reactor’, whereupon the formation of GQD occurred. To investigate the influence of SCX4 on the physical and optical properties of the GQD, the concentration of SCX4 was varied from zero (Sample Control), to a factor of 1-fold (Sample A), 3-fold (Sample B), 5-fold (Sample C) and 10-fold (Sample D). All other experimental conditions were kept constant. It was observed that the GQD as-prepared were readily water dispersible due to the presence of SCX4.
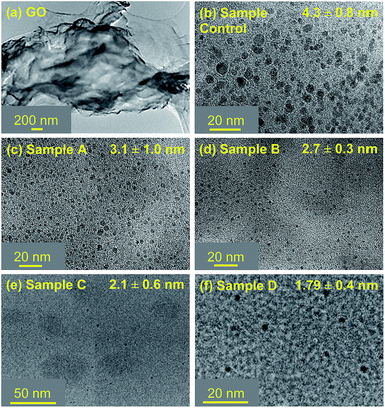
Transmission Electron Microscopy (TEM) images (Fig. 2) for the “Control” sample revealed a mean particle size (4.3 ± 0.8 nm) along with a broad particle size distribution. Contrarily, for GQD where SCX4 was employed, the TEM imaging indicates smaller particle size and narrow particle size distribution (Sample A: 3.1 ± 1.0 nm, Sample B: 2.7 ± 0.3 nm, Sample C: 2.1 ± 0.6 nm and Sample D: 1.79 ± 0.4 nm) proving that SCX4 limits the growth of GQD by acting as an efficient particle control agent during the cutting/fragmentation process.
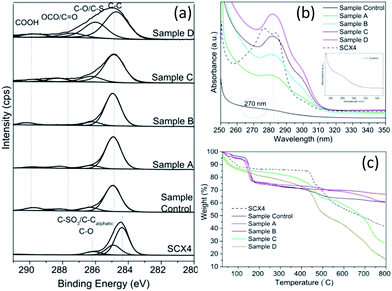
In order to determine the changes in the chemical states of all synthesised GQD and SCX4, X-ray photoelectron spectroscopy (XPS) analysis was employed (see Fig. 3a). As we previously reported,25 the hydrothermal process is effective in dehydrating/reducing GO. Indeed, the deconvoluted C(1s) XPS spectra of GQD made hydrothermally revealed significantly reduced peak intensities of the oxygen-containing functional groups (epoxide, carboxyl and hydroxyl) which are associated with GO (starting material). For SCX4 there is a peak of similar energy ∼286 eV, which is assigned as the C–SO3 bond. It has been reported that SCX4 functionalised onto GO via (a) non-covalent π–π interactions (as a result of adsorption of benzene rings present in SCX4) and (b) hydrogen bonding interactions between hydroxyl groups of SCX4 and oxygen functional groups of GO.31a,b,36
Elemental analysis results (Table S1, ESI†) indicate that the GQD are mainly composed of carbon, oxygen and sulphur. An increase in sulphur content was observed from 0.51% (control), 2.01% (Sample “A”), 2.82% (Sample “B”), 3.94% (Sample “C”) and highest elemental composition of 5.94% for Sample “D”, which has the highest nominal SCX4 concentration. This strongly suggests SCX4 has been successfully attached to the graphene and is further supported by FTIR spectroscopy of the samples (Fig. S2, ESI†), revealing the presence of bands located at 1164 and 1047 cm−1 which can be assigned to the SO3 groups of SCX4, also found in pure SXC4.31 As expected, these distinct peaks are absent in the “control” sample. Additional bands located at 2914 cm−1 (C![[double bond, length as m-dash]](https://www.rsc.org/images/entities/char_e001.gif) C–H stretch), 1351 cm−1 (>COO– symmetric stretch) and 1614 cm−1 (>C
C–H stretch), 1351 cm−1 (>COO– symmetric stretch) and 1614 cm−1 (>C![[double bond, length as m-dash]](https://www.rsc.org/images/entities/char_e001.gif) C, skeletal vibrations of graphitic domain or adsorbed water) are also evident.37 These bands are more prominent in the “control” sample. The band located at 3452 cm−1 (>O–H stretch) diminished in GQD functionalised with SCX4 samples, where a significant reduction in the peak intensity of 1351 cm−1 band (>COO– symmetric stretch) is also observed.
C, skeletal vibrations of graphitic domain or adsorbed water) are also evident.37 These bands are more prominent in the “control” sample. The band located at 3452 cm−1 (>O–H stretch) diminished in GQD functionalised with SCX4 samples, where a significant reduction in the peak intensity of 1351 cm−1 band (>COO– symmetric stretch) is also observed.
TGA evaluation reflected both the thermal stability of the SCX4 functionalised GQDs and the load bearing of GQD for SCX4 when compared to the “control” sample. The significant increasing weight loss, (Fig. 3c), observed in the region 350–650 °C for Samples A, B, C, and D can be attributed to SCX4 decomposition (4, 6, 24 & 37% respectively). For Sample D, the SCX4 decomposition approximates to 1 calixarene per 128 carbon atoms. Furthermore, the sulphur atom content (5.94%) from XPS analysis of Sample D stated earlier is complimented by the estimation of the SCX4 to carbon ratio derived from TGA analysis which approximates to 5.6%. This density of calixarenes on the GQD is encouraging, as it may allow for future facilitation and development in supramolecular recognition properties.
The location of calixarenes on the GQD, based on the Lerf-Klinowski model, is expected to be edge aligned where one of the SCX4's phenol moiety has formed an ester linkage with the GQD edge carboxylic groups under CHFS conditions, and is consistent with XPS data for the C3/C4 ratio, suggesting that the carboxylic moiety has been consumed and replaced by another carbonyl moiety. This is in contrast to our previously reported system for Ag–graphene nano-composite synthesis where the calixarene derivative (SCX6) had no evident impact on the sizing of rGO sheets,25b a likely consequence of SCX6 being subsumed into its roles as both a silver ion stabiliser in solution and as a reducing agent (alongside that of the phenolic moieties on GO) of Ag+ into Ag nanoparticles on rGO sheets.
Raman spectroscopy lends further insight to study the structure and defects on the carbon structure of GQD and to confirm the presence of SCX4 (see ESI†). In all samples, with the exception of the control sample, characteristic peaks of SCX4 were noticed. Furthermore, the characteristic D band (A1g vibrational mode located at ca. 1325–1350 cm−1) attributed to the local defects/disorders (found at the edges of graphene sheets) and G bands (E2g vibrational mode of the C–C bond stretching located at ca. 1580 cm−1) assigned to the sp2 graphitized structure, are also observed. Generally, smaller ID/IG peak intensity ratios correspond to lower defects/disorders.25 This trend is reflected in the values of 1.019 (Sample A), 0.182 (Sample B), 0.170 (Sample C) and 0.112 (Sample D) confirming the reduction of defects with increased SCX4 functionalisation onto GQD.
Further characterisation by UV-Vis spectroscopy (Fig. 3b) of pure SCX4 shows π–π* transitions centred at ca. 278 and 284 nm, whereas the peak located at ca. 280 nm may indicate the presence of SCX4 in GQD. However, as expected there is no SCX4 corresponding peak observed for the “Control” sample, which showed an absorption band at ca. 270 nm, that is consistent with values reported in literature,38 confirming that SCX4 has been introduced onto GO.
Photoluminescence (PL) spectra (Fig. S6, ESI†) for the aqueous solutions of GQD samples translated to 2D excitation–emission contour map of GQD compounds are shown in Fig. 4a–e. A bright green fluorescence is noted upon excitation at 365 nm for GQD (inset Fig. 4e). The GQD showed tuneable excitation behaviour upon excitation at 360–440 nm range. The maximum excitation wavelengths of GQD materials are: 360 nm (Control), 380 nm (Sample A), 420 nm (Sample B), 400 nm (Sample C) and 420 nm (Sample D). Unlike other GQD materials, Samples B, C and D exhibited a greater excitation independent profile (when excitation wavelength was varied from 380–440 nm).
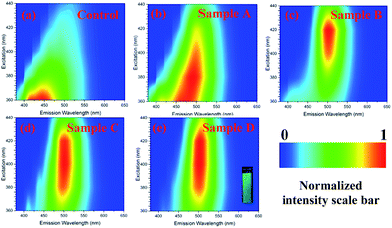 | ||
| Fig. 4 2D excitation–emission contour map of GQD compounds. A bright green fluorescence is noted upon excitation at 365 nm for GQD (inset Sample D). | ||
It has been reported that PL properties of GQD are dependent on parameters such as particle size distribution (different particle sizes in the materials) and different surface defects.4,8 Indeed, the TEM images indicate that Samples B, C and D exhibit a smaller particle size and particle size distribution, whereas the samples control and A are not very uniform and exhibited a broader particle size distribution. Therefore, excitation-independent behaviour for samples with higher content of SCX4 is assigned to their narrow particle size distribution. From these results, it can be concluded that SXC4 in combination with hydrothermal cutting are important factors in determining the physical and optical properties of these quantum dots as well as their inherent surface defects. The quantum yield values for GQD as stable water suspensions are 2.47% (Sample A), 4.10% (Sample B), 3.61% (Sample C), 3.43% (Sample D) and negligible value for control sample. Whilst we suggest that SCX4 affects the properties of GQD occurring during the hydrothermal fragmentation of graphene sheet, a control reaction in the presence of 4-hydroxybenzenesulfonic acid (a simple aromatic having both SCX4 substituents) also demonstrated (see ESI†) that macrocyclic/supramolecular nature of the SCX4 plays a role. This sample exhibited negligible quantum yield of photoluminescence.
Cell cytotoxicity experiments: To determine the toxicity of the GQD against eukaryotic cells, the macrophage cell line RAW 264.7 was incubated with these compounds and controls at various concentrations for 24 h. An MTT assay was performed to determine cell viability and the results reported as % viability (MTT value of cells with compound/MTT value of cells without compound × 100) (Fig. 5). The GQD control had no significant effect on cell viability, whilst SCX4 does adversely affect cell viability at concentrations >125 μg mL−1. For GQD Samples A and B (1![[thin space (1/6-em)]](https://www.rsc.org/images/entities/char_2009.gif) :
:![[thin space (1/6-em)]](https://www.rsc.org/images/entities/char_2009.gif) 1 ratio and 3
1 ratio and 3![[thin space (1/6-em)]](https://www.rsc.org/images/entities/char_2009.gif) :
:![[thin space (1/6-em)]](https://www.rsc.org/images/entities/char_2009.gif) 1 ratio of SCX4
1 ratio of SCX4![[thin space (1/6-em)]](https://www.rsc.org/images/entities/char_2009.gif) :
:![[thin space (1/6-em)]](https://www.rsc.org/images/entities/char_2009.gif) graphene in synthesis) toxicity is reduced compared to SCX4 alone. However, the Samples C and D (generated using 5 and 10 times as much SCX4 as Sample A respectively) show higher toxicity than SCX4 at all concentrations tested.
graphene in synthesis) toxicity is reduced compared to SCX4 alone. However, the Samples C and D (generated using 5 and 10 times as much SCX4 as Sample A respectively) show higher toxicity than SCX4 at all concentrations tested.
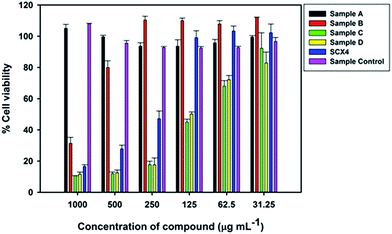 | ||
| Fig. 5 Viability of RAW 264.7 cells after incubation with GQD and SCX4 at varying concentrations for 24 hours. | ||
The reduction in toxicity for Samples A and B can be explained as due to the fact that GQD are lightly decorated with SCX4 compared to Samples C and D. However, for Samples C and D it is expected that toxicity of these compounds should be no worse than for SCX4 alone, as they must, given the same concentration, contain less SCX4. Yet this does not appear to be the case as the GQD are highly decorated with SCX4, and thus each GQD could represent a locally increased concentration of SCX4 when interacting with the cells compared to that provided by the solution of SCX4 alone. This may explain the increased toxicity of Samples C and D when compared to SCX4.
In summary, an innovative, rapid and environmentally benign synthetic process for making calixarene functionalised GQD with tuneable physical properties is demonstrated. The degree of PL can be controlled by tuning the level of calixarene assisted fragmentation and functionalisation onto graphene. These materials have potential to be utilised in a broad range of applications including photovoltaics, biological and light emitting devices. Furthermore, this work has potential for the continuous production of large scale quantities of GQD.
Acknowledgements
SK and NP would like to thank the EPSRC Grand Challenge Network, the Directed Assembly Network, for the pump-priming award PP105 31-05-2016. SK, NP and JA also gratefully acknowledge the financial support provided by LSBU. Dr K. Mafina (QMUL) is acknowledged for her help with the TGA data.Notes and references
- A. K. Geim and K. S. Novoselov, Nat. Mater., 2007, 6, 183 CrossRef CAS PubMed.
- A. K. Geim, Science, 2009, 324, 1530 CrossRef CAS PubMed.
- D. R. Dreyer, S. Park, C. W. Bielawski and R. S. Ruoff, Chem. Soc. Rev., 2010, 39, 228 RSC.
- L. Li, G. Wu, G. Yang, J. Peng, J. Zhao and J. J. Zhu, Nanoscale, 2013, 5, 4015 RSC.
- S. N. Baker and G. A. Baker, Angew. Chem., Int. Ed., 2010, 49, 6726 CrossRef CAS PubMed.
- J. Shen, Y. Zhu, X. Yang and C. Li, Chem. Commun., 2012, 48, 3686 RSC.
- M. Bacon, S. J. Bradley and T. Nann, Part. Part. Syst. Charact., 2014, 31, 415 CrossRef CAS.
- P. G. Silvestrov and K. B. Efetov, Phys. Rev. Lett., 2007, 98, 016802 CrossRef CAS PubMed.
- S. Zhu, J. Zhang, C. Qiao, S. Tang, Y. Li, W. Yuan, B. Li, L. Tian, F. Liu, R. Hu, H. Gao, H. Wei, H. Zhang, H. Sun and B. Yang, Chem. Commun., 2011, 47, 6858 RSC.
- X. Yan, X. Cui, B. Li and L. S. Li, Nano Lett., 2010, 10, 1869 CrossRef CAS PubMed.
- X. Yan, X. Cui and L. S. Li, J. Am. Chem. Soc., 2010, 132, 5944 CrossRef CAS PubMed.
- M. L. Mueller, X. Yan, B. Dragnea and L. S. Li, Nano Lett., 2011, 11, 56 CrossRef CAS PubMed.
- (a) R. Liu, D. Wu, X. Feng and K. Mullen, J. Am. Chem. Soc., 2011, 133, 15221 CrossRef CAS PubMed; (b) Z. Huang, Y. Shen, Y. Li, W. Zheng, Y. Xue, C. Qin, B. Zhang, J. Hao and W. Feng, Nanoscale, 2014, 6, 13043 RSC.
- D. Pan, J. Zhang, Z. Li and M. Wu, Adv. Mater., 2010, 22, 734 CrossRef CAS PubMed.
- L. A. Ponomarenko, F. Schedin, M. I. Katsnelson, R. Yang, E. W. Hill, K. S. Novoselov and A. K. Geim, Science, 2008, 320, 356 CrossRef CAS PubMed.
- D. B. Shinde and V. K. Pillai, Chem.–Eur. J., 2012, 18, 12522 CrossRef CAS PubMed.
- J. Shen, Y. Zhu, X. Yang, J. Zong, J. Zhang and C. Li, New J. Chem., 2012, 36, 97 RSC.
- S. Zhuo, M. Shao and S. Lee, ACS Nano, 2012, 6(2), 1059 CrossRef CAS PubMed.
- A. A. Chaudhry, S. Haque, S. Kellici, P. Boldrin, I. Rehman, F. A. Khalid and J. A. Darr, Chem. Commun., 2006, 2286 RSC.
- S. Kellici, K. Gong, T. Lin, S. Brown, R. J. H. Clark, M. Vickers, J. K. Cockcroft, V. Middelkoop, P. Barnes, J. M. Perkins, C. J. Tighe and J. A. Darr, Philos. Trans. R. Soc., A, 2010, 368, 4331 CrossRef CAS PubMed.
- (a) Y. Hakuta, T. Adschiri, T. Suzuki, T. Chida, K. Seino and K. Arai, J. Am. Ceram. Soc., 1998, 81, 2461 CrossRef CAS; (b) H. Hobbs, S. Briddon and E. Lester, Green Chem., 2009, 11, 484 RSC; (c) J. A. Darr and M. Polyakoff, Chem. Rev., 1999, 99, 495 CrossRef CAS PubMed.
- T. Lin, S. Kellici, K. Gong, K. Thompson, J. R. G. Evans, X. Wang and J. A. Darr, J. Comb. Chem., 2010, 12, 383 CrossRef CAS PubMed.
- X. Weng, J. K. Cockcroft, G. Hyett, M. Vickers, P. Boldrin, C. C. Tang, S. P. Thompson, J. E. Parker, J. C. Knowles, I. Rehman, I. Parkin, J. R. G. Evans and J. A. Darr, J. Comb. Chem., 2009, 11, 829 CrossRef CAS PubMed.
- X. Weng, P. Boldrin, I. Abrahams, S. J. Skinner, S. Kellici and J. A. Darr, J. Solid State Chem., 2008, 181, 1123 CrossRef CAS.
- (a) S. Kellici, J. Acord, J. Ball, H. S. Reehal, D. Morgan and B. Saha, RSC Adv., 2014, 4, 14858 RSC; (b) S. Kellici, J. Acord, A. Vaughn, N. Power, D. Morgan, T. Heil, S. Facq and G. Lampronti, ACS Appl. Mater. Interfaces, 2016, 8(29), 19038 CrossRef CAS PubMed.
- T. Adschiri, Y. Lee, M. Goto and S. Takami, Green Chem., 2011, 13, 1380 RSC.
- S. Tang, R. Bourne, R. Smith and M. Poliakoff, Green Chem., 2008, 10, 268 RSC.
- M. Tsang, G. Philippot, C. Aymonier and G. Sonnemann, Green Chem., 2016, 18, 4924 RSC.
- C. Tighe, R. Cabrera, R. Gruar and J. Darr, Ind. Eng. Chem. Res., 2013, 52(16), 5522 CrossRef CAS.
- A. W. Coleman, S. Jebors, S. Cecillon, P. Perret, D. Garin, D. Marti-Battle and M. Moulin, New J. Chem., 2008, 32, 780 RSC.
- (a) X. Mao, D. Tian and H. Li, Chem. Commun., 2012, 48, 4851 RSC; (b) J. Zhou, M. Chen and G. Diao, ACS Appl. Mater. Interfaces, 2013, 5, 828 CrossRef CAS PubMed; (c) R. Doyle, C. B. Breslin, O. Power and A. D. Rooney, Electroanalysis, 2012, 24, 293 CrossRef CAS; (d) R. Doyle, C. B. Breslin and A. D. Rooney, Chem. Biochem. Eng. Q., 2009, 23, 93 CAS; (e) K. N. Koh, K. Araki, A. Ikeda, H. Otsuka and S. Shinkai, J. Am. Chem. Soc., 1996, 118, 755 CrossRef CAS.
- D. S. Guo and Y. Liu, Acc. Chem. Res., 2014, 47, 1925 CrossRef CAS PubMed.
- (a) R. E. McGovern, H. Fernandes, A. R. Khan, N. P. Power and P. B. Crowley, Nat. Chem., 2012, 4, 527 CrossRef CAS PubMed; (b) R. E. McGovern, A. A. McCarthy and P. B. Crowley, Chem. Commun., 2014, 50, 10412 RSC; (c) R. E. McGovern, S. C. Feifel, F. Lisdat and P. B. Crowley, Angew. Chem., Int. Ed., 2015, 21(54), 6356 CrossRef PubMed.
- (a) D. M. Homden and C. Redshaw, Chem. Rev., 2008, 108, 5086 CrossRef CAS PubMed; (b) M. Komiyama, K. Isaka and S. Shinkai, Chem. Lett., 1991, 20, 937 CrossRef.
- (a) J. L. Atwood, L. J. Barbour, M. J. Hardie and C. L. Raston, Coord. Chem. Rev., 2001, 222, 3 CrossRef CAS; (b) D. S. Guo, K. Wang and Y. Liu, J. Inclusion Phenom. Macrocyclic Chem., 2008, 62, 1 CrossRef CAS; (c) S. J. Dalgarno, J. L. Atwood and C. L. Raston, Chem. Commun., 2006, 4567 RSC.
- V. Georgakilas, M. Otyepka, A. B. Bourlinos, V. Chandra, N. Kim, K. C. Kemp, P. Hobza, R. Zboril and K. S. Kim, Chem. Rev., 2012, 112, 6156 CrossRef CAS PubMed.
- C. Galande, A. D. Mohite, A. V. Naumov, W. Gao, L. Ci, A. Ajayan, H. Gao, A. Srivastava, R. Bruce Weisman and P. M. Ajayan, Sci. Rep., 2011, 1, 85 CrossRef PubMed.
- J. Moon, J. An, U. Sim, S. P. Cho, J. H. Kang, C. Chung, J. H. Seo, J. Lee, K. T. Nam and B. H. Hong, Adv. Mater., 2014, 26, 3501 CrossRef CAS PubMed.
Footnote |
| † Electronic supplementary information (ESI) available: Experimental details, XPS elemental analysis, Raman data, 4-hydroxybenzenesulfonic acid TEM and PL data. See DOI: 10.1039/c7ra00127d |
| This journal is © The Royal Society of Chemistry 2017 |

