DOI:
10.1039/C7RA00125H
(Paper)
RSC Adv., 2017,
7, 14487-14495
Oxygen permeation, thermal expansion behavior and electrochemical properties of LaBa0.5Sr0.5Co2O5+δ cathode for SOFCs†
Received
4th January 2017
, Accepted 10th February 2017
First published on 6th March 2017
Abstract
In this study, the double perovskite LaBa0.5Sr0.5Co2O5+δ (LBSC55) is investigated as a potential cathode for solid oxide fuel cells (SOFCs). In the curve of the first derivative δL vs. temperature, there is an inflection region ranging from 230 to 330 °C. The peak inflection point located about 260 °C is associated with the initial temperature for the loss of lattice oxygen and the formation of oxygen vacancies. The concentration of Co4+ ions in LBSC55 decreased significantly above 260 °C due to the loss of lattice oxygen (Co4+ → Co3+) and creation of  at the same time. The electrical conductivity exhibited a metallic behavior with values that gradually decreased from 232 S cm−1 at 400 °C to 178 S cm−1 at 800 °C. The chemical bulk diffusion coefficient (Dchem) values of LBSC55 are 1.49 × 10⁻⁴, 2.75 × 10⁻⁴ and 5.37 × 10⁻⁴ cm2 s−1 at 700 °C, 750 °C and 800 °C, respectively. The oxygen permeation flux for LBSC55 membrane with 1.0 mm thickness increased from 0.210 mL min−1 cm−2 at 500 °C to 0.302 mL min−1 cm−2 at 800 °C under synthetic air at a flow rate of 50 mL min−1, with helium at a rate of 25 mL min−1. The activation energies of oxygen permeation for the high temperature region (750–800 °C) and low temperature region (500–700 °C) are 10.60 and 2.75 kJ mol−1, respectively. This suggested that the surface exchange process is dominant above 750 °C and at low temperature ranges the bulk diffusion process is dominant for oxygen ion diffusion. The main process of the oxygen reduction reaction is dominated by oxygen ion transfer from TPB and/or 2PB sites of the cathode to electrolyte in the temperature range of 600–800 °C. Based on the chemical bulk diffusion coefficient, oxygen permeation and electrochemical properties, LBSC55 is a potential cathode for solid oxide fuel cells (SOFCs).
Introduction
A fuel cell is an electrochemical device that converts chemical energy into electrical energy with high efficiency and low pollutant emissions.1,2 The development of cathode materials with high electrocatalytic activity for the oxygen reduction reaction (ORR) at intermediate temperatures has received considerable attention during the past decades.3,4 Unfortunately, the fabrication of high performance and reliable IT-SOFCs still remains a big challenge, mainly due to the sluggish oxygen surface kinetics at the electrolyte surface and reluctant ORR activity in the cathode.5 It is known that the cathode material may limit a cell’s performance, especially in the lower temperature regime, because of insufficient catalytic activity towards oxygen reduction and inadequate transport properties.6,7
It is known that cobalt-based materials exhibit excellent mixed ionic and electronic conductor (MIEC) performance in the intermediate temperature range. Recently, extensive research has been also carried out on the evaluation of the properties of so called layered perovskites with a chemical formula LnBaCo2O5+δ (Ln-selected lanthanides).8–11 The effect of Sr2+ substitution of Ba2+ in LnBaCo2O5+δ revealed higher electrical conductivity, an increase in oxygen content, excellent area specific resistance (ASR) values and good chemical stability.12–14 In this work, LaBa0.5Sr0.5Co2O5+δ cathode characteristics such as thermogravimetric properties, electrical conductivity, chemical bulk diffusion coefficient (Dchem), oxygen permeation, the exchange current density (io) determined via electrochemical impedance spectrometry (EIS), low-field (LF) and high field (HF) techniques, and the main process of the ORR were studied, as a potential cathode for IT-SOFC cells.
Experimental
The LaBa0.5Sr0.5Co2O5+δ (LBSC55) cathode powders were prepared via a conventional solid-state reaction. Stoichiometric amounts of La2O3, BaCO3, SrCO3, and CoO powders were thoroughly mixed under ethanol, and calcined in air at 1100 °C for 4 h. The Ce0.8Sm0.2O1.9 (SDC) powder was synthesized via co-precipitation using Ce(NO3)3·6H2O and Sm(NO3)3·6H2O as the starting materials. These starting materials were dissolved in distilled water and adjusted to a pH value in the range of 9.5–10 by adding a solution of ammonia. The resulting precipitate was washed, dried and calcined at 600 °C for 2 h in air. The SDC powder was pelletized with the dimensions of 13 mm in diameter and 1 mm in thickness. The SDC discs for half-cell assembly were sintered at 1500 °C for 5 h.15
The structure of the calcined LBSC cathode powder was characterized using an X-ray powder diffractometer (XRD; Rigaku, D/MAX-2500 V) with a scanning rate of 4° min−1 and scanning range of 20–80°, using a Cu Kα (1.5418 Å) radiation source. The XRD pattern was analyzed via Rietveld refinement using the GSAS program. In order to understand the particle size distribution for the LBSC55 powder, it was studied using a particle size analyzer (LS-POP (6), Beatop). Distilled water was used as the medium, and polyacrylic acid (PAA) was used as the dispersant. The thermogravimetric properties of calcined LBSC55 were investigated using a thermogravimetric analyzer in static air. The oxygen content (δ) was calculated based on the following equation.
| |
 | (1) |
where
MS is the molar mass of the sample,
MO is the molar mass of oxygen, Δ
m is the sample mass change, and
m is the sample mass at room temperature in air.
16 The room temperature oxygen nonstoichiometry of the calcined LBSC55 specimen was determined
via iodometric titration.
17 The thermal expansion coefficient (TEC) of the LBSC55 sintered at 1100 °C for 4 h was measured using a thermomechanical analyzer (TMA; Hitachi TMA7300) with a constant heating rate of 10 °C min
−1 in the temperature range of 25–800 °C in static air. The electrical conductivity was measured using the four-probe DC method. The LBSC55 pellet for the electrical conductivity measurement was sintered at 1200 °C for 1 h in air with the size of 5 × 5 × 10 mm
3. A constant current was delivered to the two current wires, and the voltage response was studied using a Keithley 2420 SourceMeter in the temperature range of 400–800 °C. The electrical conductivity relaxation (ECR) technique was carried out to determine the chemical bulk diffusion coefficient (
Dchem) of the cathode. A sudden change at
p(O
2), from 0.05 to 0.21 atm was caused by introducing standard gas mixtures of Ar and O
2. Typically, a sequence of reduction/oxidation cycles was performed at each temperature. The electrical conductivity relaxation curve was plotted as
 versus t
. The values for
Dchem could be estimated by fitting the ECR curves. The experimental details follow those of our group’s earlier published paper.
18
The oxygen permeation properties of LBSC55 membrane were measured using an in-house oxygen permeation set-up. The membrane preparation is described as follows. The ball-milled calcined LBSC55 powder was press-formed into a disk with diameter 13 mm and sintered at 1000 °C for 4 h in air. The LBSC55 membranes for the oxygen permeation test were polished from 0.8 to 1.4 mm in thickness and sealed with gold rings between two quartz rods. The feed side fed in synthetic air (21 vol% O2 + 79 vol% N2) at a flow rate of 50 mL min−1, while high purity helium was applied to the sweep side at a flow rate of 25 mL min−1. An online-coupled Agilent 7890 gas chromatograph with a RT-Msieve 5A column was used to analyze the concentration of nitrogen and oxygen. The oxygen permeation flux was determined using the following equation.19
| |
 | (2) |
where
J(O
2) is the oxygen permeation flux (mL min
−1 cm
−2),
CO2 and
CN2 are the measured gas-phase concentrations in percentage of oxygen and nitrogen in the penetrative stream, respectively,
F is the flow rate (mL min
−1) of the sweeping gas, and
S is the effective surface area (cm
2) of the disk exposed to the sweeping gas. The measurement was conducted over a temperature range of 500–800 °C.
A symmetrical cell of LBSC55/SDC/LBSC55 configuration was fabricated via a screen-printing technique. The LBSC55 cathode paste was applied on both sides of the SDC electrolyte discs in circles of 13 mm diameter and 1 mm thick. After the cathode material was painted on the electrolyte, it was sintered at 1000 °C for 4 h in air. On one side, the cathode paste was painted as the working electrode (WE) with a surface area of 0.385 cm2. The Ag reference electrode (RE) was placed away from the WE by about 0.3–0.4 cm. The cathode counter electrode (CE) was placed on the other side of the SDC disk. The symmetrical testing cell experiments were carried out under various oxygen atmospheres at temperatures ranging from 600 to 800 °C in intervals of 50 °C in a furnace. The AC impedance measurement was performed using a VoltaLab PGZ301 potentiostat with the frequency applied in the range of 100 kHz to 0.1 Hz with a 10 mV AC signal amplitude. The EIS fitting analysis was performed with the Z-view software. Linear sweep voltammetry was measured between −0.4 and 0.1 V with sweep rate 0.5 mV s−1 versus the RE.
Results and discussion
Fig. 1 shows the refinement of LBSC55 patterns including the measured XRD data, the calculated profile and the difference between them. The sample is single phase and the crystal structure can be indexed with double perovskite structure. There are no peaks due to impurities, when the LBSC55 powder is calcined at a temperature of 1100 °C, implying that the process of synthesizing the sample is successful. The lattice parameters obtained from the Rietveld refinement are listed in Table 1. The experimental data highly agree with the calculated profiles, suggesting that cations are well ordered in the perovskite lattice.20 The particle size distribution of the LBSC55 powder prepared via the solid-state reaction technique calcined at 1100 °C, revealed that the average particle size is about 2.40 μm as shown in Fig. S1,† and the detailed information regarding cumulative volume is listed in Table S1.†
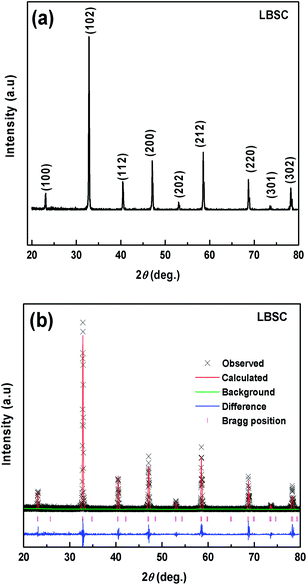 |
| | Fig. 1 (a) X-ray powder diffraction pattern and (b) observed (crosses) and calculated (solid line) XRD patterns and the difference (bottom line) between them for the LBSC55 powder calcined at 1100 °C for 4 h in air. Note that Ba2+/Sr2+ ions exist in the ordered perovskite lattice. | |
Table 1 Crystallographic information for LBSC55 from XRD data at room temperature, with cell parameters obtained from the Rietveld refinementa
| Atom |
Wyckoff position |
x |
y |
z |
Uiso |
Occup. |
| χ2 = 1.44, RP = 0.23, Rwp = 0.32, Rexp = 0.27, tetragonal (space group: P4/mmm), a = 3.868 Å, b = 3.868 Å, c = 7.731 Å, and v = 115.69 Å3. |
| La1 |
1b (0 0 1/2) |
0 |
0 |
0.5 |
0.0162 |
0.9162 |
| Co2 |
2h (1/2 1/2 z) |
0.5 |
0.5 |
0.2532 |
0.0128 |
0.9644 |
| Ba3 |
1a (0 0 0) |
0 |
0 |
0 |
0.0101 |
0.5167 |
| O4 |
1c (1/2 1/2 0) |
0.5 |
0.5 |
0 |
0.0573 |
0.9325 |
| O5 |
4i (1/2 0 z) |
0.5 |
0 |
0.2487 |
0.0572 |
1.4271 |
| O6 |
1d (1/2 1/2 1/2) |
0.5 |
0.5 |
0.5 |
0.0417 |
0.7247 |
| Sr7 |
1a (0 0 0) |
0 |
0 |
0 |
0.0003 |
0.4750 |
The thermal expansion coefficient (TEC) is a crucial property for cathodes as it impacts significantly on the performance of a single cell. A bulk thermal expansion curve for the LBSC55 cathode was determined from room temperature to 800 °C using a thermomechanical analyzer and the first derivative δL/L vs. temperature as shown in Fig. 2. The LBSC55 specimen seemingly shows a linear expansion based on the δL/L–T plot from 100 to 800 °C. Based on the first derivative δL/L vs. temperature plot, the thermal expansion curve could be divided into two regions, one is the low temperature region (100–260 °C); the other is the high temperature region (260–850 °C). The TEC value calculated from 100–800 °C for LBSC55 was 24.9 × 10⁻⁶ K−1. The specimens show a linear expansion in the low temperature region (100–260 °C) with a TEC value of 17.1 × 10⁻⁶ K−1 and an increase in slope in the higher temperature region (260–800 °C) with a TEC value of 27.0 × 10⁻⁶ K−1. The information about the thermal expansion coefficient values of LBSC55 is detailed in Table 2. Generally, larger TEC values in cobalt-based perovskites can be due to the increase of the ionic radius of Co during the thermal expansion measurement. As seen in the curve of  vs. temperature, there is an inflection region ranging from 230 to 330 °C. The peak inflection point located at about 260 °C is associated with the initial temperature for the loss of lattice oxygen and the formation of oxygen vacancies.21 Meanwhile, the reduction in Co valence has to take place to maintain the electrical neutrality.22 As the temperature is elevated above 260 °C, some of the Co4+ ions are reduced to Co3+ with a loss of oxygen; and Co3+ ions transit from low-spin (t62ge0g) to high-spin (t42ge2g) states.23,24 The relationship based on the defect reaction using the Kroger–Vink notation is described as follows.
| |
 | (3) |
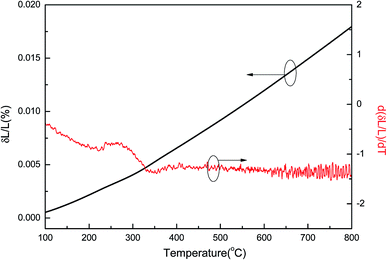 |
| | Fig. 2 Thermal expansion curve and first derivative δL vs. temperature for LBSC55. | |
Table 2 Thermal expansion coefficient (TEC) values of LBSC55 cathode
| Specimen |
TEC (10−6 K−1) |
| 100–800 °C |
100–260 °C |
260–800 °C |
| LBSC55 |
24.9 |
17.1 |
27.0 |
The ionic radii of Co4+ and Co3+ with a coordination number of 6 and high spin are 0.53 and 0.61 nm, respectively.25 The reduction of Co ions results in a decrease in the B–O bond according to Pauling’s second rule, causing an increase in the size of BO6 octahedra, therefore, the lattice expansion is enhanced.26
To determine the oxygen content (5 + δ), thermogravimetric analysis was carried out in air. The change in mass and oxygen content (5 + δ) as a function of temperature for LBSC55 is shown in Fig. 3. The oxygen content is about 5.71 at room temperature determined via iodometric titration. Obviously, there is a significant weight loss above 260 °C indicating that the specimen lost lattice oxygen above this certain temperature. The weight loss upon heating was due to a partial loss of lattice oxygen along with a reduction of Co4+ to Co3+ and/or Co3+ to Co2+ with increased temperature.27–29 It is interesting that the weight loss result is consistent with thermal expansion behavior. There is an onset temperature of about 260 °C at which Co4+ ions are initially reduced to Co3+ accompanied with a loss of oxygen. The average valence of cobalt ions was decreased from 3.21 at room temperature to 3.08 at 800 °C. Meanwhile, there is about a 0.13 oxygen atom loss per formula unit of LBSC55. The oxygen content (5 + δ) and average Co valence values as a function of temperature in air are detailed in Table S2.†
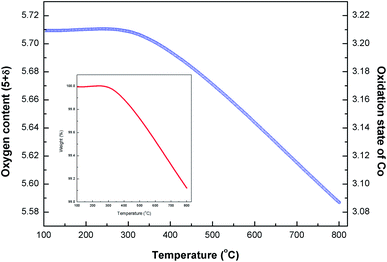 |
| | Fig. 3 Oxygen content (5 + δ) and oxidation state of Co for calcined LBSC55 as a function of temperature in air. The inset reveals the weight loss as a function of temperature. | |
Fig. 4(a) shows the electrical conductivity of the sintered LBSC55 in temperature range of 400–800 °C in air. The LBSC55 revealed a gradual decrease in electrical conductivity with increasing temperature, exhibiting a metallic behavior. The predominant defects in LBSC55 are interstitial oxygen  and electronic holes
  .30 Using the Kröger Vink notation, the following pseudo-chemical reaction exhibits the interaction between the defects and the atmosphere.
| |
 | (4) |
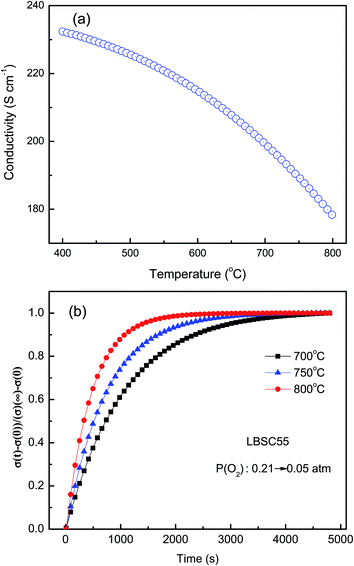 |
| | Fig. 4 (a) Temperature dependence of the electrical conductivity in air; (b) normalized conductivity relaxation plots for the step-change reduction in oxygen pressure from p(O2) = 0.21 to p(O2) = 0.05 atm. | |
The electroneutrality condition is given by the following equation.
| |
 | (5) |
The values of conductivity were in the range of 232–178 S cm−1 at temperatures ranging from 400 °C to 800 °C. The conductivity of the LBSC55 cathode meets the requirement for a SOFC cathode.31 The concentration of Co4+ ions in LBSC55 decreased with increasing temperature due to the loss of lattice oxygen, and creation of  instead of
  , therefore the conductivity decreased. Similar conductivity behavior has also been observed in other perovskite-typed mixed conductors.32–34
The electrode performance is highly associated to the intrinsic properties such as bulk diffusion and surface exchange kinetics. In this research, Dchem was measured by an ECR technique based on the principle that a variation in the ambient atmosphere leads to a change in the oxygen vacancy concentration of the MIEC. Due to the local electroneutrality requirement, the abrupt change in the p(O2) of the surrounding atmosphere induces a corresponding change of the charge carrier concentration (oxygen vacancy), which is reflected as a relaxation of the apparent macroscopic electrical conductivity. Conductivity relaxation models usually assume small departures from thermal equilibrium and a simple linear model for the surface exchange kinetics.35 Fig. 4(b) reveals the electrical conductivity relaxation curves of LBSC55 from 700 to 800 °C (at intervals of 50 °C) with a sudden change in p(O2) from 0.21 to 0.05 atm. The conductivity reached its steady state value faster for high temperatures than for low temperatures, leading to the fact that the Dchem at high temperatures was larger than at low temperatures. The Dchem values of LBSC55 are 1.49 × 10⁻⁴, 2.75 × 10⁻⁴ and 5.37 × 10⁻⁴ cm2 s−1 at 700 °C, 750 °C and 800 °C, respectively. Based on previous literature, for single perovskites, the Dchem values of Ba0.6Sr0.4Co0.9Nb0.1O3−δ ranged from 1.2 × 10⁻⁵ cm2 s−1 at 450 °C to 1.3 × 10⁻⁶ cm2 s−1 at 600 °C.36 Chen et al.37 reported that the Dchem values of Ba0.5Sr0.5Co0.8Fe0.2O3−δ are between 2.5 × 10⁻⁵ and 3.9 × 10⁻⁴ cm2 s−1 for temperatures between 600–800 °C; similarly, the Dchem value of La0.1Sr0.9Co0.8Fe0.2O3−δ is 1.85 × 10⁻⁵ cm2 s−1 at 650 °C.38 For a double perovskite, Kim et al. presented that Dchem values of PrBaCo2O5+δ are between 3 × 10⁻⁶ and 5 × 10⁻⁵ cm2 s−1 for temperatures between 300–500 °C.39 The variance between the previous literatures and this work is attributed to the different procedures applied during the ECR measurement or the variation between sample compositions especially crystallinity and stoichiometry. In this study, the order of the Dchem values is very close to previously published papers.
The temperature dependence of the oxygen permeation flux (JO2) for LBSC55 membrane with a 1.0 mm thickness under air/He with an oxygen partial pressure gradient over the temperature range of 500–800 °C is shown in Fig. 5(a). The oxygen permeation flux increased from 0.210 mL min−1 cm−2 at 500 °C to 0.302 mL min−1 cm−2 at 800 °C under synthetic air at a flow rate of 50 mL min−1, and helium at a rate of 25 mL min−1. The reason for this could be ascribed to the fact that the oxygen permeation flux raised steadily with temperature because of the increase in oxygen ionic bulk diffusion, surface exchange rate and oxygen vacancy concentration.40,41
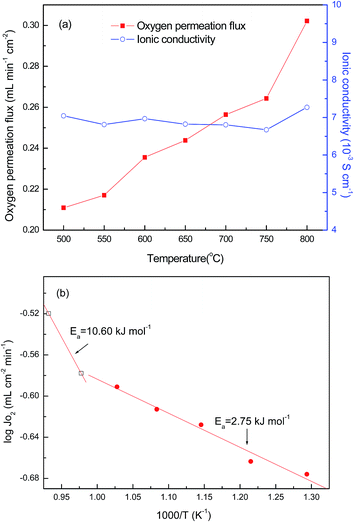 |
| | Fig. 5 (a) Oxygen permeation flux and nominal ionic conductivities as a function of temperature for LBSC55 and (b) the corresponding Arrhenius plot. | |
The ionic conductivity also could be evaluated via the Wagner relationship based on the oxygen permeation flux results.42
| |
 | (6) |
where
R is the ideal gas constant,
L is the membrane thickness,
T is the absolute temperature,
F is the Faraday constant,
σe is the electronic conductivity, and
σi is the oxygen ionic conductivity.

and

denote the oxygen partial pressure on the air side and the oxygen partial pressure on the sweep side, respectively. In this case, the conductivity of LBSC55 is totally dominated by electrical conductivity.
σe is significantly greater than
σi so that
eqn (6) could be rewritten as follows.
| |
 | (7) |
The ionic conductivity can be estimated based on the oxygen permeation flux using the following equation.
| |
 | (8) |
The calculated ionic conductivity is also depicted in Fig. 5(a). The ionic conductivity ranged from 6.67 × 10⁻³ to 7.27 × 10⁻³ S cm−1, and it seems to be independent of temperature. This is due to the fact that the conductivity of LBSC55 is mostly from electronic not ionic contributions. To further understand the oxygen migration process, the Arrhenius plot for oxygen permeation flux versus the reciprocal temperature was drawn. It was worth noting that the Arrhenius behavior for the oxygen permeation flux could be divided into two temperature regions (500–700 °C and 750–800 °C) as shown in Fig. 5(b). It was presumed that there are two different rate-determined processes (bulk diffusion process and slow surface exchange process) within two temperature regions. Generally, for the entire oxygen diffusion activation energy, the slow surface exchange process has a higher activation energy compared with the bulk diffusion process. Based on the calculation of the slope of the Arrhenius plot, the activation energies for the high-temperature region and low-temperature region are 10.60 and 2.75 kJ mol−1, respectively. This suggested that the surface exchange process is above 750 °C, whereas when the temperature ranged from 500 to 700 °C, the bulk diffusion process plays an important role.
To further understand the oxygen migration mechanism related to the membrane thickness, several membrane thicknesses from 0.8 to 1.4 mm were prepared. Based on eqn (6), the limiting step of the oxygen permeation is the bulk diffusion. The relationship between oxygen permeation flux (JO2) and the reciprocal of the membrane thickness (1/L) should be a straight line passing through the origin of the coordinates.43 This is observable, when the thickness is larger than 1.2 mm over the temperature range of 500 to 800 °C, as shown in Fig. 6. This implied that as the membrane thickness is greater than 1.2 mm, the oxygen permeation process is dominated by the bulk diffusion of oxygen ions. On the contrary, as the membrane thickness is less than 1.2 mm, the oxygen permeation process is mostly limited by surface oxygen exchange.
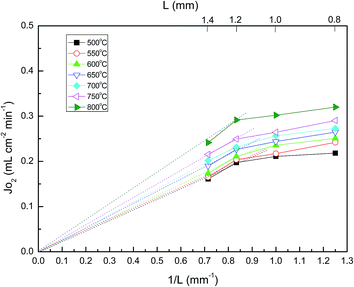 |
| | Fig. 6 Oxygen permeation flux dependence on the reciprocal thickness of the membrane for LBSC55 at different temperatures. | |
The io value is an important parameter for assessing the intrinsic oxygen reduction rate and the electrochemical properties of a cathode.44 In the present work, the io values were identified using electrochemical impedance spectrometry (EIS), low-field (LF) and high-field (HF) techniques. For the EIS technique, io values were determined from the RP of the Nyquist plot as depicted in Fig. 7(a). For the LF technique, io values were identified from the slope of the i vs. η plots as shown in Fig. 7(b). For the HF technique, io values can be obtained from the y-intercept of i vs. η plots as shown in Fig. 7(c). The detailed information regarding these techniques can be found in our group’s earlier published paper.45 The io values of LBSC55 determined via EIS, LF and HF techniques are summarized in Table 3. The io values increased from 11.1 mA cm−2 for 600 °C to 154.1 mA cm−2 for 800 °C for the EIS technique, the io values increased from 7.5 mA cm−2 for 600 °C to 63.6 mA cm−2 for 800 °C for the LF technique, while the io values increased from 23.4 mA cm−2 for 600 °C to 172.9 mA cm−2 for 800 °C for the HF one. Obviously, the io values determined by the HF technique are greater than the other techniques for all temperatures. Fig. 7(d) shows the Arrhenius plots for io values collected at the LBSC55 cathode over the operating temperature range of 600–800 °C. The overall activation energy (Ea) for the ORR was determined using the following equation.
| |
 | (9) |
where
K is the pre-exponential constant, which can be calculated from the
y-intercept, and
Ea is the reaction activation energy. The
Ea for the ORR may be related to different cathode preparation methods or the cathode structure. The
Ea values determined
via EIS, LF and HF techniques were 102.2, 83.2 and 76.2 kJ mol
−1, respectively. The linearity of the Arrhenius plots indicates that LBSC cathodes are stable as a function of temperature. The activation value is relatively similar to our previous report in
ref. 45, which suggested that LBSC55 is a potential cathode for SOFCs due to its highly electrocatalytic activity.
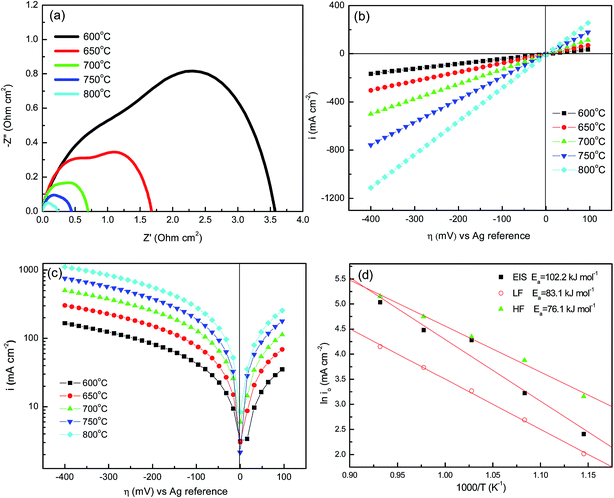 |
| | Fig. 7 (a) Nyquist plots of EIS; (b) cyclic voltammograms; (c) Tafel plots at 0.5 mV s−1 between 100 mV and −400 mV; and (d) Arrhenius plots of the ORR of the LBSC55 cathode on SDC electrolyte, where io values were obtained via EIS, low-field and high-field techniques over the temperature range of 600–800 °C in air. | |
Table 3 The io values of the LBSC55 cathode via EIS, low-field and high-field techniques over the temperature range of 600–800 °C
| T (°C) |
io (mA cm−2) |
| EIS |
LF |
HF |
| 600 |
11.1 |
7.5 |
23.4 |
| 650 |
25.2 |
14.7 |
48.4 |
| 700 |
72.3 |
26.2 |
77.3 |
| 750 |
88.1 |
41.9 |
115.2 |
| 800 |
154.1 |
63.6 |
172.9 |
In order to further investigate the process of the oxygen reduction reaction for the LBSC55 cathode, EIS was investigated at different oxygen partial pressures. In general, the interfacial polarization resistance (RP) changes with PO2 can be described by the following equation:46
| |
 | (10) |
and the overall oxygen reduction reaction could be expressed as follows.
| |
 | (11) |
The processes are complex, involving charge transfer, surface adsorption/dissociation, gas diffusion, and so on. The magnitude of n provides valuable information about the rate-limiting step in the oxygen reduction reactions at cathodes:47
| |
 | (12) |
| |
 | (13) |
| | |
n = 0.50, O2,ads. ⇔ 2Oads.
| (14) |
| | |
n = 1.00, O2(g) ⇔ O2,ads.
| (15) |
where
n = 0.10 has been associated with oxygen ion transfer from a triple-phase (TPB) and/or two-phase boundary to the electrolyte,
n = 0.25 with the charge transfer processes,
n = 0.50 with oxygen adsorption/desorption processes, and
n = 1.00 with gas phase diffusion of oxygen molecules in a porous cathode. However, the entire surface may serve as the active sites for ORR in MIEC conductors. This is due to the fact that oxygen ions transport through the MIEC bulk.
48,49 In
eqn (12), the oxygen ion transfer is not only from TPB sites but also two-phase boundary (2PB) sites (cathode/electrolyte interface). The
RP values are based on the Nyquist diagram of the impedance spectroscopy of the LBSC55 cathode on SDC electrolyte with various oxygen partial pressures at different temperatures as shown in Fig. S2.
† The log(
RP) dependence on log(
PO2) for LBSC55 measured at various temperatures is shown in
Fig. 8. Clearly, the
RP values increased with reducing
p(O
2) due to the decrease in mobile interstitial oxygen at lower
p(O
2). Based on the curve slopes, the
n values ranged from
n = 0.07 to
n = 0.12. This indicated that the main process of the ORR is dominated by oxygen ion transfer from TPB and/or 2PB sites of the cathode

to electrolyte in the temperature range of 600–800 °C.
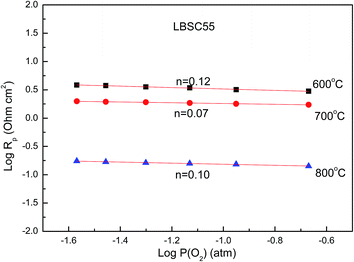 |
| | Fig. 8 The interfacial polarization resistance (RP) dependence on oxygen partial pressure for the LBSC55 cathode in the temperature range of 600–800 °C. | |
Conclusions
The conductivity values of LBSC55 are in the range of 232–178 S cm−1 over the temperature range of 400–800 °C. The concentration of Co4+ ions decreased with increasing temperature due to the loss of lattice oxygen (Co4+ → Co3+). The weight loss upon heating was due to a partial loss of lattice oxygen along with a reduction of Co4+ to Co3+ above 260 °C. The oxygen permeation flux for LBSC55 membrane with 1.0 mm thickness was in the range of 0.210–0.302 mL min−1 cm−2, and the ionic conductivity ranged from 6.67 × 10⁻³ to 7.27 × 10⁻³ S cm−1 and is independent of temperature over the range of 500–800 °C under air at a flow rate of 50 mL min−1, and helium at a rate of 25 mL min−1. As for the oxygen migration mechanism related to the membrane thickness, when the membrane thickness is greater than 1.2 mm, the oxygen permeation process is dominated by the bulk diffusion of oxygen ions. Whereas, when the membrane thickness is less than 1.2 mm, the oxygen permeation process is mostly limited by surface oxygen exchange. The activation energies (Ea) of the oxygen reduction reaction (ORR) determined from the slope of Arrhenius plots for electrochemical impedance spectrometry, low-field and high-field techniques are 102.2, 83.1 and 76.1 kJ mol−1, respectively. The main process of the oxygen reduction reaction is dominated by oxygen ion transfer from TPB and/or 2PB sites of the cathode to electrolyte in the temperature range of 600–800 °C. Based on the chemical bulk diffusion coefficient, oxygen transportation and electrochemical properties, they indicated that LBSC55 is a candidate cathode for SOFCs.
Acknowledgements
The authors would like to thank the Ministry of Science and Technology of Taiwan for financially supporting this research under contract numbers: MOST 105-2119-M-259-003 and MOST 105-2119-M-259-002.
References
- E. P. Murray, T. Tsai and S. A. Barnett, Nature, 1999, 400, 649–651 CrossRef CAS PubMed.
- S. H. Cui, J. H. Li, X. W. Zhou, G. Y. Wang, J. L. Luo, K. T. Chuang, Y. Baia and L. J. Qiao, J. Mater. Chem. A, 2013, 1, 9689–9696 CAS.
- Z. P. Shao and S. M. Haile, Nature, 2004, 431, 170–173 CrossRef CAS PubMed.
- W. Zhou, Z. P. Shao, R. Ran, W. Q. Jin and N. P. Xu, Chem. Commun., 2008, 44, 5791–5793 RSC.
- X. Zhang, L. Liu, Z. Zhao, B. Tu, D. Ou, D. Cui, X. Wei, X. Chen and M. Cheng, Nano Lett., 2015, 15, 1703–1709 CrossRef CAS PubMed.
- N. Q. Minh, Solid State Ionics, 2004, 174, 271–277 CrossRef CAS.
- C. Kuroda, K. Zheng and K. Swierczek, Int. J. Hydrogen Energy, 2013, 38, 1027–1038 CrossRef CAS.
- A. Tarancon, A. Morata, G. Dezanneau, S. J. Skinner, J. A. Kilner, S. Estradé, F. H. Ramirez, F. Peiro and J. R. Morante, J. Power Sources, 2007, 174, 255–263 CrossRef CAS.
- H. Gu, H. Chen, L. Gao, Y. Zheng, X. Zhu and L. Guo, Int. J. Hydrogen Energy, 2009, 34, 2416–2420 CrossRef CAS.
- J. H. Kim, Y. Kim, P. A. Connor, J. T. S. Irvine, J. Bae and W. Zhou, J. Power Sources, 2009, 194, 704–711 CrossRef CAS.
- W. Liu, C. Yang, X. Wu, H. Gao and Z. Chen, Solid State Ionics, 2011, 192, 245–247 CrossRef CAS.
- J. H. Kim, F. Prado and A. Manthiram, J. Electrochem. Soc., 2008, 155, B1023–B1028 CrossRef CAS.
- X. Zhang and M. Jin, J. Power Sources, 2010, 195, 1076–1078 CrossRef CAS.
- J. H. Kim, M. Cassidy, J. T. S. Irvine and J. Bae, J. Electrochem. Soc., 2009, 156, B682–B689 CrossRef CAS.
- Y. P. Fu, S. B. Wen and C. H. Lu, J. Am. Ceram. Soc., 2008, 91, 127–131 CrossRef CAS.
- A. Subardi, C. C. Chen, M. H. Cheng, W. K. Chang and Y. P. Fu, Electrochim. Acta, 2016, 204, 118–127 CrossRef CAS.
- R. J. Nadalin and W. B. Brozda, Anal. Chim. Acta, 1963, 28, 282–293 CrossRef CAS.
- Y. P. Fu, J. Ouyang, C. H. Li and S. H. Hu, J. Power Sources, 2013, 240, 168–177 CrossRef CAS.
- Y. Chen, B. Qian, S. Li, Y. Jiao, M. O. Tade and Z. Shao, J. Membr. Sci., 2014, 449, 86–96 CrossRef CAS.
- A. Jun, J. Kim, J. Shin and G. Kim, Int. J. Hydrogen Energy, 2012, 37, 18381–18388 CrossRef CAS.
- Y. Teraoka, M. Yoshimatsu, N. Yamazoe and T. Seiyama, Chem. Lett., 1984, 893–896 CrossRef CAS.
- A. L. Shaula, V. V. Kharton, N. P. Vyshatko, E. V. Tsipis, M. V. Patrakeev, F. M. B. Marques and J. R. Frade, J. Eur. Ceram. Soc., 2005, 25, 489–499 CrossRef CAS.
- K. Huang, H. Y. Lee and J. B. Goodenough, J. Electrochem. Soc., 1998, 145, 3220–3227 CrossRef CAS.
- M. A. Senaris-Rodriguez and J. B. Goodenough, J. Solid State Chem., 1995, 116, 224–231 CrossRef CAS.
- R. D. Shannon, Acta Crystallogr., Sect. A: Cryst. Phys., Diffr., Theor. Gen. Crystallogr., 1976, 32, 751–767 CrossRef.
- B. Wei, Z. Lu, X. Huang, J. Miao, X. Sha, X. Xin and W. Su, J. Eur. Ceram. Soc., 2006, 26, 2827–2832 CrossRef CAS.
- M. Meuffels, J. Eur. Ceram. Soc., 2007, 27, 285–290 CrossRef.
- S. Lia, W. Jin, N. Xu and J. Shi, J. Membr. Sci., 2001, 186, 195–204 CrossRef CAS.
- B. Wei, Z. Lü, S. Li, Y. Liu, K. Liu and W. Su, Electrochem. Solid-State Lett., 2005, 8, A428–A431 CrossRef CAS.
- V. V. Vashook, S. P. Tolochko, I. I. Yushkevich, L. V. Makhnacgh, I. F. Kononyuk, H. Altenburg, J. Hauck and H. Ullmann, Solid State Ionics, 1998, 110, 245–253 CrossRef CAS.
- S. Lu, X. Meng, Y. Ji, C. Fu, C. Sun and H. Zhao, J. Power Sources, 2010, 195, 8094–8096 CrossRef.
- T. Chen, H. Zhao, Z. Xie, L. Feng, X. Lu, W. Ding and F. Li, Int. J. Hydrogen Energy, 2012, 37, 5277–5285 CrossRef CAS.
- L. Jiang, T. Wei, R. Zeng, W. X. Zhang and Y. H. Huang, J. Power Sources, 2013, 232, 279–285 CrossRef CAS.
- S. Pang, J. Jiang, X. Li, Z. Su, H. Xu, Q. Xu and C. Chen, Int. J. Hydrogen Energy, 2012, 37, 6836–6843 CrossRef CAS.
- J. E. Elshof, M. H. R. Lankhorst and H. J. M. Bouwmeester, J. Electrochem. Soc., 1997, 144, 1060–1067 CrossRef CAS.
- C. Huang, D. Chen, Y. Lin, R. Ran and Z. Shao, J. Power Sources, 2010, 195, 5176–5184 CrossRef CAS.
- D. Chen and Z. Shao, Int. J. Hydrogen Energy, 2011, 36, 6948–6956 CrossRef CAS.
- M. B. Choi, K. T. Lee, H. S. Yoon, S. Y. Jeon, E. D. Wachsman and S. J. Song, J. Power Sources, 2012, 220, 377–382 CrossRef CAS.
- G. Kim, S. Wang, A. J. Jacobson, L. Reimus, P. Brodersen and C. A. Mims, J. Mater. Chem., 2007, 17, 2500–2505 RSC.
- D. Han, J. Wu, Z. Yan, K. Zhang, J. Liu and S. Liu, RSC Adv., 2014, 4, 19999–20004 RSC.
- J. Yang, H. Zhao, X. Liu, Y. Shen and L. Xu, Int. J. Hydrogen Energy, 2012, 37, 12694–12699 CrossRef CAS.
- K. Wiik, S. Aasland, H. L. Hansen, I. L. Tangen and R. Ødegard, Solid State Ionics, 2002, 152–153, 675–680 CrossRef CAS.
- Y. Lu, H. Zhao, X. Cheng, Y. Jia, X. Du, M. Fang, Z. Du, K. Zheng and K. Swierczek, J. Mater. Chem. A, 2015, 3, 6202–6214 CAS.
- S. B. Adler, Chem. Rev., 2004, 104, 4791–4843 CrossRef CAS PubMed.
- A. Subardi, M. H. Cheng and Y. P. Fu, Int. J. Hydrogen Energy, 2014, 39, 20783–20790 CrossRef CAS.
- A. Jaiswal and E. D. Wachsman, J. Electrochem. Soc., 2005, 152, A787–A790 CrossRef CAS.
- F. C. Meng, T. Xia, J. Wang, Z. Shi, J. P. Lian, H. Zhao, J. M. Bassat and J. C. Grenier, Int. J. Hydrogen Energy, 2014, 39, 4531–4543 CrossRef CAS.
- J. Kim, W. Y. Seo, J. Shin, M. Liu and G. Kim, J. Mater. Chem. A, 2013, 1, 515–519 CAS.
- J. T. S. Irvine, D. Neagu, M. C. Verbraeken, C. Chatzichristodoulou, C. Graves and M. B. Mogensen, Nature Energy, 2016, 15014 CrossRef CAS.
Footnote |
| † Electronic supplementary information (ESI) available. See DOI: 10.1039/c7ra00125h |
|
| This journal is © The Royal Society of Chemistry 2017 |
Click here to see how this site uses Cookies. View our privacy policy here.  Open Access Article
 *a
*a
 at the same time. The electrical conductivity exhibited a metallic behavior with values that gradually decreased from 232 S cm−1 at 400 °C to 178 S cm−1 at 800 °C. The chemical bulk diffusion coefficient (Dchem) values of LBSC55 are 1.49 × 10⁻⁴, 2.75 × 10⁻⁴ and 5.37 × 10⁻⁴ cm2 s−1 at 700 °C, 750 °C and 800 °C, respectively. The oxygen permeation flux for LBSC55 membrane with 1.0 mm thickness increased from 0.210 mL min−1 cm−2 at 500 °C to 0.302 mL min−1 cm−2 at 800 °C under synthetic air at a flow rate of 50 mL min−1, with helium at a rate of 25 mL min−1. The activation energies of oxygen permeation for the high temperature region (750–800 °C) and low temperature region (500–700 °C) are 10.60 and 2.75 kJ mol−1, respectively. This suggested that the surface exchange process is dominant above 750 °C and at low temperature ranges the bulk diffusion process is dominant for oxygen ion diffusion. The main process of the oxygen reduction reaction is dominated by oxygen ion transfer from TPB and/or 2PB sites of the cathode to electrolyte in the temperature range of 600–800 °C. Based on the chemical bulk diffusion coefficient, oxygen permeation and electrochemical properties, LBSC55 is a potential cathode for solid oxide fuel cells (SOFCs).
 versus t. The values for Dchem could be estimated by fitting the ECR curves. The experimental details follow those of our group’s earlier published paper.18

 vs. temperature, there is an inflection region ranging from 230 to 330 °C. The peak inflection point located at about 260 °C is associated with the initial temperature for the loss of lattice oxygen and the formation of oxygen vacancies.21 Meanwhile, the reduction in Co valence has to take place to maintain the electrical neutrality.22 As the temperature is elevated above 260 °C, some of the Co4+ ions are reduced to Co3+ with a loss of oxygen; and Co3+ ions transit from low-spin (t62ge0g) to high-spin (t42ge2g) states.23,24 The relationship based on the defect reaction using the Kroger–Vink notation is described as follows.

 and electronic holes
  .30 Using the Kröger Vink notation, the following pseudo-chemical reaction exhibits the interaction between the defects and the atmosphere.

 instead of
  , therefore the conductivity decreased. Similar conductivity behavior has also been observed in other perovskite-typed mixed conductors.32–34

 and
and  denote the oxygen partial pressure on the air side and the oxygen partial pressure on the sweep side, respectively. In this case, the conductivity of LBSC55 is totally dominated by electrical conductivity. σe is significantly greater than σi so that eqn (6) could be rewritten as follows.


 to electrolyte in the temperature range of 600–800 °C.


