 Open Access Article
Cisplatin combination drugs induce autophagy in HeLa cells and interact with HSA via electrostatic binding affinity†
Xuerui Chena,
Li Zhanga,
Shiping Dingb,
Qunfang Lei*a and
Wenjun Fang *a
*a
aDepartment of Chemistry, Zhejiang University, Hangzhou 310027, China. E-mail: fwjun@zju.edu.cn; qflei@zju.edu.cn; Fax: +86-571-88981416; Tel: +86-571-88981416
bSchool of Medicine, Zhejiang University, Hangzhou 310058, China
First published on 21st April 2017
Abstract
Cisplatin, as a significant chemotherapeutic drug for the treatment of cancers, was combined with rapamycin (RAPA), an autophagy inducer, or 3-methyladenine (3-MA), an autophagy inhibitor, and these cisplatin combination drugs were tested with HeLa cells to explore their specific effects on autophagy by cell viability assay, mitochondria membrane potential (MMP) determination, transmission electron microscopic (TEM) observation, dansylcadaverine (MDC) staining, and western blotting analysis. Results revealed that cisplatin combination drugs enhanced formation of autophagosomes, and morphological and biochemical markers of autophagy in HeLa cells can be clearly determined with the formation of enlarged acidic vesicles and conversion of light chain 3 (LC3) protein. Cisplatin combination drugs induce stronger effects on autophagy than either of the components does. Combination drug-induced autophagy inhibits the growth of HeLa cell in a dose-dependent manner and subsequently sensitizes the cells to apoptosis and cell death. Furthermore, interactions between cisplatin combination drugs and human serum albumin (HSA) were investigated under fluorescence, synchronous fluorescence, and circular dichroism analysis. Results suggest that cisplatin combination drugs can bind to HSA and induce conformation and microenvironmental changes of HSA via electrostatic binding affinity. These investigations can provide useful and fundamental information, which could be used in cytotoxic chemotherapy to dramatically increase efficacy in pharmaceutical and biotechnology fields.
Introduction
Dying cells can generate amounts of autophagic vacuoles (AVO) and clear a lot of cytoplasm.1,2 The components are sequestered to form a double-membrane autophagosome before the cells ultimately die. The resultant autolysosomes encompass enzymes (i.e., acid hydrolases) which can break down membranes of autophagosome and the inner lysosomal compartments.3,4 Therefore, autophagy is regarded as a defense strategy, which can adaptively adjust nutrient recycling and maintain minimal homeostasis.5–8Nowadays, accumulating evidence on autophagy suggests that cancer cells tend to have reduced autophagy with reference to their normal counterparts and premalignant lesions. Autophagy triggers cancer cell death in response to various anti-cancer agents.9 Hence, a study on autophagy in cancer cells with exposure to new drugs is an important step in new anti-cancer drug research.10
On one hand, rapamycin (RAPA) has been found to be an autophagy inducer in bio-medical fields, which increases sensitivity of cancer cells to anti-cancer drugs.11,12 A RAPA modulated signal transduction pathways is involved in the cell cycle process from G1 to S-phase and it is currently under evaluation in phase III clinical trials for various cancers. 3-Methyladenine (3-MA) has been demonstrated to be an autophagy inhibitor of class III PI3K which plays a pivotal role in the process of autophagy.13,14 On the other hand, cisplatin has been treated as an effective anti-cancer drug in clinical medicine, but the use of it is often limited by its intolerable side effects and inevitable chemoresistance.8,15–17 Numerous chemotherapeutic drugs are known to induce autophagic cell death. For example, cisplatin exerts cytotoxic effects via disrupting the DNA structure in cells from formation of intrastrand adducts and interstrand cross-links.18–21 Thus, it's meaningful to combine cisplatin with other drugs to induce autophagy of cancer cells.
Before targeting receptor cells, cisplatin combination drugs bind to proteins in blood when they enter veins.11 Human serum albumin (HSA), which acts as the major transporter of many drugs in blood circulation, can interact with many organic and inorganic molecules.22 Albumin binding affects transportation, distribution, and metabolism of the cisplatin combination drugs, and further influences availability and toxicity during chemotherapy. Low binding affinity of a drug to protein may result in poor distribution and short life-span in blood, whereas high binding affinity interferes with desired drug efficacy.23
The goal of this work is to elucidate the influence of two series of cisplatin combination drugs on the autophagic process of HeLa cells and interactions between the drugs and HSA. We hope these investigations will provide valuable information on cytotoxic chemotherapy of cisplatin combination drugs and help develop potential anti-cancer drugs against cervical cancer cells.
Experimental and methods
Reagents
Cisplatin, rapamycin (RAPA), 3-methyladenine (3-MA), trypsin/EDTA solution (1.7 × 10⁵ U L−1 of trypsin and 0.2 g L−1 of EDTA), phosphate buffered saline (PBS), fetal bovine serum (FBS), anti-β-actin antibody, dimethyl sulfoxide (DMSO), cacodylate, Dulbecco's modified eagle medium (DMEM), mitochondrion membrane potential analysis kit, [3-(4,5-dimethylthiazol-2-yl)-2,5-diphenyltetrazolium bromide] (MTT), 5,5′,6,6′-tetrachloro-1,1′,3,3′-tetraethylbenzimidazolcarbcyanine iodide (JC-1) and human serum albumin (HSA) were purchased from Sigma-Aldrich (USA) and used as received. The LC3-II primary antibodies were purchased from Cell Signaling Technologies (USA). HeLa cell line, HEK 293 cell line, and FL cell line were provided by the Institute of Immunology, School of Medicine, Zhejiang University (China). Ultrapure water with a resistivity higher than 1.82 × 10⁶ Ω m at 25 °C was produced from a Millipore Q3 system (USA). Drug samples of cisplatin, RAPA, 3-MA and their combinations were prepared by dissolving them in DMSO and diluting with DMEM to the indicated concentrations before exposing to HeLa cells, respectively. The stock solution of HSA was prepared by dissolving solid HSA in Tris–HCl buffer (0.05 M Tris–HCl/0.1 M NaCl, pH 7.40) and stored at 0–4 °C.Cell culture
HeLa cell line, HEK 293 cell line, and FL cell line were maintained in DMEM supplemented with 10% FBS and 50 U mL−1 penicillin and 50 mg mL−1 streptomycin. Cell cultures were maintained at 37 °C in a humidified 5% CO2 atmosphere. All the incubations with cisplatin combination drugs were carried out under the same conditions of temperature, humidity, and CO2 percentage.Transmission electron microscopy observation
A transmission electron microscope (TEM, JEM-1200EX, JEOL, Japan) was used to detect existence of autophagy vesicles, which are the morphological evidence of autophagy. After HeLa cells were incubated for 24 h with different combination drugs, they were washed with PBS and then centrifuged at 1000 rpm for 5 min. Resulting cell pellets were fixed with a solution containing 2.5% glutaraldehyde plus 2% paraformaldehyde in 0.1 mol L−1 cacodylate buffer, pH = 7.3, for 1 h, after the supernatants were removed. Then, the samples were immersed in 1% OsO4 in the same buffer for 30 min and TEM was used to observe the ultrathin sections at 100 kV.Cell viability by MTT assay
The effects of cisplatin combination drugs on viability of HeLa cells was measured by the MTT assay. Median-effect plot analysis and calculation of the multiple medicines effect/Combination Index (CI) were performed using a well-established method via a commercial software package obtained from Calcusyn (Biosoft). MTT can give a water-soluble formazan product in the presence of DMSO and be used in the microculture screening assay for cell cultures. The ratio absorbance at 570 nm of sample versus control colored products is proportional to cell viability. HeLa cells were seeded in 96-well plates (1 × 10⁴ cells per well) and then exposed to cisplatin at concentrations from 1 μg mL−1 to 50 μg mL−1, to RAPA at concentrations from 0.02 μg mL−1 to 1.0 μg mL−1, and to 3-MA at concentrations from 0.2 μg mL−1 to 50 μg mL−1 for 4 h, 24 h, and 48 h, respectively. The cells were also treated with combination drugs of RAPA/3-MA with 2 μg mL−1 or 40 μg mL−1 cisplatin for 4 h, 24 h, and 48 h, respectively. For each well, the medium was removed and replaced with MTT which was diluted from 5 mg mL−1 in PBS to 0.5 mg mL−1 with DMEM medium. Then, the cells were incubated at 37 °C for 4 h. The MTT reaction product was extracted with DMSO before absorbance at 570 nm was measured.Mitochondrial membrane potential measurement
Mitochondrial membrane potential (MMP) was studied as a cellular functional assay, which was estimated from a fluorescent probe, JC-1, that accumulated in the mitochondria. After treating with the drugs for 24 h, the cells were washed with PBS and exposed to JC-1 (10 μg mL−1). The mitochondria with low MMP had green fluorescence (485 excitation/535 emission), while at a high MMP, the aggregated JC-1 molecules exhibited red-shifted fluorescence (535 excitation/590 emission). Hence, a loss of MMP was detected by a red to green shift. After 20 min incubation at 37 °C, the changes in MMP were measured by flow cytometry.Detection of autophagic vacuoles by MDC
A confocal microscope was used to identify the formation of autophagic vacuoles during autophagy. The fluorescent dye dansylcadaverine (MDC) as the marker for autophagy could specifically stain autophagosomes to detect the occurrence of AVO.24 Cells were seeded in 24-well plates and treated with different combination drugs. After 24 h, the cells were stained with 0.05 mmol L−1 MDC at 37 °C for 10 min. Subsequently, the cells were washed three times to remove MDC in PBS and observed under confocal microscopy (Zeiss Lsm710nlo).Western blotting analysis
Hallmarked by accumulation of vacuoles that sequester and target cytoplasmic components for lysosomal degradation, the autophagic process is dependent on autophagy proteins, including LC3, p62, and Beclin-1. The change of microtubule-associated protein light chain 3 (LC3) is usually used to monitor the autophagic process. During the activation of autophagy, LC3 is converted from LC3-I (18 kDa) to LC3-II (16 kDa), which accumulates on the autophagosome membrane. Becline-1 is one of the necessary factors in an autophagic process, and it can regulate the formation of AVO through mediating the location of autophagic protein in a phagophore. For western blotting analysis, HeLa cells were seeded at a concentration of 3 × 10⁶ cells per well in 6-well plates and incubated overnight, then exposed to cisplatin combination drugs for 24 h. The cells were washed and put in ice-cold lysis buffer [50 mmol L−1 Tris–HCl (pH 7.5), 150 mmol L−1 NaCl, 1.0% Triton X-100, 20 mmol L−1 EDTA, 1 mmol L−1 Na3VO4, 1 mmol L−1 NaF, and protease inhibitors], then the same volume of loading buffer [10% SDS, 5% sucrose, 0.1% bromophenol blue, and 5% 2-mercaptoethanol] was added. Then samples were put on ice for 15 min and denatured at 95 °C for 15 min. Finally, the samples were subjected to western blotting analysis, and the band densities were analyzed using AlphaEaseFC or Quantity One software.Fluorescence measurement
Fluorescence intensities of drug–HSA aggregates were measured with an FP-6500 fluorescence spectrophotometer (JASCO, Japan). The fluorescence spectra were taken with HSA concentration of 0.9396 μM. Different volumes of the buffer were added to stock cisplatin combination solutions to obtain the desired concentrations. Intrinsic fluorescence was measured by exciting the HSA solution at 280 nm, and emission spectra were scanned from 250 to 400 nm. The excitation and emission slits were set at 5 nm. A quartz cell with 1.0 cm path length was used and the measurements were carried out at 288 K, 298 K, and 310 K, respectively.Circular dichroic measurement
The secondary structure of HSA in the presence of cisplatin combination drugs was analyzed by circular dichroic (CD) spectroscopy (Biologic MOS-450, France). All CD measurements were recorded on a circular dichroic polarimeter by scanning the samples from 190 to 250 nm at 298 K. Spectra were collected at a protein concentration of 1.575 nM using a path length of 1 mm.Statistical analysis
Statistical analysis on synergy was used to evaluate the effects of cisplatin combination drug treatments. Results from the MTT assays were calculated by CalcuSyn for Windows computer program (Biosoft, Cambridge, the United Kingdom) to determine the presence of synergy between cisplatin and RAPA or 3-MA. The software uses a median-effect method, which is a well-established procedure to quantify the effects of drug combinations and to determine whether they produce greater effects together than expected from simple summation of their individual effects. Combination index (CI) values were obtained, and they reflect the nature of interactions between cisplatin combination drugs and HSA: CI < 1, synergistic activity; CI = 1, additive; CI > 1, antagonism.25 All of the above measurements were repeated at least three times and the data were presented as means ± SD. Statistical significance (p < 0.05) was evaluated by using Student t-test when only two groups were compared.Results and discussion
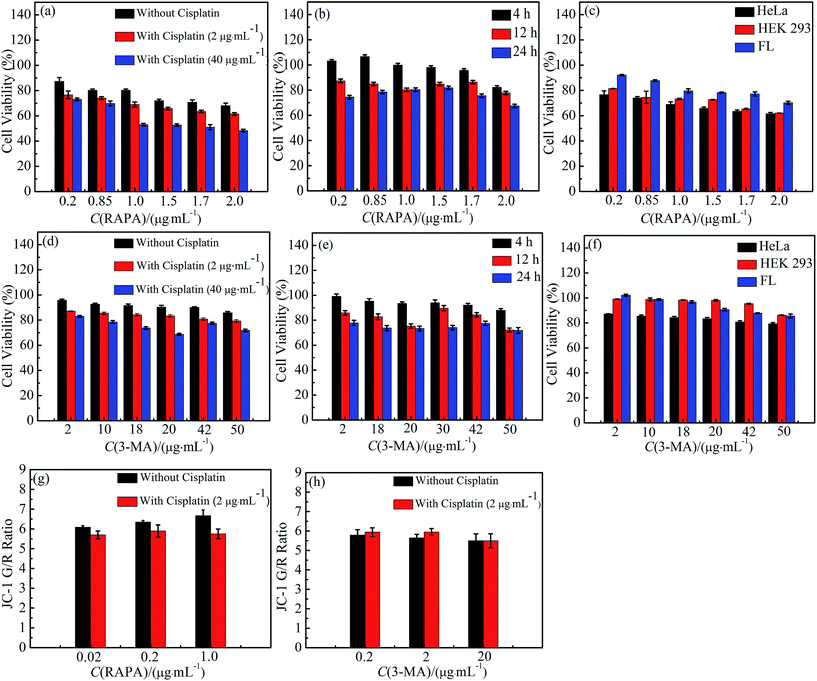
To investigate the toxicity of cisplatin combination drugs, 3-(4′,5′-dimethylthiazol-2′-thiazolyl)-2,5-diphenyltetrazolium bromide (MTT) assay and mitochondrion membrane potentials (MMP) were measured. HeLa cells as human cancer cells, HEK 293 cells, and FL cells as human normal cells were chosen with MTT assays. The cell viabilities of HEK 293 cells and FL cells are higher than those of Hela cells which suggests that cisplatin combination drugs are more effective for cancer cells. Cell viability decreased in an obviously dose-dependent manner when HeLa cells were exposed to 3-MA combination drugs. Simultaneously, various doses of RAPA in combination with 2 μg mL−1 cisplatin using HeLa cell lines resulted in a significant synergistic antiproliferative effect, with a Combination Index (CI) of <1, at a range of 0.01 to 0.19 (ESI Table S1†).25–30 However, antagonism effects on cell proliferation were observed with a CI > 1 when different concentrations of RAPA were combined with higher concentration of cisplatin (40 μg mL−1) in HeLa cell lines (ESI Table S1†).25 HeLa cells exposed to different concentrations of cisplatin and RAPA have a time-dependent decrease of viability (Fig. 1b).21 Antagonism has been found in HeLa cell lines treated with cisplatin and 3-MA (CI > 1; range, 1.19–5.68). Using different doses of drugs, results show that cell proliferation decreases slightly against time (Fig. 1b and e). Therefore, MTT results demonstrated that cisplatin combination drugs inhibit HeLa cells proliferation not only in a dose-dependent manner, but also in a time-dependent manner.31–34The MMP level of HeLa cells treated with cisplatin combination drugs is shown in Fig. 1g and h in which mitochondrial depolarization is detected by JC-1 staining. With increasing concentrations of RAPA, a higher fluorescence shift from green to red can be observed in HeLa cells treated with the RAPA combination drugs. Previous studies have shown that the mitochondrial depolarization is related to early stages of apoptosis, which indicates that the cytotoxicity of drugs has influence on MMP.35–37 Cisplatin can weaken the effect of RAPA decreasing MMP (Fig. 1g). However, HeLa cells treated with 3-MA exhibit a lower green/red ratio than those treated with 3-MA combination drugs.38 It follows that combination drugs can decrease the MMP (Fig. 1h). Relatively, 3-MA combination drugs have serious effects on organelles and show strong toxicity, while the RAPA combination drugs have a mild impairment to organelles.39–41
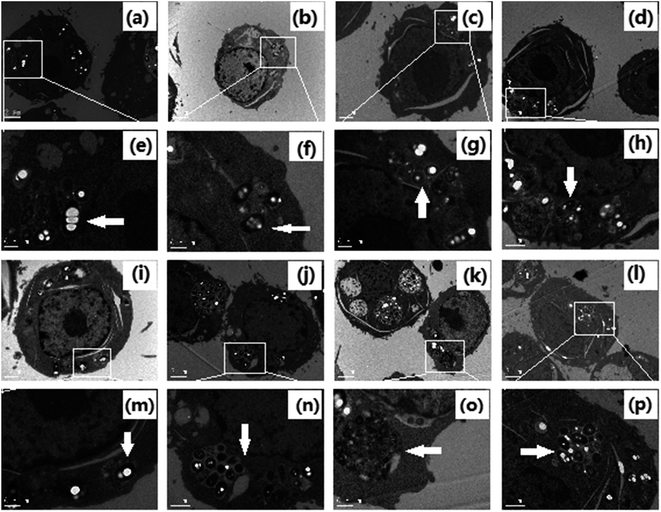
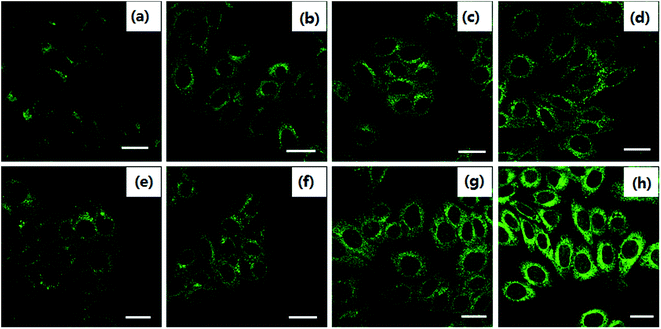
In order to observe the formation of autophagosomes, the morphologies of HeLa cells treated with cisplatin combination drugs were revealed by transmission electron microscopy (TEM) analysis and MDC staining (Fig. 2 and 3).42 HeLa cells incubated with RAPA combination drugs show an increasing number of lysosomes and disappearance of some cytoplasmic organelles (Fig. 2b–d). Fluorescence intensity of MDC with the combination drugs is up-regulated in comparison with that of the control group (Fig. 3). Some cellular materials have been found in characteristic double membrane vesicles, which are typical features of autophagosomes. For HeLa cells treated with 3-MA combination drugs, various cytoplasmic organelles were aggregated in large intracellular cytoplasmic vacuoles (Fig. 2i–k).
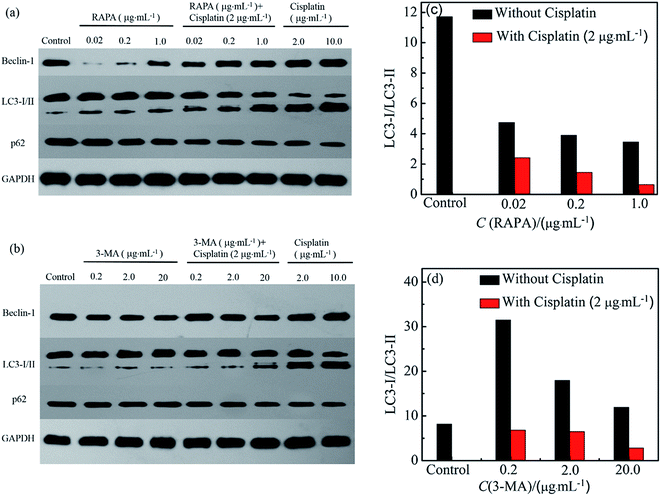
Drug induced biochemical markers of autophagy in HeLa cells were analyzed by western blotting. RAPA combination drugs caused slight increase of LC3-II and Becline-1 and slight decrease of p62 in HeLa cells compared to the control cells (Fig. 4). HeLa cells exposed to RAPA combination drugs show lower expression of p62 than cells treated with cisplatin or RAPA alone (Fig. 4a).43 These results reveal that addition of RAPA enhances the autophagy resulting from cisplatin.
Furthermore, HeLa cells treated with 3-MA combination drugs were used to determine the change of LC3-II, Becline-1, and p62. Cisplatin with 3-MA can increase LC3-II level compared with cisplatin or 3-MA alone. The relative band densities of LC3-I/LC3-II decrease with an increase in RAPA concentration (Fig. 4a and c). In correspondence with the TEM images (Fig. 2), it's known that treatments with cisplatin combination drugs can activate an autophagic response in HeLa cells through ATG pathways.41,44,45
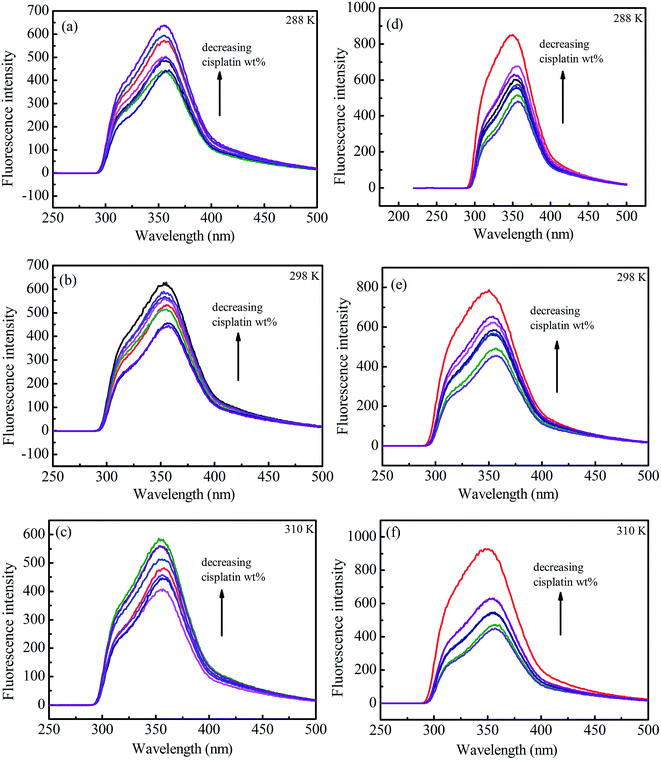
Fluorescence emission spectra of HSA in the presence of cisplatin combination drugs with different concentrations at 288 K, 298 K, and 310 K are shown in Fig. 5. To discuss the fluorescence sensitizing effect, the Stern–Volmer eqn (1) was used to calculate the binding constant (KSV). The free-energy change (ΔGo), enthalpy change (ΔHo), and entropy change (ΔSo) for the interaction between cisplatin combination drugs and HSA were determined as based on the Van't Hoff equation.
 | (1) |
 | (2) |
ΔG° = ΔH° −TΔS° = −RT![[thin space (1/6-em)]](https://www.rsc.org/images/entities/char_2009.gif) ln ln![[thin space (1/6-em)]](https://www.rsc.org/images/entities/char_2009.gif) K° K°
| (3) |
In the Stern–Volmer equation, F0 and F are the fluorescence intensities of HSA in the absence and presence of cisplatin combination drugs, respectively. C is the concentration of the cisplatin combination drugs (mol L−1), and KSV is the Stern–Volmer binding constant, τ0 is the average lifetime without drugs (τ0 = 10−8 s). The values of KSV for different cisplatin combination drugs were obtained from correlations in Fig. S11 (ESI†), and are listed in Table S2 (ESI†). Results are consistent with the electrostatic binding affinity between the drugs and amino acid residues.
HSA possesses intrinsic fluorescence resulting from tryptophan (Trp), tyrosine (Tyr), and phenylalanine (Phe) residues; however, it is almost all contributed by Trp alone (more than 95%).46,47 Fluorescence of Trp at the UV region may be changed as a result of interactions between other molecules with HSA. The fluorescence intensity increased and a slight blue shift of HSA, especially for 3-MA combination drugs, was observed with growing concentrations of combination drugs (Fig. 5d–f). Because a fluorescence sensitizing effect usually happens when biomacromolecules coexist with certain ligands, the binding of cisplatin combination drugs to HSA can alter the microenvironment of tryptophan residues to render them in a more hydrophobic environment.
From the Van't Hoff equation, thermodynamic parameters were obtained and they are listed in Table S2 (ESI†). For cisplatin combination drugs, ΔHo < 0 and ΔSo > 0, so an electrostatic interaction plays the main role.47 A negative value of ΔGo shows the protein–drug interaction occurs spontaneously. It's known that different driving forces play roles in the unfolding of a protein during a series of binding processes.48 The oxygen atoms in –C![[double bond, length as m-dash]](https://www.rsc.org/images/entities/char_e001.gif) O, –C–O–C, –OH of RAPA can display strong electronegativity (ESI Fig. S1†). The carboxyl group in amino acid residues may reduce electron density of a nitrogen atom, causing it to be more positively-charged. Thus, RAPA molecules can interact with amino acid residues through strong electrostatic forces. This kind of preferable affinity and the noncovalent interactions with HSA are favorable for delivering anticancer drugs to cancer cells.
O, –C–O–C, –OH of RAPA can display strong electronegativity (ESI Fig. S1†). The carboxyl group in amino acid residues may reduce electron density of a nitrogen atom, causing it to be more positively-charged. Thus, RAPA molecules can interact with amino acid residues through strong electrostatic forces. This kind of preferable affinity and the noncovalent interactions with HSA are favorable for delivering anticancer drugs to cancer cells.
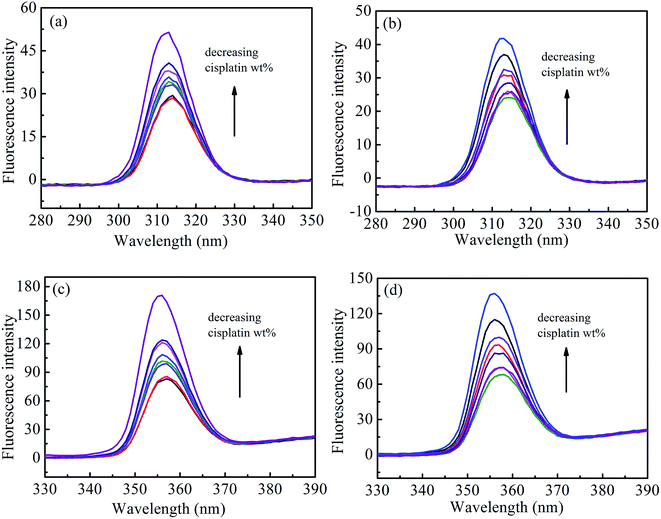
To further explore the effects of cisplatin combination drugs on the conformation of HSA, such as the characteristic changes of tyrosine (Tyr) or tryptophan (Trp) residues, synchronous fluorescence was performed through adjusting excitation and emission wavelength intervals (Δλ) at corresponding characterized values of 15 and 60 nm, respectively (Fig. 6). The maximum emission wavelengths (λmax) of Tyr residue (about 312 nm) in HSA exhibits no notable blue shift at the investigated concentration range when Δλ = 15 nm. Results reveal that the microenvironment around the Tyr residue undergoes no obvious change during the binding process. However, the λmax changes from 355 to 352 nm when Δλ = 60 nm, and it follows that the conformation of HSA is altered to be loosened, and Trp residues in solution with cisplatin combination drugs show stronger hydrophobicity than those in solution without the drugs. The obvious increase of fluorescence intensity suggests that Trp contributes remarkably to a change of the microenvironment of HSA. Interaction between cisplatin combination drugs and HSA may occur mainly in domain II of HSA where the Trp residues are located.
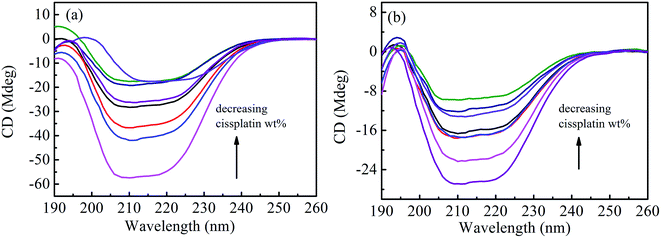
Circular dichroic (CD) spectroscopy was then used to monitor the secondary structural change of HSA upon interacting with cisplatin combination drugs from examining the alterations in α-helical content of the protein.49 As seen from Fig. 7, binding of the combination drugs to HSA causes decreasing intensity without apparent shifts of the peaks which demonstrates that binding of the combination drug induces slight decrement of the α-helix and increment of β-turn structure of HSA. Therefore, combination drugs can lead to structural changes of HSA with loss of helical structure stability and conformational destruction. Secondary structural contents calculated from the CDpro program are shown in Table S3 (ESI†).
The α-helix contents of free and combined HSA can be calculated from mean residue ellipticity (MRE) values at 208 nm using the following equation:
 | (4) |
 | (5) |
![[thin space (1/6-em)]](https://www.rsc.org/images/entities/char_2009.gif) 000 is the MRE value of a pure α-helix at 208 nm.47
000 is the MRE value of a pure α-helix at 208 nm.47
Conclusions
In conclusion, autophagy in HeLa cells treated with cisplatin combination drugs was profiled by MTT assay, flow cytometer, TEM analysis, MDC staining, and western blotting analysis. HeLa cells exposed to cisplatin combined with RAPA or 3-MA show a lower proliferation ratio, larger number of autophagosomes, and higher expression of autophagic protein in comparison with the control group. RAPA combination drugs lead to a significant synergistic antiproliferative effect, while 3-MA combination drugs have an antagonism effect.38,50 Cisplatin combination drugs have inducing influences on autophagy which can make a bridge between cancer cell autophagy and cancer cell death. The drug–HSA interaction demonstrates that cisplatin combination drugs bind to HSA mainly through electrostatic forces, which induce the conformational changes of HSA. Results showing the effects on autophagy and the interaction between HSA and cisplatin combination drugs provide support in the study of anti-cancer drugs.Conflict of interest
The authors declare no competing financial interest.Acknowledgements
This work was supported by the National Natural Science Foundation of China (No. 21473157).References
- R. Chennoufi, H. Bougherara, N. Gagey-Eilstein, B. Dumat, E. Henry, F. Subra, F. Mahuteau-Betzer, P. Tauc, M. P. Teulade-Fichou and E. Deprez, Chem. Commun., 2015, 51, 14881–14884 RSC.
- M. D. Martin, L. Calcul, C. Smith, U. K. Jinwal, S. N. Fontaine, A. Darling, K. Seeley, L. Wojtas, M. Narayan, J. E. Gestwicki, G. R. Smith, A. B. Reitz, B. J. Baker and C. A. Dickey, ACS Chem. Biol., 2015, 10, 1099–1109 CrossRef CAS PubMed.
- X. Z. Dong, T. T. Xie, X. J. Zhou, L. H. Mu, X. L. Zheng, D. H. Guo, P. Liu and X. Y. Ge, Anti-Cancer Drugs, 2015, 26, 331–342 CrossRef CAS PubMed.
- R. Li, Z. Ji, H. Qin, X. Kang, B. Sun, M. Wang, C. H. Chang, X. Wang, H. Zhang, H. Zou, A. E. Nel and T. Xia, ACS Nano, 2014, 8, 10280–10292 CrossRef CAS PubMed.
- Y.-H. Lee, F.-Y. Cheng, H.-W. Chiu, J.-C. Tsai, C.-Y. Fang, C.-W. Chen and Y.-J. Wang, Biomaterials, 2014, 35, 4706–4715 CrossRef CAS PubMed.
- M. A. Fuertes, C. Alonso and J. M. Perez, Chem. Rev., 2003, 103, 645–662 CrossRef CAS PubMed.
- K. Peynshaert, B. B. Manshian, F. Joris, K. Braeckmans, S. C. De Smedt, J. Demeester and S. J. Soenen, Chem. Rev., 2014, 114, 7581–7609 CrossRef CAS PubMed.
- K. Jiang, Y. C. Li, Q. M. Zhu, J. S. Xu, Y. P. Wang, W. G. Deng, Q. T. Liu, G. R. Zhang and S. S. Meng, BMC Cancer, 2014, 14, 1–15 CrossRef PubMed.
- A. Bergmann, Cell, 2007, 131, 1032–1034 CrossRef CAS PubMed.
- B. Fazi, W. Bursch, G. M. Fimia, R. Nardacci, M. Piacentini, F. Di Sano and L. Piredda, Autophagy, 2008, 4, 435–441 CrossRef CAS PubMed.
- M. Campone, V. Levy, E. Bourbouloux, D. B. Rigaud, D. Bootle, C. Dutreix, U. Zoellner, N. Shand, F. Calvo and E. Raymond, Br. J. Cancer, 2009, 100, 315–321 CrossRef CAS PubMed.
- S. T. Guo, C. M. Lin, Z. H. Xu, L. Miao, Y. H. Wang and L. Huang, ACS Nano, 2014, 8, 4996–5009 CrossRef CAS PubMed.
- T. T. Sun, Y. W. Yan, Y. Zhao, F. Guo and C. Y. Jiang, PLoS One, 2012, 7, e43442 CAS.
- S. Claerhout, L. Verschooten, S. Van Kelst, R. De Vos, C. Proby, P. Agostinis and M. Garmyn, Int. J. Cancer, 2010, 127, 2790–2803 CrossRef CAS PubMed.
- E. R. Plimack, R. L. Dunbrack, T. A. Brennan, M. D. Andrake, Y. Zhou, I. G. Serebriiskii, M. Slifker, K. Alpaugh, E. Dulaimi, N. Palma, J. Hoffman-Censits, M. Bilusic, Y.-N. Wong, A. Kutikov, R. Viterbo, R. E. Greenberg, D. Y. T. Chen, C. D. Lallas, E. J. Trabulsi, R. Yelensky, D. J. McConkey, V. A. Miller, E. A. Golemis and E. A. Ross, Eur. Urol., 2015, 68, 959–967 CrossRef CAS PubMed.
- A. R. Choi, J. H. Kim, Y. H. Woo, H. S. Kim and S. Yoon, Anticancer Res., 2016, 36, 1641–1648 CAS.
- M. Bjorklund, J. Roos, V. Gogvadze and M. Shoshan, Cancer Chemother. Pharmacol., 2011, 68, 1459–1467 CrossRef PubMed.
- J. P. Tsai, C. H. Lee, T. H. Ying, C. L. Lin, C. L. Lin, J. T. Hsueh and Y. H. Hsieh, Oncotarget, 2015, 6, 28851–28866 Search PubMed.
- J. Gao, X. C. Zhang, M. Yu, G. G. Ren and Z. Yang, Toxicology, 2015, 337, 21–29 CrossRef CAS PubMed.
- M.-L. Hartman, J. M. Esposito, B. Y. Yeap and D. J. Sugarbaker, J. Thorac. Cardiovasc. Surg., 2010, 139, 1233–1240 CrossRef CAS PubMed.
- H. Shigematsu, K. Yoshida, Y. Sanada, S. Osada, T. Takahashi, Y. Wada, K. Konishi, M. Okada and M. Fukushima, Int. J. Cancer, 2010, 126, 2716–2725 CAS.
- W. K. Kim, Y. Pyee, H. J. Chung, H. J. Park, J. Y. Hong, K. H. Son and S. K. Lee, J. Nat. Prod., 2016, 79, 1097–1104 CrossRef CAS PubMed.
- M. B. Bolattin, S. T. Nandibewoor and S. A. Chimatadar, J. Mol. Recognit., 2016, 29, 308–317 CrossRef CAS PubMed.
- M. H. Abd-Alla, N. A. Nafady and D. M. Khalaf, Agric., Ecosyst. Environ., 2016, 218, 163–177 CrossRef CAS.
- V. L. Bae-Jump, C. Zhou, J. F. Boggess and P. A. Gehrig, Cancer, 2009, 115, 3887–3896 CrossRef CAS PubMed.
- T. C. Chou, Pharm. Rev., 2007, 59, 124 Search PubMed.
- L. Han, J.-L. Wu and L.-X. Yang, Wspolczesna Onkol., 2012, 16, 512–515 CrossRef CAS PubMed.
- H. Li, X. X. Meng, L. Zhang, B. J. Zhang, X. Y. Liu, W. W. Fu, H. S. Tan, Y. Z. Lao and H. X. Xu, Acta Pharmacol. Sin., 2017, 38, 252–263 CrossRef CAS PubMed.
- A. Pawlik, M. Slominska-Wojewodzka and A. Herman-Antosiewicz, Eur. J. Nutr., 2016, 55, 1165–1180 CrossRef CAS PubMed.
- J. Gu, W. Hu, Z. P. Song, Y. G. Chen, D. D. Zhang and C. Q. Wang, Int. Immunopharmacol., 2016, 32, 1–7 CrossRef CAS PubMed.
- S. S. Zhang, S. P. Ding, J. Yu, X. R. Chen, Q. F. Lei and W. J. Fang, Langmuir, 2015, 31, 12161–12169 CrossRef CAS PubMed.
- Y. Q. Guo, C. X. Huang, G. W. Li, T. Chen, J. X. Li and Z. W. Huang, Mol. Med. Rep., 2015, 12, 3681–3687 CAS.
- A. Zajkowicz, A. Gdowicz-Klosok, M. Krzesniak, D. Scieglinska and M. Rusin, Cell. Signalling, 2015, 27, 1677–1687 CrossRef CAS PubMed.
- P. Obakan, S. Yildirim, M. B. Ozturk, O. Berrak, A. C. Gurkan, E. D. Arisan and Z. N. Unsal, Turk. J. Biol., 2015, 39, 712–721 CrossRef CAS.
- J. D. Ly, D. R. Grubb and A. Lawen, Apoptosis, 2003, 8, 115–128 CrossRef CAS PubMed.
- M. P. Liu, M. Liao, C. Dai, J. F. Chen, C. J. Yang, M. Liu, Z. G. Chen and M. C. Yao, Sci. Rep., 2016, 6, 34245 CrossRef CAS PubMed.
- S. Zhao, C. M. Mai, C. X. Liu, W. Wei, Y. Sun, H. Yan and Y. L. Wu, Int. J. Mol. Med., 2012, 30, 939–944 CAS.
- R. J. Zhang, R. J. Wang, Q. X. Chen and H. Chang, Mol. Med. Rep., 2015, 12, 1727–1732 CAS.
- S. M. Shi, P. Tan, B. D. Yan, R. Gao, J. J. Zhao, J. Wang, J. Guo, N. Li and Z. S. Ma, Oncol. Rep., 2016, 35, 2606–2614 CAS.
- J. H. Kim, A. R. Choi, Y. K. Kim and S. Yoon, Biochem. Biophys. Res. Commun., 2013, 441, 655–660 CrossRef CAS PubMed.
- W. G. Wang, J. N. Gallant, S. I. Katz, N. G. Dolloff, C. D. Smith, J. Abdulghani, J. E. Allen, D. T. Dicker, B. Hong, A. Navaraj and W. S. El-Deiry, Cancer Biol. Ther., 2011, 12, 229–238 CrossRef CAS PubMed.
- S. W. Ha, M. N. Weitzmann and G. R. Beck, ACS Nano, 2014, 8, 5898–5910 CrossRef CAS PubMed.
- M. Barraud, J. Garnier, C. Loncle, O. Gayet, C. Lequeue, S. Vasseur, B. Bian, P. Duconseil, M. Gilabert, M. Bigonnet, A. Maignan, V. Moutardier, S. Garcia, O. Turrini, J. R. Delpero, M. Giovannini, P. Grandval, M. Gasmi, M. Ouaissi, V. Secq, F. Poizat, N. Guibert, J. Iovanna and N. Dusetti, Oncotarget, 2016, 7, 53783–53796 Search PubMed.
- Y. Li, L. Zhang, K. Li, J. Li, R. Xiang, J. Zhang, H. Li, Y. Xu, Y. Wei, J. Gao, P. Lin and Y. Wei, Sci. Rep., 2015, 5, 9288 CrossRef CAS PubMed.
- I. Manov, Y. Pollak, R. Broneshter and T. C. Iancu, FEBS J., 2011, 278, 3494–3507 CrossRef CAS PubMed.
- M. Z. Kabir, A. K. Mukarram, S. B. Mohamad, Z. Alias and S. Tayyab, J. Photochem. Photobiol., B, 2016, 160, 229–239 CrossRef CAS PubMed.
- S. S. Zhang, X. R. Chen, S. P. Ding, Q. F. Lei and W. J. Fang, Colloids Surf., A, 2016, 495, 30–38 CrossRef CAS.
- S. Oshiro and S. Honda, ACS Chem. Biol., 2014, 9, 1052–1060 CrossRef CAS PubMed.
- L. J. Kong, J. X. Hu, D. Qin and P. Yan, J. Pharm. Sci. Innovation, 2015, 10, 13–20 CrossRef.
- Z. C. Zhang, Z. W. Shao, L. M. Xiong and S. H. Yang, Oncol. Lett., 2015, 10, 2941–2946 Search PubMed.
Footnote |
| † Electronic supplementary information (ESI) available: The structure of RAPA, 3-MA and cisplatin (Fig. S1); cell viability of cells exposed to drugs with different concentrations for 24 h or 48 h (Fig. S2 and S3); the fluorescence lights of green and red on HeLa cells treated with RAPA, 3-MA and cisplatin combination drugs (Fig. S4–S7); autophagic vesicles in HeLa cells exposed to RAPA from MDC staining assay observed under confocal microscopy (Fig. S8–S10); Stern–Volmer curves of the binding of cisplatin combination drugs to HSA (Fig. S11); CI values for HeLa cell lines treated with cisplatin combination drugs (Table S1); Stern–Volmer quenching constants of cisplatin combination drugs binding to HSA and the free-energy change (ΔGo), enthalpy change (ΔHo), and entropy change (ΔSo) (Table S2); α-helical content of HSA determined from CD at 298 K in the presence of cisplatin (2 μg mL−1) combination drugs (Table S3); and a table of literature about combination drugs (Table S4). See DOI: 10.1039/c7ra00056a |
| This journal is © The Royal Society of Chemistry 2017 |

