 Open Access Article
Preparation of a polyphenylene sulfide membrane from a ternary polymer/solvent/non-solvent system by thermally induced phase separation
Xiaotian Wang,
Zhenhuan Li *,
Maliang Zhang,
Tingting Fan and
Bowen Cheng
 *
*
State Key Laboratory of Separation Membranes and Membrane Processes, School of Materials Science and Engineering, Tianjin Polytechnic University, 300387, Tianjin, China. E-mail: zhenhuanli1975@aliyun.com; lizhenhuan@tjpu.edu.cn; bowen15@tjpu.edu.cn
First published on 7th February 2017
Abstract
Polyphenylene sulfide (PPS) membranes were prepared via a thermally induced phase separation (TIPS) method. Diphenyl ketone (DPK) was selected as a diluent and dibutyl sebacate (DBS) was used as an auxiliary diluent. As the weight ratio of DBS to DPK increased from 10/66 to 17/59, the cloud point temperature of PPS/DBS/DPK increased from 250 to 263.5 °C, crystallization temperature decreased from 225.4 to 219.2 °C and the interaction parameter between PPS and diluents changed from 1.57 to 1.91, which provided more opportunity for the casting solution to form the desired PPS membrane structure. When DBS concentration reached 16 wt%, an interesting sandwich-like PPS membrane structure with branch-like, bi-continuous, cellular structure was obtained, and the resulting membranes possessed the highest porosity, supreme water permeation and best mechanical properties. As DBS content increased, tensile strength improved from 0.55 to 4.22 MPa, and breaking elongation increased from 3.69 to 9.67%, but the mechanical properties of membranes with bi-continuous and cellular structure were much better than those of membranes with a spherical particle structure. Bovine serum albumin (BSA) was used as model foulant to investigate dynamic anti-fouling properties of membranes, and the effects of PPS concentration, cooling rate and coagulation bath styles on membrane structure were investigated. In addition, the PPS membrane had better performance against strong acid, strong alkaline and organic solvents than any other common membranes, and it showed extraordinary thermal stability.
1. Introduction
Nowadays, membrane separation technology has been widely used in almost every industrial sector including environmental, energy, electronic, chemical and biotechnologies areas,1–3 and much effort is being devoted to improve the performance of the existing membranes in terms of anti-fouling properties, high mechanical strength and good chemical resistance.4,5 PPS is a semicrystalline thermoplastic with high melting temperature (285 to 296 °C).6,7 Most importantly, PPS has excellent solvent resistance, and nearly no solvent can dissolve it below 200 °C.8,9 Therefore, PPS is expected to be a promising membrane separation material in the future.10 However, the preparation of PPS membranes is not feasible via a solution phase inversion method because it is difficult to find suitable diluents to dissolve PPS at low temperature without destroying its excellent performance.Currently, the TIPS method has become a primary technique to prepare polymer membranes which do not have an appropriate solvent at room temperature,11,12 and this method has been applied to a wide range of polymers, such as PVDF,13,14 PAN,15,16 PP17–19 and poly(ethylene-co-vinyl alcohol) (EVOH).20,21 During the process of TIPS, homogeneous solution is obtained by dissolving polymer in high-boiling point solvent at an elevated temperature, and then the solution is cooled at controlled rate to induce phase separation and polymer solidification. Subsequently, the diluent is removed by suitable extractant to form microporous membrane.22 Importantly, when thermal energy is removed from the solution, TIPS occurs in the form of S–L (solid–liquid) or L–L (liquid–liquid) phase separation or both take place in polymer/diluent systems, which depends on the interaction of polymer–diluent, the composition of casting solution and thermal diving force.23 Bi-continuous or cellular structure can be obtained via L–L phase separation, in which homogeneous solution separates into polymer-rich continuous phase and polymer-lean droplet phase. The formation of spherulite-like structure or leafy structure is attributed to the polymer or diluent crystallizes prior to L–L phase separation.24 Therefore, the structure of microporous membrane can be adjusted by changing the thermodynamic or kinetic factors in TIPS process.
In previous studies, PPS membrane was prepared mainly by single diluent system. For example, Zheng et al.10 used six types of solvents to prepare PPS membrane by PPS–single diluent systems, and the formation of various PPS membrane structures were attributed to the different S–L or L–L phase separation mechanism. Ding et al.25 prepared the porous PPS membrane using the diluent of diphenyl ketone (DPK) or diphenyl sulfone (DPS). On the one hand, branch-like structure could be obtained due to spinodal decomposition. On the other hand, open or semi-open cellulous pore structure appeared because of nucleation and growth mechanism. In addition, the pore structure and pore size could be controlled by altering cooling rate during the phase separation and adjusting polymer concentration to change the casting solution positions in the phase diagram.26 However, only monotonous morphology and inferior performance of PPS membrane would be obtained from single diluent system, and the prepared PPS membrane had poor mechanical property and could not meet the requirements of industrial applications.
Generally, the region of L–L phase separation can be enlarged by adding the third comment (nonsolvent) to original polymer–diluent systems,27 implying the diluent system might modulate the structure and improve the PPS membrane performance. In fact, the mixed diluents had attracted much more attentions to prepare polymer membrane via TIPS method. For example, Roh et al.19 employed polytetramethylene glycol (PTMG) and paraffin as diluents to prepare polyethylene (PE) membrane via TIPS, and the microporous membranes with required porosity and pore size could be achieved by adjusting the mole ratio of PTMG to paraffin. As di-(2-ethylhexyl) phthalate (DEHP) content increase in the tributyl citrate (TBC)/DEHP diluent mixture, Liu et al.28 discovered the structural change of PVDF membrane cross-sections from spherulitic structure to bi-continuous morphology. Furthermore, the phase diagrams of PP/myristic acid/diphenyl carbonate ternary mixtures were used to regulate the structure and interpret membrane morphology.29 It was found that the membrane structure changed from spherulitic to bi-continuous with the weight ratio increase of diphenyl carbonate to myristic acid, which could be explained by phase separation change from S–L to L–L. Moreover, the structure and performance of polymer membrane could be controlled by different diluent mixture, such as glyceryl triacetate (GTA) and dibutyl sebacate (DBS),30 water and 1,4-dioxane,31 γ-butyrolactone (γ-BL) and dioctyl phthalate (DOP),32 dibutyl phthalate (DBP) and di(2-ethylhexyl) phthalate (DEHP)33 etc.
As far as we know, few studies have been reported on the relationship between structure and performance of PPS membranes which prepared from combined diluents by TIPS method, and the extraordinary chemical resistance and thermal stability of PPS membrane has never been investigated comprehensively. In this work, PPS membranes with fuzzy porous spherulitic, bi-continuous, and cellular-like structure were prepared via TIPS process using DPK and DBS as diluent mixture. The main aim of this work was to interpret the forming mechanism of membrane structure by varying diluent composition. Furthermore, the effects of polymer concentration, cooling rate and coagulation bath composition on the structure and membrane performance were also investigated.
2. Experimental
2.1 Materials
PPS resin was supplied by Ticona (Fortron 0320) and it was dried at 120 °C for 12 h before use. DPK (99%, Mw = 182.22, ρ = 1.11 g cm−3) was purchased from Aladdin. DBS (98%, Mw = 314.46, ρ = 0.94 g cm−3) was provided by Tianjin Guangfu Fine Chemical Institute (Tianjin China). The solubility parameter (MPa1/2) of DBS, DPK and PPS is 18.8,34 22.1 (ref. 35) and 25.6,36 respectively. BSA (Mw = 68![[thin space (1/6-em)]](https://www.rsc.org/images/entities/char_2009.gif) 000 g mol−1) obtained from Beijing Solarbio Science & Technology Co. Ltd. (China). Regenerated cellulose (RC) membranes (diameter of 47 mm and average pore diameter of 0.45 μm) were purchased from Sartorius StedimBiotech (Germany). Polyamide (PA) composite membranes were obtained from Vontron membrane technology CO., Ltd. Polyacrylonitrile (PAN) came from industrial production. Polysulfone (PSF) was purchased from Dalian polysulfone Plastic Co. Ltd., polyvinylidene fluoride (PVDF) powder (Mw = 3.52 × 10⁵ g mol−1, Mw/Mn = 2.3, Solef 1010) was got from Solvay in Belgium. Dimethyl formamide (DMF, provided by Tianjin Kemiou Chemical Reagent Co., Ltd), N-methy-2-pyrrolidone (NMP, provided by DLG battery Co. Ltd., P. R. China), dimethyl sulfoxide (DMSO, provided by Tianjin Kemiou Chemical Reagent Co., Ltd) were used as solvent. Sodium hydroxide (NaOH) was purchased from Tianjin Fengchuan Chemical Reagent Co., Ltd. Hydrochloric acid was obtained from Shijiazhuang Xinlongwei chemical industry Co., Ltd. All the chemicals were used without further purification.
000 g mol−1) obtained from Beijing Solarbio Science & Technology Co. Ltd. (China). Regenerated cellulose (RC) membranes (diameter of 47 mm and average pore diameter of 0.45 μm) were purchased from Sartorius StedimBiotech (Germany). Polyamide (PA) composite membranes were obtained from Vontron membrane technology CO., Ltd. Polyacrylonitrile (PAN) came from industrial production. Polysulfone (PSF) was purchased from Dalian polysulfone Plastic Co. Ltd., polyvinylidene fluoride (PVDF) powder (Mw = 3.52 × 10⁵ g mol−1, Mw/Mn = 2.3, Solef 1010) was got from Solvay in Belgium. Dimethyl formamide (DMF, provided by Tianjin Kemiou Chemical Reagent Co., Ltd), N-methy-2-pyrrolidone (NMP, provided by DLG battery Co. Ltd., P. R. China), dimethyl sulfoxide (DMSO, provided by Tianjin Kemiou Chemical Reagent Co., Ltd) were used as solvent. Sodium hydroxide (NaOH) was purchased from Tianjin Fengchuan Chemical Reagent Co., Ltd. Hydrochloric acid was obtained from Shijiazhuang Xinlongwei chemical industry Co., Ltd. All the chemicals were used without further purification.
2.2 Phase diagrams
The phase diagram of PPS/DBS/DPK systems was determined by measuring cloud point temperature and crystallization temperature. The constituents of PPS/binary diluent systems were donated as aP(bBcD), where P, B and D represented PPS, DBS and DPK, respectively, and a, b and c represented the constituent content. For instance, 24P(16B60D) signified PPS concentration was 24 wt%, DBS content was 16 wt% and DPK content was 60 wt%. PPS and diluents were heated to elevated temperature (265 °C) for 12 min in a glass vessel with a stirrer to form homogeneous solution. After that the solution was quenched into liquid nitrogen to solidify the sample. The sample was sandwiched between a pair of cover slips which were sealed with a Teflon film with a circle opening in the center to prevent the loss of diluents. Whereafter, the sample was heated on a hot stage (Linkam THMS600) to 300 °C at 10 °C min−1 and held for 2 min, and then cooled to 100 °C at a rate of 5 °C min−1. Cloud point temperature was visually determined by noting the appearance of turbidity under the optical microscopy (Olympus BX51). The crystallization temperature was determined by differential scanning calorimetry (DSC 200 F3, Netzsch, Germany). The mixture of PPS/DBS/DPK systems was melted at 300 °C for 2 min and then cooled to 30 °C at the rate of 10 °C min−1 during the cooling process, the temperature of the exothermic peak was regarded as crystallization temperature.2.3 Preparation of PPS membranes
PPS and diluents were mixed together in a three-neck flask equipped with a mechanical stirrer. Flask was sealed under nitrogen atmosphere to avoid oxidation of PPS at high temperature. Then, the mixtures of PPS and diluents were heated to 265 °C (for 12 min) to gain homogeneous solution. After degassing the air bubbles, the casting solution was quickly poured onto the surface of stainless steel plate which was preheated to 285 °C on top of heating plate (Shanghai Bangxi Instruments Technology Co., China), and it was spread by a casting bar (500 μm) into a thin membrane. And then the formed membrane was cooled naturally in air or immersed into coagulation bath (water, alcohol or mixtures of water and alcohol) immediately. After solidification, PPS membranes were immersed in ethanol for 48 h to remove the diluents, and then they were put in pure water for 24 h. The obtained membranes were saved in pure water or freeze-dried using a freeze dryer (FD-1D-80, Shanghai Hanuo Instruments Co., China). Composition and preparation conditions of each membrane were listed in Table 1.| Sample | DBS content (wt%) | PPS concentration (wt%) | Cooling bath (°C) | Thickness of membrane (μm) |
|---|---|---|---|---|
| a Cooling bath: water.b Cooling bath: air.c Cooling bath: mixtures of water and alcohol. | ||||
| 24P(10B66D) | 10 | 24 | 25a | 191.2 |
| 24P(12B64D) | 12 | 24 | 25a | 197.6 |
| 24P(14B62D) | 14 | 24 | 25a | 191.8 |
| 24P(15B61D) | 15 | 24 | 25a | 190.8 |
| 24P(16B60D) | 16 | 24 | 25a | 171.4 |
| 24P(17B59D) | 17 | 24 | 25a | 171.7 |
| 18P(16B66D) | 16 | 18 | 25a | 182.8 |
| 20P(16B64D) | 16 | 20 | 25a | 183.2 |
| 22P(16B62D) | 16 | 22 | 25a | 191.4 |
| 26P(16B58D) | 16 | 26 | 25a | 192.2 |
| 28P(16B56D) | 16 | 28 | 25a | 189.0 |
| 24P(16B60D) | 16 | 24 | 25b | 166.4 |
| 24P(16B60D) | 16 | 24 | 3a | 191.8 |
| 24P(16B60D) | 16 | 24 | 50a | 197.2 |
| 24P(16B60D) | 16 | 24 | 25c | 193.2 |
| 24P(16B60D) | 16 | 24 | 25c | 209.2 |
| 24P(16B60D) | 16 | 24 | 25c | 208.4 |
2.4 Characterization of membranes
The cross-sections and surfaces of membranes were characterized by field-emission scanning electron microscopy (FESEM, Hitachi S-4800, Hitachi, Japan) at an acceleration voltage of 10.0 kV. The membranes were frozen and fractured by liquid nitrogen, and then they were sputter-coated with gold. The porosity was calculated in according to a dry–wet weight method. Membranes were placed in electric blast drying oven at 80 °C for 24 h to remove water from pores and weighed in dry state. Then the membranes were immersed in n-butanol for 24 h and weighed immediately after mopping superficial n-butanol with filter paper. Porosity of membrane was calculated by eqn (1).37
 | (1) |
The tensile strength and breaking elongation of PPS membranes were measured by a universal testing machine (CMT4503, Meitesi Industry Co., China). The membranes were cut into 5 mm (width) × 30 mm (length) test strips and the tensile rate was 10 mm min−1. The thickness of membranes was exactly measured by a thickness gauge. Each value was the average of at least five parallel experiments.
Pure water flux was determined by a self-made cross-flow filtration experimental device with effective membrane area of 2.54 cm2. The membrane was pre-pressurized with distilled water at 0.2 MPa for 30 min and then the pressure was adjusted to operation pressure of 0.1 MPa. The date of each membrane was recorded at least five times after steady water flux was obtained. Water flux was calculated by following eqn (2).
 | (2) |
Afterwards, the distilled water was changed to 1 g L−1 BSA solution (pH = 7.0) which was prepared by dissolving BSA into phosphate buffered solution in order to test the solute rejection. The membrane was pressurized for 30 min and then measurement was carried out under the operation pressure of 0.1 MPa. The concentration of protein in the feed solution and permeation solution was measured by UV-spectrophotometer (TU-1810) at wavelength of 280 nm. Membrane solute rejection was calculated by eqn (3).38
 | (3) |
After solute rejection tests, the fouling experiments of PPS membranes were performed.
The BSA solution was changed to phosphate buffered solution and membranes were cleaned for 1 h at 0.1 MPa. Subsequently, the phosphate buffered solution was switched to distilled water and water flux (Jw2) was re-measured again at 0.1 MPa. The above operation was repeated for three cycles. The flux recovery ratio (FRR) was calculated using the following expression:39
 | (4) |
To analyze fouling process of PPS membrane, the ratios of total fouling, reversible and irreversible fouling were also described.
 | (5) |
 | (6) |
 | (7) |
In order to compare the performance of PPS membrane and other common membranes, PSF and PVDF membranes were prepared by NIPS method and PAN membrane was fabricated by TIPS method. RC membrane and PA composite membrane were purchased from companies. The acid, alkali and solvent resistance were evaluated from the change in water flux which was measured before and after immersing membranes in acid, alkali or solvent solutions at 90 °C for 12 h. The thermal stability was determined by placing membranes under the high temperature environment of 200 °C for 12 h.
3. Results and discussion
3.1 Determination of phase diagram
The phase diagram for PPS–binary diluent systems is shown in Fig. 1, in which PPS concentration is 24 wt% and DBS concentration changes from 10 wt% to 17 wt%. Generally, the single diluent is not conducive to PPS membrane structure regulation in the process of TIPS. In order to gain a better performance of PPS membranes, a small amount of auxiliary diluent needs to be loaded into the casting solution to decrease the compatibility between polymer and mixed diluents.40 In this work, DPK was selected as primary diluent because of its low interaction parameter with PPS, and DBS was selected as auxiliary diluent which had poor compatibility with PPS. As can be seen in Fig. 1, the cloud point temperature increased from 250 to 263.5 °C and crystallization temperature decreased from 225.4 to 219.2 °C with the increase of DBS concentration. The introduction of auxiliary diluent resulted in L–L phase separation at high temperature, implying the interaction between PPS and diluents became weak. Generally speaking, the adding of non-solvent DBS increased the viscosity of PPS solution because PPS molecules formed network, which prevented polymer chains from moving. Thus, the system needed deeper supercooling degree to form the crystal nuclei of PPS, which leaded the decline of crystallization temperature.33,41 As the enlargement of L–L phase separation region between crystallization curve and binodal curve, the time interval from the onset of phase separation to polymer crystallization increased, which provided more opportunity for casting solution to form the desired PPS membrane structure.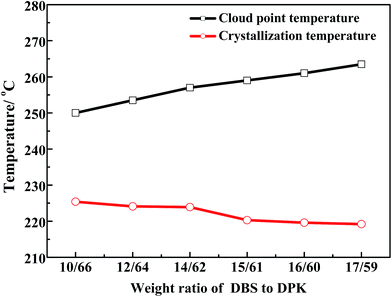 | ||
| Fig. 1 Phase diagram of PPS/DBS/DPK ternary systems with various weight ratios of DBS to DPK at the PPS concentration of 24 wt%. | ||
The Flory–Huggins interaction parameters can be used to analyze the overall feature in Fig. 1 and interpret the interaction between PPS polymer and the binary diluent. Herein, the interaction parameters were calculated from the differences of the solubility parameter between PPS and diluents, and results were listed in Table 2. As the continuous increase of the weight ratio of DBS to DPK from 10/66 to 17/59, the interaction parameter changed from 1.57 to 1.91, which suggested that the compatibility between PPS polymer and diluent decreased with the weight ratio of DBS to DPK increase. Therefore, the growth period of polymer-lean droplets would be prolonged, which resulted in the formation of larger PPS membrane pore size. However, if DBS concentration reached 17 wt%, the homogeneous solution could not be gained at higher temperature because of the poorer compatibility of PPS–binary diluent systems.
| Weight ratio of DBS/DPK | Vi | δi | χ |
|---|---|---|---|
a Notes: V, molar volume; ϕ, volume fraction; δ, solubility parameter of diluent; χ, Flory–Huggins interaction parameter between PPS and diluent at 298.15 K. χ can be related to δ:  where i and j denotes diluent and polymer, respectively. where i and j denotes diluent and polymer, respectively. |
|||
| 10/66 | 190.02 | 21.60 | 1.57 |
| 12/64 | 195.05 | 21.50 | 1.66 |
| 14/62 | 200.03 | 21.41 | 1.76 |
| 15/61 | 202.50 | 21.36 | 1.81 |
| 16/60 | 204.96 | 21.31 | 1.86 |
| 17/59 | 207.41 | 21.26 | 1.91 |
3.2 Effects of diluent composition on membrane structure
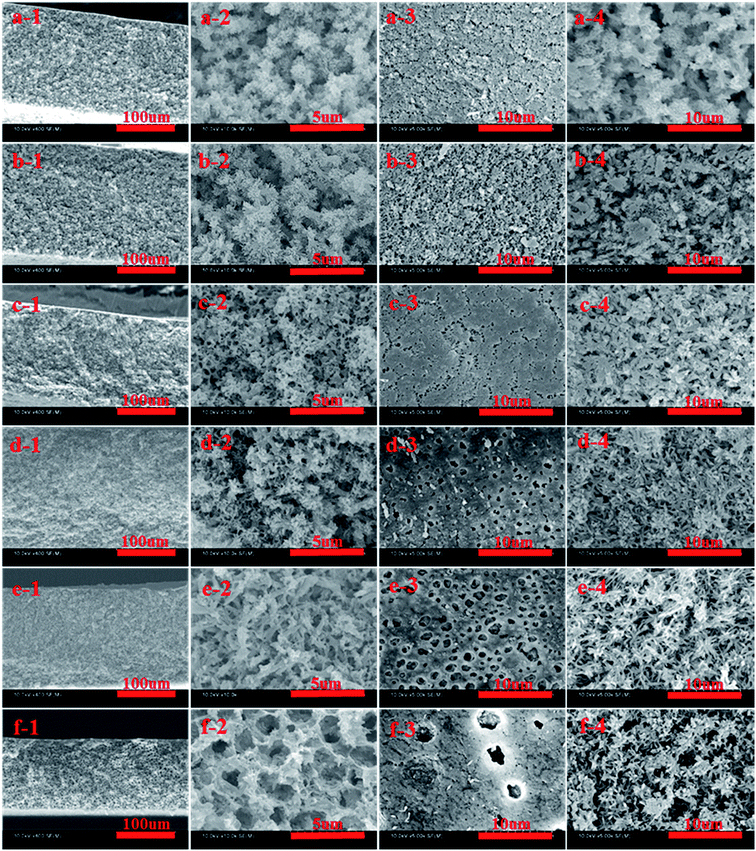
The SEM images of cross-section and surface morphologies of PPS membrane are shown in Fig. 2. When DBS concentration reached 10 wt% and 12 wt%, the ambiguous spherulitic structure (Fig. 2(a-2 and b-2)) appeared in membranes because of the strong interaction between PPS and diluent mixtures. Although L–L phase separation was prominent in PPS membrane formation from casting solution of 24P(10B/66D) and 24P(12B/64D), the structure of formed membranes was also influenced by S–L phase separation process. It meant that there is not enough time to finish L–L phase separation before PPS crystallization appeared. When DBS concentration reached 14 wt%, both spherulitic structure and bi-continuous structure could be observed, due to the competition of PPS polymer crystallization and L–L phase separation. When the weight ratio of DBS to DPK reached 15/61 and 16/60, PPS membranes presented bi-continuous structure (Fig. 2(d-2 and e-2)) due to poorer compatibility between PPS and binary diluent (see Table 1). In above process, the casting solution passed through metastable region quickly, and spinodal decomposition had enough opportunity to take place under a given cooling condition. Nevertheless, when the weight ratio of DBS to DPK reached 17/59, bi-continuous structure disappeared, and the cellular morphology developed into the main structure, due to the temperature gap between crystallization temperature and the cloud point temperature became larger with DBS concentration increased. Thus, diluent-rich droplets had much more time in the process of coarsening and growth, leading the formation of cellular pore structure.As shown in Fig. 2(a-3 and b-3), the tiny spherulitic structure was presented on the membrane top surface (air side) which formed from the L–L phase separation and PPS crystallization. When the weight ratio of DBS to DPK changed from 14![[thin space (1/6-em)]](https://www.rsc.org/images/entities/char_2009.gif) :
:![[thin space (1/6-em)]](https://www.rsc.org/images/entities/char_2009.gif) 62 to 17
62 to 17![[thin space (1/6-em)]](https://www.rsc.org/images/entities/char_2009.gif) :
:![[thin space (1/6-em)]](https://www.rsc.org/images/entities/char_2009.gif) 59, the irregular pores appeared due to L–L phase separation. At the same time, the pore diameter increased, but the number of pore decreased with the increase of DBS concentration. The reason for that is the higher concentration of non benign solvent of DBS, the larger the time gap from the beginning of phase separation to polymer crystallization. The greater driving forces of L–L phase separation exists, and the more time for coarsening process of PPS–binary diluent systems. Compared with the bottom surface of PPS membrane (the hot stainless steel plate side), the top surface of membrane had more compact structure. These two different surface morphology come from the different cooling rate. The phase separation of PPS–binary diluent systems and PPS crystallization on top surface undergo rapidly because of the direct contact of hot membrane with cold quench bath. However, the cooling rate of PPS membrane bottom surface is much lower because of the contact of membrane bottom surface with hot stainless steel plate.42 Most importantly, the evaporation of mixed diluents on surface of membrane also results membrane top surface densification. However, tiny spherulitic structure was not detected in membrane bottom surface, and the membrane bottom surface presented distinct bi-continuous structure, which may be due to the slower PPS crystallization, no solvent evaporation and L–L phase separation (Fig. 2(a-4 and b-4)).43 Thus it can be seen that the evolving of membrane structure can be ascribed to the thermodynamic and kinetic factors which determined the phase separation mechanism and phase separation process.
59, the irregular pores appeared due to L–L phase separation. At the same time, the pore diameter increased, but the number of pore decreased with the increase of DBS concentration. The reason for that is the higher concentration of non benign solvent of DBS, the larger the time gap from the beginning of phase separation to polymer crystallization. The greater driving forces of L–L phase separation exists, and the more time for coarsening process of PPS–binary diluent systems. Compared with the bottom surface of PPS membrane (the hot stainless steel plate side), the top surface of membrane had more compact structure. These two different surface morphology come from the different cooling rate. The phase separation of PPS–binary diluent systems and PPS crystallization on top surface undergo rapidly because of the direct contact of hot membrane with cold quench bath. However, the cooling rate of PPS membrane bottom surface is much lower because of the contact of membrane bottom surface with hot stainless steel plate.42 Most importantly, the evaporation of mixed diluents on surface of membrane also results membrane top surface densification. However, tiny spherulitic structure was not detected in membrane bottom surface, and the membrane bottom surface presented distinct bi-continuous structure, which may be due to the slower PPS crystallization, no solvent evaporation and L–L phase separation (Fig. 2(a-4 and b-4)).43 Thus it can be seen that the evolving of membrane structure can be ascribed to the thermodynamic and kinetic factors which determined the phase separation mechanism and phase separation process.
3.3 Effects of polymer concentration on membrane structure
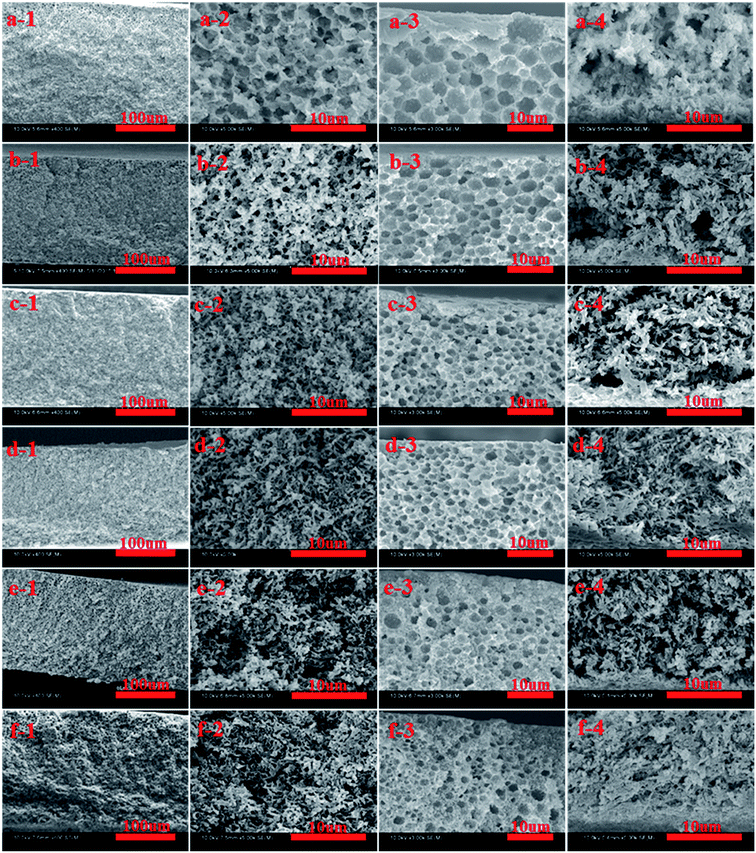
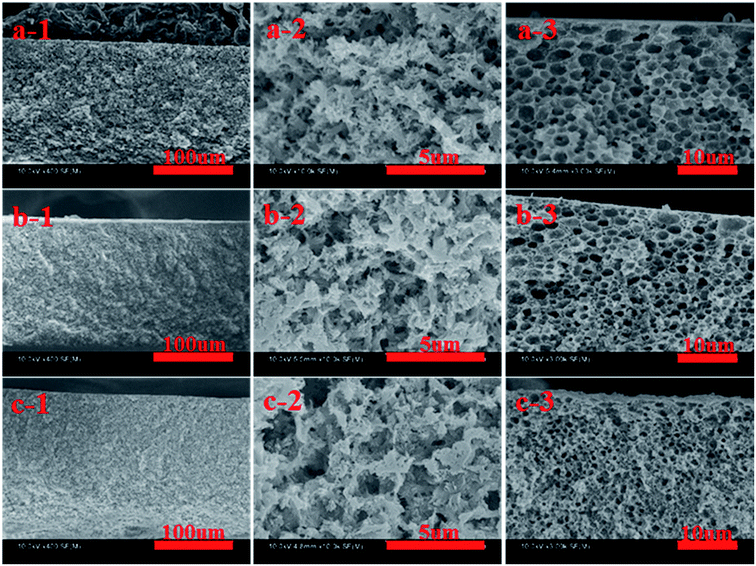
The effects of PPS concentration on membrane structure are shown in Fig. 3, in which DBS concentration is fixed at 16 wt% and PPS concentration changes from 18 to 28 wt%. Bi-continuous structure, constituted a major part of membrane, could be obtained in all range of PPS concentration at fixed binary diluent composition. However, as PPS concentration increased, bi-continuous structure became denser, and the number of channels significantly decreased because the increased viscosity of PPS/DBS/DPK systems reduced the phase separation degree, restrained the growth rate of solvent-rich phase and influenced the interconnectivity of membrane pores. As shown in Fig. 3(3), the pore sizes declined and the interconnectivity of cellular structure reduced with PPS concentration increase. The increased viscosity and the shorter time interval for coarsening process limited the growth of diluent-rich droplets which generated by phase separation process.44 When PPS concentration reached 26 wt% or 28 wt%, the number of polymer rich droplets increased, and the possibility for coalescence opportunity of polymer poor droplets decreased. Consequently, polymer poor droplets were isolated and they would be trapped in the region of polymer rich phase, which resulted in membrane pores becoming closed.32 Based on the same principle, the pore of cross-sections at bottom surface had branch-like structure, and the number of pores or channels decreased with the increase of PPS concentration. Therefore, polymer concentration is a key factor that determines the initial composition of phase separation process as well as the structure of membrane.3.4 Effects of cooling conditions on membrane structure
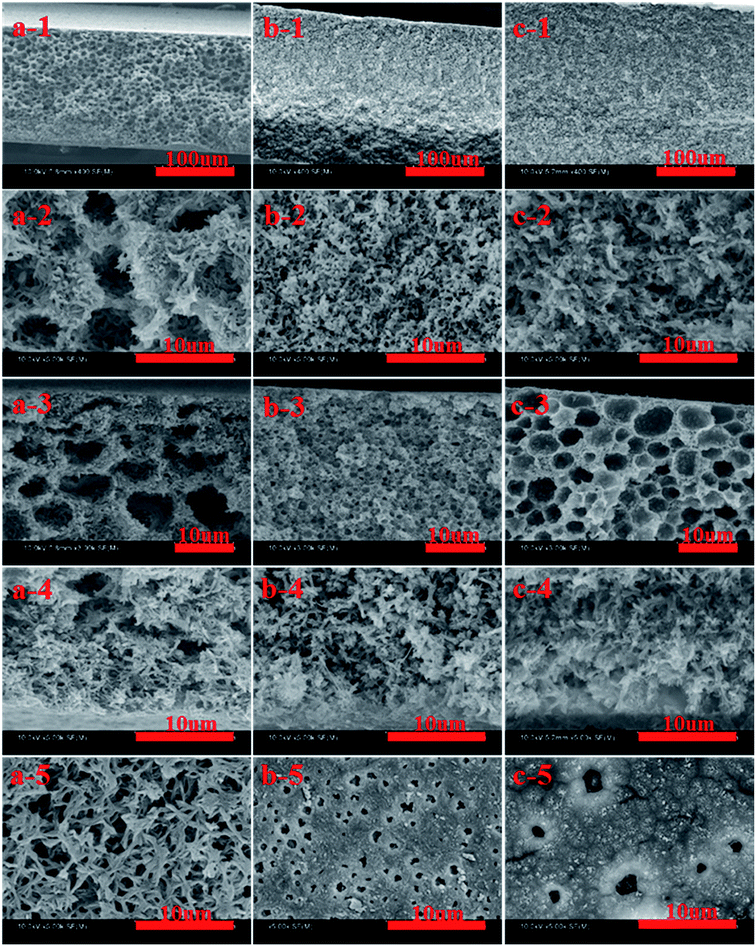
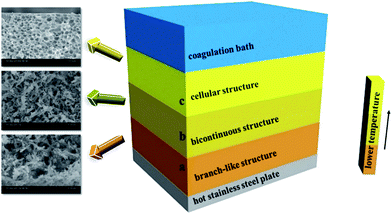
The effects of cooling conditions on cross-section and surface structure of membranes at PPS concentration of 24 wt% are shown in Fig. 4. When PPS membranes were quenched in air bath, they presented interconnected cellular structure, which resulted from L–L phase separation. In this case, casting solution had a lower cooling rate, which made the diameter of the channel increase significantly. Under the cooling condition of water bath, all membranes presented the asymmetric structure consisting of cellular pores beneath the top surface, including well-connected bi-continuous structure in middle part of membrane section and branch-like structure in the cross section in the bottom surface, but bi-continuous structure was regarded as the main pore structure of membrane.This interesting sandwich-like or layered structure of PPS membrane is attributed to the specific temperature gradient effect during the process of membrane cooling in a coagulation bath (Fig. 5). The quenching temperature is far below the crystallization temperature in our experiment, therefore the cooling rate of casting solution is faster, and the primary phase separation mechanism belongs to the spinodal decomposition which determines the morphology of membrane. It can be seen from Fig. 5, the part (a) and part (b) are closed to the hot stainless steel plate, thus the cooling rates of them are lower than part (c), and the period of the primary stage of spinodal decomposition is much longer.45 Consequently, the structure of membrane is determined by the primary stage of spinodal decomposition, leading the formation of well-connected bi-continuous and branch-like structure.46 However, the cooling rate of part (c) is faster than that of part (a) or part (b), therefore the degree of PPS phase separation decreases, but cellular pore structure comes into being, which is typical structure of the latter stage of spinodal decomposition.47 Compared with part (b), the cooling rate of part (a) is much lower. Thus, the part (a) has more opportunity to develop the membrane structure with higher porosity.48 Just as shown in Fig. 4, the pore size of the cross-section prepared in water bath at 50 °C is larger than that prepared in water bath at 3 °C, which suggests the longer growing period of diluent-rich droplets is conducive to the formation of a large pore structure. Those results indicate that the cooling conditions significantly influence the phase separation process, leading the formation of different structures.
3.5 Effects of different coagulating bath on membrane structure
Fig. 6 shows the cross-section of PPS membranes which are prepared at a fixed PPS concentration of 24 wt% with the different coagulation bath (different volume ratio of alcohol to water). DPK and DBS can be dissolved in alcohol, but they cannot be dissolved in water. It is well known that the heat transfer rate (dominant in TIPS) in liquid is about two order faster than mass transfer rate (dominant in NIPS).49,50 Thus, TIPS is considered to be the primary phase separation mechanism in the process of NTIPS. As the volume ratios of alcohol to water increased from 1/2 to 2/1, the membrane pore size of bi-continuous structure increased, but the interconnectivity of membrane pores reduced. Those results are attributed to the diluent outflow, which results in the increase of polymer concentration. Because the thermal transmission rate in water is faster than that in alcohol, the cooling rate of membrane decreases with the increase of alcohol concentration in coagulating bath, and PPS molecular chains have longer time to arrange, which significantly reduces the membrane pore size of cellular structure and leads to higher crystallization degree to make membrane structure dense. Thus, the changes of membrane structure or membrane pore size are derived from the synergistic effects of increasing polymer concentration and declining cooling rate.3.6 Water flux and porosity of porous membrane
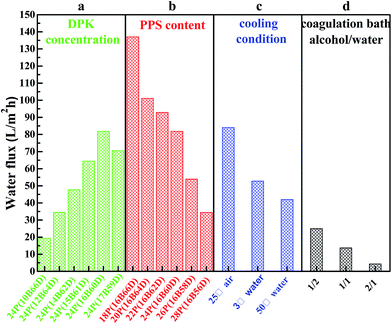
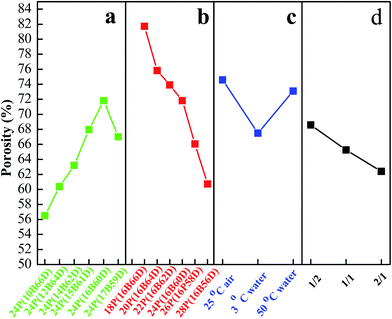
Fig. 7 shows the water flux, and Fig. 8 lists PPS membrane porosity prepared under different conditions. As DBS concentration increased from 10 wt% to 17 wt%, the water flux and membrane porosity increased gradually, and then declined. When DBS concentration reached 16 wt%, the membrane prepared from 24P(16B60D) had the highest water flux (81.84 L m−2 h−1) and the maximum membrane porosity (71.81%), which were shown in Fig. 7(a) and 8(a). The reason for this phenomenon is attributed to the evolution of membrane structure, namely, as DBS concentration increases, the cross section of PPS membrane changes from spherical particle structure to bi-continuous structure which has the highest porosity and the maximum water flux, and then cellular structure appears, which results in interconnectivity reduction. Additionally, when DBS concentration reached 17 wt%, the pore size of surface achieved the largest, but the number of channels or pores reduced significantly, which caused the decline of water flux and membrane porosity, as shown in Fig. 2(f-3).Effects of polymer concentration on water flux and membrane porosity are shown in Fig. 7(b) and 8(b). Membrane prepared from 18P(16B66D) had the highest water flux (137.07 L m−2 h−1) and the maximum membrane porosity (81.7%), while the membrane prepared from 28P(16B56D) had the smallest water flux and the minimum membrane porosity of 34.72 L m−2 h−1 and 60.72%, respectively. As described in Fig. 7(c) and 8(c), when the nascent membrane quenched in air, both the water flux (84.05 L m−2 h−1) and membrane porosity (74.59%) achieved the maximum due to the interconnected cellular structure and highly porous surface. As the water bath temperature increased from 3 to 50 °C, the membrane porosity increased, which was attributed to the longer coarsening time. However, water flux decreased due to the dense surface which resulted from the cooling rate decrease.51 As alcohol volume ratio increased in coagulation bath, both water flux and membrane porosity declined, which resulted from the dense structure of membrane cross section and membrane surface because of diluent outflow.
3.7 Mechanical properties of PPS membrane
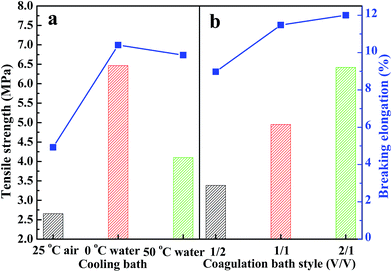
Tensile strength and breaking elongation are important properties that reflect the mechanical properties of PPS flat sheet membrane. The effects of weight ratio of DBS to DPK on membrane performance are shown in Fig. 9(a). As DBS content increased, the tensile strength improved from 0.55 MPa to 4.22 MPa, and breaking elongation increased from 3.69% to 9.67%. Those results are attributed to the transformation of microstructure induced by DBS loading. The mechanical properties of membranes with bi-continuous and cellular structure are much better than those of membranes with spherical particle structure.52 According to the data shown in Fig. 9(b), both tensile strength and breaking elongation significantly improved with PPS concentration increase because of porosity declined.53 As shown in Fig. 10(a), when the nascent membrane was quenched in air, the tensile strength and breaking elongation were weaker than those of membranes quenched in water bath, which was due to enlarged cellular pores and increased porosity. As mentioned previously, the faster the cooling rate, the shorter the time internal for coarsening. When water bath temperature decreased from 50 to 3 °C, both pore size and porosity of membrane reduced, which resulted in the increase of tensile strength and breaking elongation. As can be seen in Fig. 10(b), both tensile strength and breaking elongation improved by increasing the volume ratio of alcohol to water in coagulation bath, due to PPS concentration increased because of diluent outflow.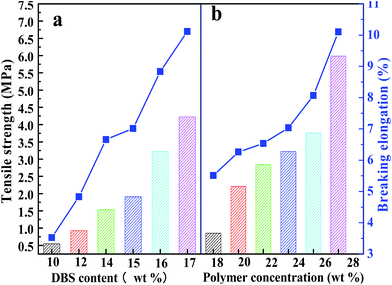 | ||
| Fig. 9 The tensile strength and breaking elongation of PPS membrane varied with (a) DBS content, (b) PPS concentration. The membrane prepared in (a) has the polymer concentration of 24 wt%. | ||
3.8 Rejection and fouling experiment
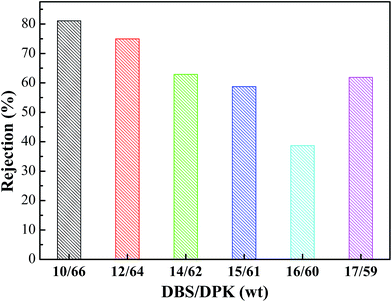
As shown in Fig. 11, BSA is used as the model foulant to analysis the rejection of PPS membrane. As DBS concentration increased, membrane rejection firstly decreased and then increased. When DBS concentration increased from 10 wt% to 16 wt%, PPS membrane rejection decreased from 81.09% to the minimum of 38.68%. In generally, the rejection is connected with pore size and can be explained by the sieving mechanism.54,55 The larger pores and the higher porosity of membrane by TIPS process will allow more BSA molecules to pass through membranes, causing membrane rejection decline. However, when DBS concentration reached 17 wt%, the rejection again raised to 61.89% due to the decrease of membrane pore interconnectivity, which was caused by the change of membrane from bi-continuous to cellular structure. On the other hand, proteins aggregate, deposition and adsorption also play a key role on membrane rejection.56Polymeric membranes are widely used in many fields, however, as a drawbacks of membrane applications, membrane fouling causes various negative effects, such as the decline of membrane permeation and the increase of operation cost.57,58 In this study, BSA is also used as model foulant to investigate dynamic anti-fouling properties of membranes which have three kinds of different morphologies including spherical particle, bi-continuous and cellular structure. The fluxes of membranes are exhibited in Fig. 12. Three circles are performed in order to evaluate the long term performance of membrane. As one circle, pure water flux, BSA solution filtration, and pure water permeation of the cleaned membrane are investigated. In the first circle, the pure water flux decline of all membranes was not obvious because the membranes were compacted at 0.1 MPa for 1 h beforehand.59 After that, the feed liquid was substituted by BSA solution. It could be seen that the fluxes suffered an observable decline and gained stable value after 2 h filtration. This result is due to the protein adsorption, pore blockage and formation of cake filtration during filtration process.54,60 Subsequently, the membranes were washed by phosphate buffered solution, and the pure water fluxes were tested again. Although the pure water flux rebounded in some degree, it could not recover to original value because of the irreversible fouling. Furthermore, the water flux recovery in the successive two cycles was higher than that in the first cycle, which may be due to adsorption and deposition of BSA on membranes that could not be removed by hydraulic cleaning.61
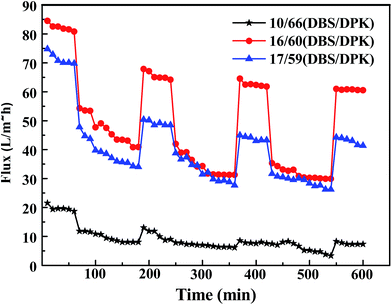 | ||
| Fig. 12 Time-dependent flux of PPS membrane with different weight ratio of DBS to DPK. The concentration of PPS is 24 wt%. | ||
Fig. 13 shows the parameters of flux recovery ratio (FRR), total fouling ratio (Rt), reversible fouling ratio (Rr) and irreversible fouling ratio (Rir) which are calculated to investigate the antifouling abilities of membranes.57 The FRR and Rr of M1 membrane are 43.75% and 0.98%, respectively, which is lower than another two membranes due to the rough surface and smaller pore size. It means that more foulants can aggregate on the surface of membrane and can be trapped in the membrane pores, leading the increase of Rt (57.22%), which is in accordance with the high Rir value (56.25%). Although the Rt (50.1%) value of M2 membrane is similar to the value (50.23%) of M3 membrane, M2 membrane with bi-continuous structure possesses higher Rr (29.2%) and FRR (79.1%) because the interconnectivity of M2 is better than that of M3 membrane with cellular structure. Therefore, the membranes with bi-continuous structure possess remarkable antifouling property in all investigated samples.
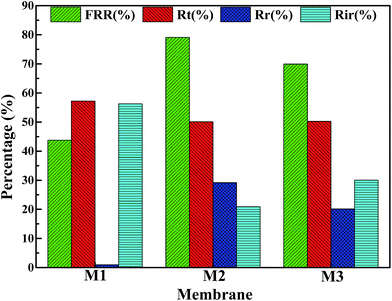 | ||
| Fig. 13 The fouling parameters of PPS membrane. The symbols M1, M2 and M3 represent 24P(10B66D), 24P(16B60D), 24P(17B59D), respectively. | ||
3.9 Chemical resistance and thermal stability of PPS membrane
In order to investigate the chemical resistance of membranes, six kinds of membranes are immersed in acid solution, alkaline solution and mixed solvent at 90 °C for 12 h, respectively. The change in pure water flux of membranes before and after treatment with different solutions are presented in Table 3. In the case of acid solution, RC membrane was significantly hydrolyzed. The flux of other membranes diminished due to be compacted at high pressure or the movement of molecular chain, resulting in the decrease of pore sizes and formation of denser structures.62 The ratios of Jw2/Jw were approximately in the range of 0.72–0.86, which demonstrated that those membranes in acid solution appeared to be stable except RC membrane. The ratio of Jw2/Jw for PPS membrane is the highest, implying the higher stability against acid solution. In the case of alkaline solution, PAN membrane was dissolved and RC membrane was partly hydrolyzed. The separation layer of PA composite membrane was greatly damaged. When PVDF membrane was immersed in alkaline solution, the structure was also destroyed, which leaded to the increase of water flux greatly. Both PSF and PPS membrane could maintain their perfect performance after immersing in strong alkaline solution, but PPS performance maintained better. In the case of mixed organic solvent, all the membranes except PPS and RC membrane were dissolved. The ratio of Jw2/Jw is 1.23, which signified RC membrane was damaged in some extent. However, the ratio of Jw2/Jw for PPS membrane was 0.91, indicating solvent resistance for PPS membrane was better than any other used membranes. Therefore, the above results indicated that PPS membrane had a potential application in water treatment especially containing some strong acid solution, strong alkaline solution or organic solvents.| Membrane | Acid solution (1 mol L−1) | Alkaline solution (1 mol L−1) | Mixed solvent | ||||||
|---|---|---|---|---|---|---|---|---|---|
| Jw | Jw1 | Jw1/Jw | Jw | Jw2 | Jw2/Jw | Jw | Jw3 | Jw3/Jw | |
a Note: mixed solvent (NMP/DMF/DMSO (v/v/v) = 1![[thin space (1/6-em)]](https://www.rsc.org/images/entities/char_2009.gif) : :![[thin space (1/6-em)]](https://www.rsc.org/images/entities/char_2009.gif) 1 1![[thin space (1/6-em)]](https://www.rsc.org/images/entities/char_2009.gif) : :![[thin space (1/6-em)]](https://www.rsc.org/images/entities/char_2009.gif) 1), PPS membrane indicated 24P(16B60D) membrane. Jw: the flux before treatment; Jw1, Jw2, Jw3: the flux after treatment with acid solution, alkaline solution and mixed solvent, respectively. —: membrane dissolved or hydrolyzed. 1), PPS membrane indicated 24P(16B60D) membrane. Jw: the flux before treatment; Jw1, Jw2, Jw3: the flux after treatment with acid solution, alkaline solution and mixed solvent, respectively. —: membrane dissolved or hydrolyzed. |
|||||||||
| PVDF | 12.90 | 10.12 | 0.78 | 13.72 | 298.92 | 21.79 | 12.76 | — | — |
| PSF | 1.99 | 1.65 | 0.83 | 7.61 | 6.03 | 0.79 | 6.50 | — | — |
| PAN | 25.46 | 18.34 | 0.72 | 30.11 | — | — | 36.80 | — | — |
| PA | 22.30 | 16.74 | 0.75 | 23.53 | 116.39 | 4.95 | 23.12 | — | — |
| PPS | 30.87 | 26.60 | 0.86 | 25.53 | 20.87 | 0.82 | 38.77 | 35.13 | 0.91 |
| RC | 60.51 | — | — | 73.73 | 3224.87 | 43.74 | 66.92 | 82.00 | 1.23 |
Fig. 14 shows the thermogravimetric analysis of six kinds of membranes. PPS membrane presents superior thermal stability to other membranes, which is attributed to the inherent property of membrane material. The temperature of 5% weight loss for PPS membrane is up to 498.2 °C, higher than that of PSF membrane (475.8 °C) and PVDF membrane (438.4 °C). This temperature is also higher than other three membranes (PA composite membrane, PAN membrane, RC membrane), whose temperature of 5% weight loss is below 400 °C. In addition, the corresponding heat-resistance index of different membranes is shown in Table 4, which indicates that PPS membrane have better thermal stability than other membranes.
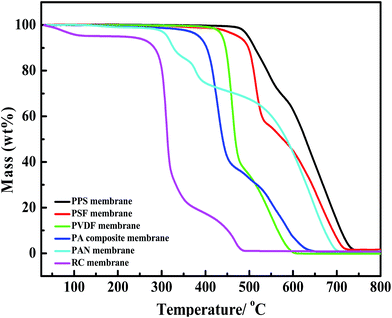 | ||
| Fig. 14 TGA curves of six kinds of membranes under air atmosphere (PPS membrane indicated 24P(16B60D) membrane). | ||
| Membrane | Temperatures for weight loss/°C | Theat-resistance indexa/°C | |
|---|---|---|---|
| 5 wt% | 30 wt% | ||
| a Theat-resistance index = 0.49 × [T5 + 0.6 × (T30 − T5)]63,64 where T5 and T30 is the corresponding decomposition temperature for 5% and 30% weight loss, respectively. PPS membrane indicated 24P(16B60D) membrane. | |||
| PPS | 498.2 | 572.2 | 265.9 |
| PSF | 475.8 | 517.4 | 245.4 |
| PVDF | 438.4 | 469.0 | 223.8 |
| PA | 384.8 | 458.5 | 210.2 |
| PAN | 313.2 | 422.7 | 185.7 |
| RC | 115.4 | 306.9 | 112.9 |
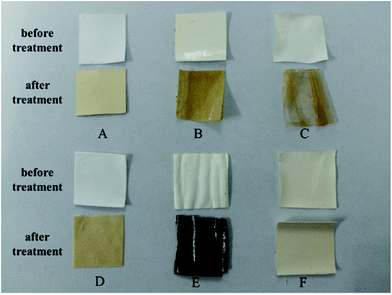
The changes of membrane surface before and after treatment under air atmosphere at 200 °C for 12 h are displayed in Fig. 15. The surface of RC membrane, PA composite membrane and PSF membrane became yellow. The PVDF membrane turned into colorless and transparent, and PAN membrane became dark and fragile. However, there was no evident change for PPS membrane, which indicated that PPS membrane could maintain its physical and chemical structure under high temperature environment.
4. Conclusion
PPS flat sheet membranes were prepared from the ternary systems of PPS/DBS/DPK by TIPS method. As the weight ratio of DBS increased, the interaction between PPS and diluents became weak, and the cross section of PPS membrane changed from spherical particle structure to bi-continuous or cellular structure. When DBS content reached 16 wt%, an interesting sandwich-like PPS membrane structure including branch-like, bi-continuous, cellular structure was obtained, and this membrane had the highest water flux and porosity in various weight ratios of DBS to DPK. Furthermore, the lower cooling rate and less diluents outflowed were beneficial to the increase of water flux and membrane porosity. The tensile strength and breaking elongation could be enhanced when more DBS, higher polymer concentration and faster cooling rate were submitted to experiments. The process of BSA filtration indicated that the membrane with bi-continuous structure exhibited better fouling-resistance and flux recovery ratio than those of membranes with spherical particle structure or cellular structure. Compared with other five membranes containing PVDF membrane, PSF membrane, PAN membrane, RC membrane and PA composite membrane, PPS membrane had superior performance against strong acid, strong alkaline and polar solvent, and it possessed the perfect thermal stability. Therefore, as a promising membrane material, PPS membrane could be applied in water treatment especially including organic solvents, high temperature liquids, strong acid and strong alkali waste due to its extraordinary solvent-resistant, high temperature resistance, anti-acid and alkali resistance performance.Acknowledgements
This work is supported by China National Textile and Apparel Council (No. J201406), The Natural Science Foundation of Tianjin China (No. 15JCZDJC7000), The Science and Technology Plans of Tianjin (No. 15PTSYJC00240) and The National Science Foundation of China (no. 21376177 and 21676202).Notes and references
- J. R. Werber, C. O. Osuji and M. Elimelech, Nat. Rev. Mater., 2016, 1, 1–15 CrossRef.
- Z. Cui, E. Drioli and Y. M. Lee, Prog. Polym. Sci., 2014, 39, 164–198 CrossRef CAS.
- X. Zheng, Z. Zhang, D. Yu, X. Chen, R. Cheng, S. Min, J. Wang, Q. Xiao and J. Wang, Resour., Conserv. Recycl., 2015, 105, 1–10 CrossRef.
- C. Wang, C. Xiao, Q. Huang, J. Pan, C. Wang, C. Xiao, Q. Huang and J. Pan, J. Membr. Sci., 2015, 474, 132–139 CrossRef CAS.
- M. M. Pendergast and E. M. V. Hoek, Energy Environ. Sci., 2011, 4, 1946–1971 CAS.
- L. H. Wang, H. Y. Ding, Y. Q. Shi and B. Q. Liu, J. Macromol. Sci., Part A: Pure Appl.Chem., 2009, 46, 1122–1127 CrossRef CAS.
- W. Tanthapanichakoon, M. Hata, K. H. Nitta, M. Furuuchi and Y. Otani, Polym. Degrad. Stab., 2006, 91, 2614–2621 CrossRef CAS.
- J. Gu, J. Du, J. Dang, W. Geng, S. Hu and Q. Zhang, RSC Adv., 2014, 4, 22101–22105 RSC.
- J. Gu, C. Xie, H. Li, J. Dang, W. Geng and Q. Zhang, Polym. Compos., 2014, 35, 1087–1092 CrossRef CAS.
- H. Zheng, S. Zhu, W. Yu and C. Zhou, J. Macromol. Sci., Part B: Phys., 2014, 53, 1477–1496 CrossRef CAS.
- S. J. Liu, C. X. Zhou and W. Yu, J. Membr. Sci., 2011, 379, 268–278 CrossRef CAS.
- Z. Y. Wang, W. Yu and C. X. Zhou, Polymer, 2015, 56, 535–544 CrossRef CAS.
- G. L. Ji, L. P. Zhu, B. K. Zhu, C. F. Zhang and Y. Y. Xu, J. Membr. Sci., 2008, 319, 264–270 CrossRef CAS.
- J. F. Kim, J. T. Jung, H. H. Wang, S. Y. Lee, T. Moore, A. Sanguineti, E. Drioli and Y. M. Lee, J. Membr. Sci., 2016, 509, 94–104 CrossRef CAS.
- Q. Y. Wu, B. T. Liu, M. Li, L. S. Wan and Z. K. Xu, J. Membr. Sci., 2013, 437, 227–236 CrossRef CAS.
- Q. Y. Wu, L. S. Wan and Z. K. Xu, J. Membr. Sci., 2012, 409–410, 355–364 CrossRef CAS.
- M. J. Park and C. K. Kim, J. Membr. Sci., 2014, 449, 127–135 CrossRef CAS.
- M. J. Park, S. C. Noh and C. K. Kim, Ind. Eng. Chem. Res., 2013, 52, 10690–10698 CrossRef CAS.
- S. C. Roh, M. J. Park, S. H. Yoo and C. K. Kim, J. Membr. Sci., 2012, 411–412, 201–210 CrossRef CAS.
- J. Zhou, H. Zhang, H. T. Wang and Q. G. Du, J. Membr. Sci., 2009, 343, 104–109 CrossRef CAS.
- M. X. Shang, H. Matsuyama, M. Teramoto, D. R. Lloyd and N. Kubota, Polymer, 2003, 44, 7441–7447 CrossRef CAS.
- J. Pan, C. F. Xiao, Q. L. Huang, H. L. Liu and J. Hu, J. Mater. Chem. A, 2015, 3, 23549–23559 CAS.
- G. L. Ji, C. H. Du, B. K. Zhu and Y. Y. Xu, J. Appl. Polym. Sci., 2007, 105, 1496–1502 CrossRef CAS.
- Q. Y. Wu, L. S. Wan and Z. K. Xu, J. Membr. Sci., 2012, 409, 355–364 CrossRef.
- H. Ding, Y. Zeng, X. Meng, Y. Tian, Y. Shi, Q. Jiao and S. Zhang, J. Appl. Polym. Sci., 2006, 102, 2959–2966 CrossRef CAS.
- H. Ding, Z. Qiang, F. Wang, T. Ye, L. Wang, Y. Shi and B. Liu, J. Appl. Polym. Sci., 2007, 105, 3280–3286 CrossRef CAS.
- Y. H. Tang, Y. D. He and X. L. Wang, J. Membr. Sci., 2012, 409–410, 164–172 CrossRef CAS.
- M. Liu, Z. Xu, D. Chen and Y. Wei, Desalin. Water Treat., 2010, 17, 183–192 CrossRef CAS.
- B. Zhou, Y. Tang, Q. Li, Y. Lin, M. Yu, Y. Xiong and X. Wang, J. Appl. Polym. Sci., 2015, 132, 42490 Search PubMed.
- L. Lin, H. X. Geng, Y. X. An, P. L. Li and H. Y. Chang, Desalination, 2015, 367, 145–153 CrossRef CAS.
- H. B. Ly, B. Le Droumaguet, V. Monchiet and D. Grande, Polymer, 2016, 86, 138–146 CrossRef CAS.
- Z. Song, M. Xing, J. Zhang, B. Li and S. Wang, Sep. Purif. Technol., 2012, 90, 221–230 CrossRef CAS.
- G. L. Ji, B. K. Zhu, Z. Y. Cui, C. F. Zhang and Y. Y. Xu, Polymer, 2007, 48, 6415–6425 CrossRef CAS.
- J. E. Mark, Physical Properties of Polymer Handbook, 2007, p. 29 Search PubMed.
- C. M. Hansen, Hansen solubility parameters: a user's handbook, CRC Press, 2007 Search PubMed.
- H. T. Oyama, M. Matsushita and M. Furuta, Polym. J., 2011, 43, 991–999 CrossRef CAS.
- F. M. Shi, Y. X. Ma, J. Ma, P. P. Wang and W. X. Sun, J. Membr. Sci., 2012, 389, 522–531 CrossRef CAS.
- Z. W. Xu, J. G. Zhang, M. J. Shan, Y. L. Li, B. D. Li, J. R. Niu, B. M. Zhou and X. M. Qian, J. Membr. Sci., 2014, 458, 1–13 CrossRef CAS.
- R. J. Gohari, E. Halakoo, N. A. M. Nazri, W. J. Lau, T. Matsuura and A. F. Ismail, Desalination, 2014, 335, 87–95 CrossRef.
- J. F. Kim, J. H. Kim, Y. M. Lee and E. Drioli, AIChE J., 2016, 62, 461–490 CrossRef CAS.
- A. K. Holda and I. F. J. Vankelecom, J. Membr. Sci., 2014, 450, 499–511 CrossRef CAS.
- S. Rajabzadeh, T. Maruyama, T. Sotani and H. Matsuyama, Sep. Purif. Technol., 2008, 63, 415–423 CrossRef CAS.
- G. Chen, Y. K. Lin and X. L. Wang, J. Appl. Polym. Sci., 2007, 105, 2000–2007 CrossRef CAS.
- H. Matsuyama, S. Berghmans and D. R. Lloyd, J. Membr. Sci., 1998, 142, 213–224 CrossRef CAS.
- Y. Mino, T. Ishigami, Y. Kagawa and H. Matsuyama, J. Membr. Sci., 2015, 483, 104–111 CrossRef CAS.
- H. Matsuyama, T. Maki, M. Teramoto and K. Asano, J. Membr. Sci., 2002, 204, 323–328 CrossRef CAS.
- Z. Jing, H. Zhang, H. Wang and Q. Du, J. Membr. Sci., 2009, 343, 104–109 CrossRef.
- Y. H. Tang, H. H. Lin, T. Y. Liu, H. Matsuyama and X. L. Wang, J. Membr. Sci., 2016, 515, 258–267 CrossRef CAS.
- H. Matsuyama, Y. Takida, T. Maki and M. Teramoto, Polymer, 2002, 43, 5243–5248 CrossRef CAS.
- T. H. Xiao, P. Wang, X. Yang, X. H. Cai and J. Lu, J. Membr. Sci., 2015, 489, 160–174 CrossRef CAS.
- N. Han, J. C. Xiong, S. M. Chen, X. X. Zhang, Y. L. Li and L. L. Tan, J. Appl. Polym. Sci., 2016, 133, 43444 CrossRef.
- Y. Tang, Y. Lin, W. Ma, T. Ye, Y. Jian and X. Wang, J. Appl. Polym. Sci., 2010, 118, 3518–3523 CrossRef CAS.
- H. Zhang, Y. L. Zhao, H. T. Wang, W. Zhong, Q. G. Du and X. M. Zhu, J. Membr. Sci., 2010, 354, 101–107 CrossRef CAS.
- K. J. Hwang and P. Y. Sz, J. Membr. Sci., 2011, 378, 272–279 CrossRef CAS.
- Z. Shi, W. Zhang, F. Zhang, X. Liu, D. Wang, J. Jin and L. Jiang, Adv. Mater., 2013, 25, 2422–2427 CrossRef CAS PubMed.
- C. Güell and R. H. Davis, J. Membr. Sci., 1996, 119, 269–284 CrossRef.
- Z. K. Li, W. Z. Lang, W. Miao, X. Yan and Y. J. Guo, J. Membr. Sci., 2016, 511, 151–161 CrossRef CAS.
- Y. Zhang, L. Wang and X. Yan, Chem. Eng. J., 2015, 260, 258–268 CrossRef CAS.
- L. P. Zhu, H. B. Dong, X. Z. Wei, Z. Yi, B. K. Zhu and Y. Y. Xu, J. Membr. Sci., 2008, 320, 407–415 CrossRef CAS.
- C. Duclos-Orsello, W. Li and C. C. Ho, J. Membr. Sci., 2006, 280, 856–866 CrossRef CAS.
- Q. Shi, Y. Su, S. Zhu, C. Li, Y. Zhao and Z. Jiang, J. Membr. Sci., 2007, 303, 204–212 CrossRef CAS.
- A. Rahimpour, S. S. Madaeni, M. Amirinejad, Y. Mansourpanah and S. Zereshki, J. Membr. Sci., 2009, 330, 189–204 CrossRef CAS.
- J. Gu, X. Yang, C. Li and K. Kou, Ind. Eng. Chem. Res., 2016, 55, 10941–10946 CrossRef CAS.
- J. Gu, X. Meng, Y. Tang, Y. Li, Q. Zhuang and J. Kong, Composites, Part A, 2016, 92, 27–32 CrossRef.
| This journal is © The Royal Society of Chemistry 2017 |

