 Open Access Article
HBT-based turn-on fluorescent probe for discrimination of homocysteine from glutathione/cysteine and its bioimaging applications†
Fengzao Chenab,
Zhen Chena,
Yuanchao Suna,
Heng Liu *a,
Deman Hanb,
Hanping Hea,
Xiuhua Zhang
 a and
Shengfu Wanga
aHubei Collaborative Innovation Center for Advanced Organic Chemical Materials, Ministry of Education Key Laboratory for the Synthesis and Application of Organic Functional Molecules, College of Chemistry and Chemical Engineering, Hubei University, Wuhan 430062, PR China. E-mail: liuheng11b@hubu.edu.cn
bDepartment of Chemistry, Taizhou University, Jiaojiang 318000, PR China
First published on 14th March 2017
Abstract
Based on ESIPT and heavy atom effect strategy, we firstly reported a new type of turn-on fluorescent probe for Hcy. This probe displayed fast response time (15 min), excellent selectivity over other interfering species and high sensitivity with a low detection limit of 1.6 × 10⁻⁷ M in PBS buffer containing 1% CH3CN (v/v). Moreover, the probe was also successfully applied for fluorescence imaging of Hcy in HeLa cells.
Introduction
Thiol-containing biomolecules, such as glutathione (GSH), homocysteine (Hcy) and cysteine (Cys) are important antioxidants in living organisms and play vital roles in many physiological and pathological processes.1 Studies have shown that abnormal levels of cellular thiols will lead to a series of health problems.2 Elevated Hcy levels could induce severe cardiovascular and Alzheimer's diseases, and mental disorders;3 the lack of Cys might cause metabolic diseases including hair loss, stunted growth, skin lesions and hematopoietic disorder;4 abnormal levels of GSH are closely associated with AIDS, cancer, cardiovascular disease, and inflammatory bowel disease.5 Therefore, monitoring the fluctuations of biothiol levels is of great significance for the early diagnosis and treatment of diseases.In the past few years, a host of fluorescent probes for biothiols have been reported based on different sensing mechanisms, including Michael addition,6 nucleophilic substitution,7 addition–cyclization,8 cleavage reaction,9 metal complex-displace coordination.10 However, most of the reported fluorescent probe for biothiols took focus on distinguishing Cys from GSH/Hcy or distinguishing GSH from Cys/Hcy. Up till now, the probe that could discriminate Hcy from GSH/Cys was not only rare but also suffered from high detection limit, slow response time and high organic solvent volume ratio.11 Consequently, there is urgent need to develop more effective probes for selective discrimination of Hcy from GSH/Cys.
In this work, a novel turn-on fluorescent probe, namely HBTI, was firstly developed based on the excited state intramolecular proton transfer (ESIPT) and heavy atom effect strategy. In the design, the iodine moiety is not only a leaving group but also a quintessential fluorescence quencher. It could be easily replaced by the sulfhydryl group (–SH) of biothiols, which will lead to the alteration of fluorescence intensity of the probe. However, due to the effect of different distances between –SH group and amido group (–NH2) of Cys and Hcy, NH2 group of Cys might further react with carbonyl of probe HBTI to form six-membered ring imine structure. The formed imine group would obviously weaken internal charge transfer (ICT) of the probe and result in the reduction of fluorescence intensity. In the presence of GSH, the probe exhibits the moderate fluorescence intensity due to the steric-hindrance effects. In addition, the probe can be successfully applied to the detection of Hcy in HeLa cells by fluorescence imaging.
Experimental
Reagents and instruments
All reagents and solvents were purchased from standard commercial suppliers and used without further purification. All the solutions were prepared with ultrapure water (18.2 M cm−1). All pH measurements were obtained on a PHS-3C (SCRPF E-201-C). Column chromatography involved 200–300 mesh silica gel. All of the reactions were magnetically stirred and monitored by thin-layer chromatography (TLC) using UV light. All the spectra were measured in a quartz cuvette with 10.0 mm path length (volume: 3.5 ml). UV-vis absorption spectra were obtained on a Shimadzu UV-2700 spectrophotometer. Fluorescence emission spectrum and relative fluorescence intensity were acquired on a Shimadzu RF-5301 spectrofluorimeter. The excitation wavelength was 385 nm for all fluorescence measurements and the excitation/emission slit width set at 3 nm. 1H NMR and 13C NMR spectra were recorded on a BRUKER 400 spectrometer with tetramethylsilane (TMS) as internal standard. LC-MS (ESI) was measured with an Agilent 6224 Liquid Chromatography Mass Spectrometer. Cells images were obtained using CLSM TCS SP5 (Leica, Germany).Synthesis
![[thin space (1/6-em)]](https://www.rsc.org/images/entities/char_2009.gif) :
:![[thin space (1/6-em)]](https://www.rsc.org/images/entities/char_2009.gif) 1) gave desired product (128 mg, yield 81%). 1H NMR (400 MHz, d6-DMSO): δ 12.32 (s, 1H), 8.86 (s, 1H), 8.15 (d, J = 7.9 Hz, 1H), 8.11 (d, J = 8.1 Hz, 1H), 8.01 (dd, J = 8.6, 2.2 Hz, 1H), 7.55 (t, J = 7.3 Hz, 1H), 7.46 (t, J = 7.5 Hz, 1H), 7.18 (t, J = 8.6 Hz, 1H), 2.60 (s, 3H); 13C NMR (100 MHz, d6-DMSO): δ 196.1, 163.2, 159.9, 151.4, 134.9, 132.4, 129.3, 128.9, 126.5, 125.2, 122.4, 122.0, 118.8, 116.9, 26.5; LC-MS TOF: calcd for C15H11NO2S [M + H]+: 270.0510; found: 270.0665.
1) gave desired product (128 mg, yield 81%). 1H NMR (400 MHz, d6-DMSO): δ 12.32 (s, 1H), 8.86 (s, 1H), 8.15 (d, J = 7.9 Hz, 1H), 8.11 (d, J = 8.1 Hz, 1H), 8.01 (dd, J = 8.6, 2.2 Hz, 1H), 7.55 (t, J = 7.3 Hz, 1H), 7.46 (t, J = 7.5 Hz, 1H), 7.18 (t, J = 8.6 Hz, 1H), 2.60 (s, 3H); 13C NMR (100 MHz, d6-DMSO): δ 196.1, 163.2, 159.9, 151.4, 134.9, 132.4, 129.3, 128.9, 126.5, 125.2, 122.4, 122.0, 118.8, 116.9, 26.5; LC-MS TOF: calcd for C15H11NO2S [M + H]+: 270.0510; found: 270.0665.![[thin space (1/6-em)]](https://www.rsc.org/images/entities/char_2009.gif) :
:![[thin space (1/6-em)]](https://www.rsc.org/images/entities/char_2009.gif) 1) gave desired product (70 mg, yield 38%). 1H NMR (400 MHz, d6-DMSO): δ 12.47 (s, 1H), 8.90 (s, 1H), 8.15–8.10 (m, 3H), 7.55 (s, 1H), 7.46 (s, 1H), 7.19 (s, 1H), 4.60 (s, 2H); 13C NMR (100 MHz, d6-DMSO): δ 191.7, 162.9, 160.1, 151.1, 134.7, 132.9, 129.9, 126.3, 125.1, 125.0, 122.2, 121.8, 118.9, 116.8, 4.48; HRMS: calcd for C15H10INO2S [M + H]+: 395.9477; found: 395.9557.
1) gave desired product (70 mg, yield 38%). 1H NMR (400 MHz, d6-DMSO): δ 12.47 (s, 1H), 8.90 (s, 1H), 8.15–8.10 (m, 3H), 7.55 (s, 1H), 7.46 (s, 1H), 7.19 (s, 1H), 4.60 (s, 2H); 13C NMR (100 MHz, d6-DMSO): δ 191.7, 162.9, 160.1, 151.1, 134.7, 132.9, 129.9, 126.3, 125.1, 125.0, 122.2, 121.8, 118.9, 116.8, 4.48; HRMS: calcd for C15H10INO2S [M + H]+: 395.9477; found: 395.9557.General procedure for the spectra measurement
The stock solution of probe (0.5 mM) was prepared in acetonitrile (CH3CN). Solutions of the analytes including Ala, Arg, Asp, Glu, Gly, His, Ile, Leu, Lys, Met, Phe, Pro, Ser, Thr, Trp, Tyr, Val, NaSH, Cys, Hcy, GSH, Fe(NO3)2, Al(NO3)3, Mg(NO3)2, Zn(NO3)2, NaBr, NaCl, NaI, NaF, Na2CO3, NaHCO3, Na2HPO4, NaNO2, Na2SO4, Na2S2O3, NaClO, H2O2 were prepared in ultrapure water. The resulting solution was kept at room temperature and then the absorption or fluorescence spectra were recorded.Cell culture and imaging
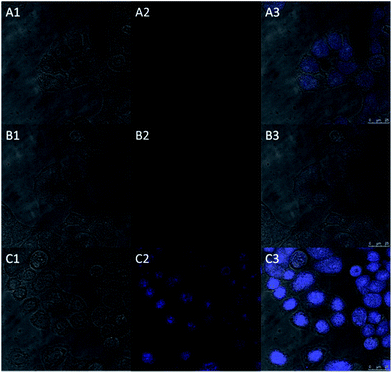
HeLa cells were cultured in Dulbecco's Modified Eagle Medium (DMEM), fetal bovine serum (10%), penicillin (100 μg ml−1) and streptomycin (100 μg ml−1) at 37 °C in a CO2 incubator. In the fluorescence imaging experiment, the cells incubated with only probe HBTI (10 μM) for 30 min at 37 °C. In one control experiment, the cells were pretreated with N-ethylmaleimide for 30 min and then treated with probe HBTI (10 μM) for another 30 min. In another control experiment, the cells were treated with N-ethylmaleimide for 30 min followed by treatment with the probe for 30 min and Hcy for 30 min. The cells should be washed three times with PBS buffer before fluorescence imaging experiment with confocal laser scanning microscopy.Results and discussion
Spectral properties of probe HBTI
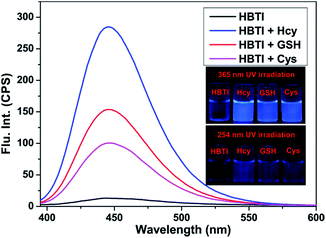
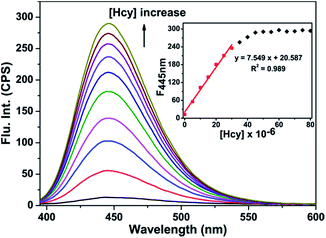
With the probe HBTI in hand, we first examined its spectral properties. The free probe showed a weak fluorescence emission band in PBS buffer (10 mM, pH 7.4, containing 1% CH3CN, v/v) when it was excited at 385 nm. The fluorescence quantum yield of the probe was 0.024. After treating with 1 mM Hcy, GSH and Cys separately, the fluorescence intensities at 445 nm of the probe were enhanced in varying degrees as shown in Fig. 1. Meanwhile, the fluorescence quantum yield increased to 0.31, 0.22 and 0.19, using 9,10-bis(phenylethynyl)-anthracene (Φf = 1.0 in cyclohexane) as a standard.The fluorescence titration was investigated as illustrated in Fig. 2. As the amount of Hcy increased, an increasing enhancement of the fluorescence intensity at 445 nm was observed. When the concentration of Hcy ran up to 45 μM, the fluorescence intensity reached saturation. At the same time, a good linear correlation between the fluorescence emission intensity and the concentration of Hcy in the range of 0–30 μM (R2 = 0.989) was obtained. The detection limit of probe HBTI for Hcy was calculated to 1.6 × 10⁻⁷ M on the basis of S/N = 3. These results indicated probe HBTI could be served as a high sensitive fluorescent probe for Hcy compared to the reported fluorescent probe (Table S1†). Similar fluorescence titrations of GSH and Cys to the probe solution were also investigated (Fig. S1†). And the detection limits for GSH and Cys were measured to be 4.0 × 10⁻⁷ M and 5.5 × 10⁻⁷ M, respectively.
Time-dependent fluorescence measures of the probe HBTI
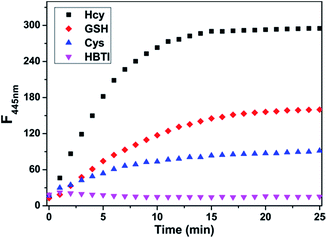
Next, the time-dependent fluorescence measures of the probe HBTI toward Hcy/GSH/Cys/NaSH were evaluated in PBS buffer (10 mM, pH 7.4, containing 1% CH3CN, v/v). As shown in Fig. 3, the fluorescence intensity at 445 nm of free probe HBTI kept almost unchange within 25 min, suggesting that the probe had superior stability. Upon addition of Hcy, the fluorescence intensity gradually increased in the course of time and reached equilibrium at around 15 min. Therefore, the response time of 15 min would be leveraged for the following experiments. The kinetic studies of the response of probe HBTI to Hcy, GSH and Cys were also performed in Fig. S2.† The observed pseudo-first-order rate constants (Kobs) for Hcy, GSH and Cys were estimated to be 0.221 min−1, 0.127 min−1 and 0.147 min−1, indicating that probe HBTI could be regarded as potential candidates for applications in detecting of biothiols.Effect of pH on the probe HBTI
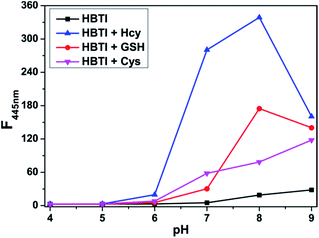
We also investigated the sensing performance of probe HBTI to biothiols under different pH values. As displayed in Fig. 4, there was almost no change in the fluorescence intensity of free probe HBTI within pH values ranging from 4.0 to 9.0, suggesting that the probe had good stability in a broad pH range. The fluorescence intensity of the probe appeared a slightly increase under alkaline conditions due to hydrolysis reaction of the iodine moiety. Furthermore, after adding 50 μM Hcy to the solution of the probe, the fluorescence intensity at 445 nm showed a significant positive enhancement at the pH range of 6.0–9.0. Similar experimental phenomenons of GSH and Cys to the probe solution at different pH ranges were obtained. All these data demonstrated that probe HBTI could be used as an ideal Hcy probe in physiological environment.The selectivity of probe HBTI for Hcy
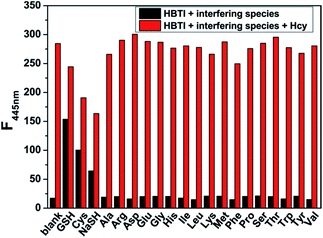
It is well-known that the selectivity is a very important consideration in assessing the performance of as-prepared probe. Therefore, we evaluated the selectivity of probe HBTI toward Hcy over a series of biologically relevant analytes, including common amino acids (Ala, Arg, Asp, Glu, Gly, His, Ile, Leu, Lys, Met, Phe, Pro, Ser, Thr, Trp, Tyr, Val), ions (Br−, Cl−, F−, I−, CO32−, HCO3−, HPO42−, NO2−, SO42−, S2O32−, Al3+, Fe2+, Mg2+, Zn2+) and reactive oxygen species (ClO−, H2O2). As illustrated in Fig. S3,† only the addition of Hcy, GSH, Cys and NaSH induced an increase of fluorescence intensity in different degrees while non-thiol-bearing amino acid had no discernible effect. Also, Fig S4† showed that the addition of various ions and redox species did not induce changes of fluorescence intensity of the probe. Furthermore, in order to explore the practical applicability of the probe, competitive experiment was performed in the presence of Hcy and other biologically relevant analytes. Fig. 5 showed that almost no obvious influence on detection of Hcy was observed in the presence of coexisting non-thiol-bearing amino acid. Although fluorescence intensity changed to different degrees after the addition of GSH, Cys and NaSH, Hcy could still be identified from the extent of the enhanced fluorescence. All these results proved that probe HBTI possessed the capability of highly selective sensing Hcy and had the potential to be used to detect Hcy in complex physiological environment.Sensing mechanism
In order to elucidate the sensing mechanism of probe HBTI, the 1H NMR and ESI-MS spectrum analysis of probe HBTI with Hcy, GSH and Cys were conducted according to the literature.12 Upon excessive Hcy, GSH and Cys respectively, the 1H NMR signal of aromatic hydrogen were apparently shifted to high-field with small shift, suggesting that the nucleophilic substitution of the sulfhydryl group with iodine moiety have been occurred (Fig. S5†). In addition, as illustrated in Fig. S6,† in the presence of excessive Hcy, GSH and Cys, the dominant peaks at m/z = 403.2, 575.1 and 371.1 could be attributed to [HBTI + Hcy]+, [HBTI + GSH]+ and [HBTI + Cys]+ respectively, which further supported the proposed sensing mechanism in Scheme 1.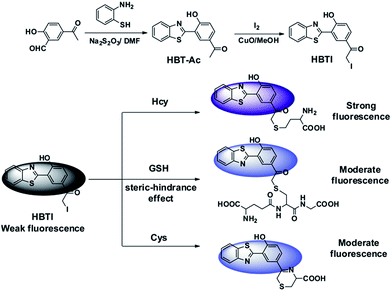 | ||
| Scheme 1 Synthesis route of the target fluorescent probe HBTI and the possible reaction mechanism with Hcy/GSH/Cys. | ||
Fluorescence imaging of probe HBTI in living cells
Inspired by the above experiment results, we next investigated the practicability of the probe in cellular imaging. The HeLa cells incubated with only probe HBTI (10 μM) for 30 min at 37 °C showed weak blue fluorescence upon excitation at 405 nm. In the control experiment, when the HeLa cells were pretreated with N-ethylmaleimide (NEM, 0.5 mM, a blocking reagent for thiol species) for 30 min and then treated with probe HBTI for another 30 min, almost no blue fluorescence was detected. In another control experiment, after being preincubated with NEM for 30 min, the HeLa cells were further incubated with probe HBTI (10 μM) for 30 min and then treated with Hcy (50 μM) for another 30 min. The cells exhibited strong blue fluorescence as shown in Fig. 6. Meanwhile, we also evaluated the cytotoxicity of the probe with different concentrations using a standard CCK-8 assay.13 The experiment results showed that the cell viability kept above 90%, which suggested that the probe exhibited low cytotoxicity to the culture cells (Fig. S7†). All these results clearly demonstrated that the probe was capable of detecting biothiols in living cells.Conclusions
In conclusion, we have successfully developed a new type of turn-on fluorescent probe for Hcy by ESIPT and heavy atom effect strategy. The probe can discriminate Hcy from other related interfering species with high selectivity. Meanwhile, the probe shows a fast fluorescence response to Hcy in 15 min with a low detection limit of 1.6 × 10⁻⁷ M. More importantly, the probe can be applied to detect Hcy in HeLa cells with low cytotoxicity. The preliminary cell experiment results indicated the probe could be used as a useful tool for detection of Hcy in living cells.Acknowledgements
This work was supported by the National Natural Science Foundation of China (NSFC 21602051, 21575097, 21375092), the Natural Science Foundation of Hubei Province (2016CFB200) and the Key Project of the Education Department of Hubei Province (No. Q2015010).References
- (a) D. M. Townsend, K. D. Tew and H. Tapiero, Biomed. Pharmacother., 2004, 58, 47 CrossRef CAS PubMed; (b) S. Zhang, C. N. Ong and H. M. Shen, Cancer Lett., 2004, 208, 143 CrossRef CAS PubMed.
- H. Tapiero, D. M. Townsend and K. D. Tew, Biomed. Pharmacother., 2003, 57, 134 CrossRef CAS.
- S. Seshadri, A. Beiser, J. Selhub, P. F. Jacques, I. H. Rosenberg, R. B. D'Agostino, P. W. F. Wilson and P. A. Wolf, N. Engl. J. Med., 2002, 346, 476 CrossRef CAS PubMed.
- S. Shahrokhian, Anal. Chem., 2001, 73, 5972 CrossRef CAS PubMed.
- J. Lasierra-Cirujeda, P. Coronel, M. J. Aza and M. Gimeno, J. Blood Med., 2013, 4, 31 CrossRef CAS PubMed.
- (a) B. K. Rani and S. A. John, Biosens. Bioelectron., 2016, 83, 237 CrossRef CAS PubMed; (b) Y. Liu, X. Lv, M. Hou, Y. Shi and W. Guo, Anal. Chem., 2015, 87, 11475 CrossRef CAS PubMed; (c) V. V. S. Mummidivarapu, D. S. Yarramala, K. K. Kondaveeti and C. P. Rao, J. Org. Chem., 2014, 79, 10477 CrossRef CAS PubMed.
- (a) L. Zhang, M. Li, C. Zhao and X. Gu, Tetrahedron Lett., 2016, 57, 578 CrossRef CAS; (b) X. Han, F. Yu, X. Song and L. Chen, Chem. Sci., 2016, 7, 5098 RSC; (c) B. Gao, L. Cui, Y. Pan, G. Zhang, Y. Zhou, C. Zhang, S. Shuang and C. Dong, RSC Adv., 2016, 6, 43028 RSC; (d) M. Cao, H. Chen, D. Chen, Z. Xu, S. H. Liu, X. Chen and J. Yin, Chem. Commun., 2016, 52, 721 RSC; (e) L. Song, H. Tian, X. Pei, Z. Zhang, W. Zhang and J. Qian, RSC Adv., 2015, 5, 59056 RSC; (f) L. Y. Niu, Q. Q. Yang, H. R. Zheng, Y. Z. Chen, L. Z. Wu, C. H. Tung and Q. Z. Yang, RSC Adv., 2015, 5, 3959 RSC; (g) D. Lee, G. Kim, J. Yin and J. Yoon, Chem. Commun., 2015, 51, 6518 RSC; (h) X. F. Yang, Q. Huang, Y. Zhong, Z. Li, H. Li, M. Lowry, J. O. Escobedo and R. M. Strongin, Chem. Sci., 2014, 5, 2177 RSC.
- (a) J. Zhang, Y. Lv, W. Zhang, H. Ding, R. Liu, Y. Zhao, G. Zhang and Z. Tian, Talanta, 2016, 146, 41 CrossRef CAS PubMed; (b) Y. Qu, X. Zhang, L. Wang, H. Yang, L. Yang, J. Cao and J. Hua, RSC Adv., 2016, 6, 22389 RSC; (c) W. Niu, L. Guo, Y. Li, S. Shuang, C. Dong and M. S. Wong, Anal. Chem., 2016, 88, 1908 CrossRef CAS PubMed; (d) X. Liu, D. Yang, W. Chen, L. Yang, F. Qi and X. Song, Sens. Actuators, B, 2016, 234, 27 CrossRef CAS; (e) C. Chen, W. Liu, C. Xu and W. Liu, Biosens. Bioelectron., 2016, 85, 46 CrossRef CAS PubMed; (f) A. R. Sarkar, C. H. Heo, E. Kim, H. W. Lee, H. Singh, J. J. Kim, H. Kang, C. Kang and H. M. Kim, Chem. Commun., 2015, 51, 2407 RSC.
- (a) X. Dai, T. Zhang, J.-Y. Miao and B. X. Zhao, Sens. Actuators, B, 2016, 223, 274 CrossRef CAS; (b) S. Areti, S. K. Verma, J. Bellare and C. P. Rao, Anal. Chem., 2016, 88, 7259 CrossRef CAS PubMed; (c) J. Zhang, B. Yu, L. Ning, X. Zhu, J. Wang, Z. Chen, X. Liu, X. Yao, X. Zhang and H. Zhang, Eur. J. Org. Chem., 2015, 2015, 1711 CrossRef CAS; (d) W. Jiang, H. Chen, Y. Pan and W. Lin, Anal. Methods, 2015, 7, 4168 RSC; (e) S. Areti, R. Teotia and C. P. Rao, Analyst, 2015, 140, 7391 RSC.
- (a) R. K. Pathak, J. Dessingou and C. P. Rao, Anal. Chem., 2012, 84, 8294 CrossRef CAS PubMed; (b) J. Dessingou, A. Mitra, K. Tabbasum, G. S. Baghel and C. P. Rao, J. Org. Chem., 2012, 77, 371 CrossRef CAS PubMed; (c) R. K. Pathak, V. K. Hinge, M. Mondal and C. P. Rao, J. Org. Chem., 2011, 76, 10039 CrossRef CAS PubMed; (d) R. Kumar Pathak, K. Tabbasum, V. Kumar Hinge and C. Pulla Rao, Chem.–Eur. J., 2011, 17, 13999 CrossRef PubMed; (e) R. Joseph, B. Ramanujam, A. Acharya and C. P. Rao, J. Org. Chem., 2009, 74, 8181 CrossRef CAS PubMed.
- (a) Y. W. Wang, S. B. Liu, W. J. Ling and Y. Peng, Chem. Commun., 2016, 52, 827 RSC; (b) L. Tang, J. Shi, Z. Huang, X. Yan, Q. Zhang, K. Zhong, S. Hou and Y. Bian, Tetrahedron Lett., 2016, 57, 5227 CrossRef CAS; (c) N. Zhao, Q. Gong, R. X. Zhang, J. Yang, Z. Y. Huang, N. Li and B. Z. Tang, J. Mater. Chem. C, 2015, 3, 8397 RSC; (d) J. Zhang, X. D. Jiang, X. Shao, J. Zhao, Y. Su, D. Xi, H. Yu, S. Yue, L.-j. Xiao and W. Zhao, RSC Adv., 2014, 4, 54080 RSC; (e) H. Y. Lee, Y. P. Choi, S. Kim, T. Yoon, Z. Guo, S. Lee, K. M. K. Swamy, G. Kim, J. Y. Lee, I. Shin and J. Yoon, Chem. Commun., 2014, 50, 6967 RSC; (f) S. Chen, Y. Hong, J. Liu, N.-W. Tseng, Y. Liu, E. Zhao, J. W. Yip Lam and B. Z. Tang, J. Mater. Chem. B, 2014, 2, 3919 RSC; (g) W. Wang, J. O. Escobedo, C. M. Lawrence and R. M. Strongin, J. Am. Chem. Soc., 2004, 126, 3400 CrossRef CAS PubMed.
- L. He, Q. Xu, Y. Liu, H. Wei, Y. Tang and W. Lin, ACS Appl. Mater. Interfaces, 2015, 7, 12809 CAS.
- (a) Z. Chen, F. Chen, Y. Sun, H. Liu, H. He, X. Zhang and S. Wang, RSC Adv., 2017, 7, 2573 RSC; (b) Y. Lv, P. Liu, H. Ding, Y. Wu, Y. Yan, H. Liu, X. Wang, F. Huang, Y. Zhao and Z. Tian, ACS Appl. Mater. Interfaces, 2015, 7, 20640 CrossRef CAS PubMed.
Footnote |
| † Electronic supplementary information (ESI) available. See DOI: 10.1039/c6ra28712c |
| This journal is © The Royal Society of Chemistry 2017 |

