DOI:
10.1039/C6RA28560K
(Paper)
RSC Adv., 2017,
7, 6457-6466
Amino acid-assisted synthesis of In2S3 hierarchical architectures for selective oxidation of aromatic alcohols to aromatic aldehydes†
Received
22nd December 2016
, Accepted 5th January 2017
First published on 19th January 2017
Abstract
In this work, we report a facile and bioinspired synthesis of mesoporous indium sulfide nanoparticles with flowerlike structures controlled by amino acids. During the synthesis procedure, indium sulfide precipitate was prepared by a simple solvothermal method with different amino acids as the directing and assembling agent. The resulting photocatalyst was characterized by X-ray powder diffraction (XRD), scanning electron microscopy (SEM), UV-vis diffuse reflection spectroscopy (DRS), transmission electron microscopy (TEM), Brunauer–Emmett–Teller (BET) specific surface area, electron spin resonance (ESR) and X-ray photoelectron spectroscopy (XPS). Depending on different amino acids as the crystallization modifiers, the indium sulfide samples exhibit different morphologies. The photocatalytic test of selective oxidation of aromatic alcohols to aromatic aldehydes under visible light irradiation shows that indium sulfide nanoparticles synthesized with addition of amino acids exhibit an increased photoactivity compared to that of In2S3 nanocatalyst without amino acids, which can be attributed to both the relatively high BET surface area and effective separation of photogenerated charge carriers. The effect of various radical scavengers is also investigated. ˙O2− radicals and holes are the main reactive species for photocatalytic oxidation of benzyl alcohol (BA) to benzaldehyde (BAD).
1. Introduction
Selective oxidation of alcohols into corresponding aldehydes and ketones is a vital conversion from the perspective of organic synthesis and industrial manufacturing due to their extensive utilization in manufacture of many spices, vitamins and fragrances.1–4 Many oxidations of this type are carried out using stoichiometric amounts of toxic or corrosive oxidizing reagents (i.e., KMnO4, MnO2, CrO3, Br2, etc.) with considerable demerits such as high energy consumption, redundant byproducts, and serious contamination of the environment.5–9 By contrast, molecular oxygen may serve as superior oxidant with lower cost, greater abundance, and improved safety.10,11 Furthermore, the side reaction can be reduced to the minimum owing to the brief reaction path provided by the alcohol oxidation with unique reaction mechanism.12 Consequently, selective oxidation of alcohols into corresponding aldehydes provides a promising scheme for organic synthesis and commercial manufacture.
In recent years, indium sulfide (In2S3), as a typical III–VI group chalcogenide with a band gap of 2.0–2.3 eV, has been the focus of intensive research owing to its photoconductive and luminescence properties. At atmospheric pressure, In2S3 can exhibit three different structure forms, i.e. α-In2S3 (defect cubic structure), β-In2S3 (defect spinel structure obtained in either cubic or tetragonal form), and γ-In2S3 (layered hexagonal structure). Among them, β-In2S3 as an n-type semiconductor plays an increasingly important position owning to its defect spinel structure and corresponding optical, acoustic and electronic properties. It has already inspired many applications in the preparation of green and red phosphors in the manufacture of picture tubes for color televisions, cells, and heterojunction for use in photovoltaic electric generators, photocatalyst for dye degradation, water splitting and selective oxidation.13–17 Many efforts have been devoted to synthesizing β-In2S3 with different morphologies to make better use of the properties for β-In2S3 in photocatalysis.
Recently, with more emphasis paid to green chemistry, the nanotechnology of biosynthesis has attracted considerable attention in materials science due to their effectiveness, flexibility and environmentally friendly pathways for nanoparticle synthesis.18–20 The biomaterial templating technique has been verified to be an efficient approach for directing the synthesis and manufacture of crystalline inorganic materials under environmentally benign conditions.21 Many organisms (such as DNA, viruses, amino acids and sugars) use functional organic biopolymers to aid sequestration of metal species from their environment and direct mineralization of an inorganic phase.22–24
It is known that amino acids, as the basic structural units of proteins, are of particular interest to scholars due to its multifunctional groups (–NH2, and –COOH).25–28 And it can be used for the conjugation of metallic ions or other functional groups. They contain hydrophilic functional groups and have the ability of complex formation with metal ions, which may serve as precursors of inorganic nanomaterials. Therefore, a directing template can be used to control the growth orientation of the nanocrystals, and then the unique morphology of the product may be obtained.29,30 Furthermore, amino acid is easily available and stable.31 Significant efforts have been made in order to develop catalytic systems that are able to efficiently control inorganic crystal growth, especially a crystal growth modifier for semiconductors.32,33 However, up to now, except for cysteine, it is rarely reported that the other different kinds of amino acids are utilized to control crystal growth of semiconductor.
Herein, we report a facile and tunable method for synthesizing mesoporous In2S3 with hierarchical nanoarchitectures through the addition of a small amount of amino acids as the crystal growth modifier in the reaction system, without the introduction of any macromolecular surfactants or capping agents. And this green and simple method would be expected to be a general method for the fabrications of mesoporous metal sulfides with hierarchical nanoarchitectures.
2. Experimental
2.1. Materials
Indium chloride tetrahydrate (InCl3·4H2O), thioacetamide (TAA), amino acids (asparatic acid, serine and glycine), hydrochloric acid (HCl), n-butanol and other chemicals used in the experiments are commercially available. Deionized water was used throughout this study.
2.2. Preparation of photocatalysts
In a typical synthesis procedure, 2 mmol InCl3·4H2O and 3.4 mmol amino acid were dissolved in the mixture of 30 mL deionized water and 30 mL butanol in a 100 mL Teflon-lined autoclave. Next, drops of HCl solution were added to adjust the pH value of the solution to about 3. And then, 10 mmol TAA was added into the above solution. After stirring for 30 min, the autoclave was sealed and maintained at 150 °C for 30 h. The orange-red precipitates were collected and washed by deionized water and absolute ethyl alcohol for several times, respectively. The final products were dried in air at 60 °C. Additionally, three different kinds of amino acids (aspartic acid, serine, glycine) have been chosen as additives under the same conditions which were labeled as IS-A, IS-S, and IS-G, respectively. For comparison, In2S3 sample was also synthesized without amino acid, and labeled as IS-N.
2.3. Characterization
The phase structures and the crystallite size of the photocatalysts were identified by power X-ray diffraction (XRD) on a Bruker D8 advance X-ray powder diffractometer, with Cu Kα radiation (λ = 1.5406 Å) at a scanning rate of 3° min−1. The accelerating voltage and emission current were 40 kV and 40 mA. The morphology and particle sizes of the photocatalyst were investigated using field-emission scanning electron microscope (FESEM, Carl Zeiss SUPRA 55SAPPHIRE) and the analysis of the composition of the samples was performed with an energy dispersive X-ray (EDX) spectroscope coupled to FESEM. Transmission electron microscopy (TEM) and high-resolution transmission electron microscopy (HR-TEM) images were collected on a Field Emission Transmission Electron Microscope (Tecnai G2 F20 S-Twin, FEI), using an accelerating voltage of 200 kV. UV-vis diffuse reflectance spectroscopy (DRS) were measured with a Hitachi UV-365 spectrophotometer equipped with an integrating sphere assembly, using BaSO4 as a reference material. The data were collected ranging from 400 nm to 800 nm. The Brunauer–Emmett–Teller (BET) surface areas were carried out by N2 adsorption–desorption at 77 K using a Micromeritics ASAP 2460 instrument. XPS experiments were carried out on a RBD upgraded PHI-5000C ESCA system with a Mg Kα radiation (hν = 1253.6 eV) or Al Kα radiation (hν = 1486.6 eV). Binding energies were calibrated by using the containment carbon (C 1s = 284.6 eV). Electron spin resonance (ESR) signals of spin-trapped paramagnetic species with 5,5-dimethyl-L-pyrroline N-oxide (DMPO) were examined using a Bruker E500 spectrometer with a light source of a 300 W xenon lamp (λ > 420 nm).
2.4. Photoelectrochemical experiment
The photoelectrochemical analysis was performed in a conventional three-electrode system (CHI-660E, Chenhua Instruments Co., Shanghai, China) using a Pt wire as the counter electrode, a Ag/AgCl electrode as the reference electrode, and the sample as the working electrode with an active area of 0.25 cm2. A 300 W xenon lamp (PLS-SXE 300C, Beijing Perfect light) with a UV cutoff filter (λ > 420 nm) was used as the visible light source.
2.5. Evaluation of photocatalytic activity
Due to its inertness to oxidation and high solubility for molecular oxygen, benzotrifluoride (BTF) was chosen as the solvent in the experiment.34 The main steps of the photocatalytic selective oxidation of alcohols are as follows: 0.5 mmol alcohol and 80 mg of catalyst were dispersed in 15 mL BTF, and then loaded into a 100 mL of Teflon-lined stainless steel autoclave filled with molecular oxygen at a pressure of 0.1 MPa. A 300 W xenon lamp (PLS-SXE 300C, Beijing Perfect light) with a UV-cut filter (λ > 420 nm, Instrument Company of Nantong, China) was used as a visible light source. In order to maintain the temperature of the reaction solution at about 50 °C, the circulating water was introduced in the reaction system during the illumination. After the reaction, the mixture was centrifuged to remove the photocatalyst particles. The obtained solution was analyzed by a Gas Chromatograph (FuLi-9790) equipped with a SE-30 capillary column (30 m, 0.53 mm, Lanzhou Atech Technologies Co. Ltd). Conversion of alcohol, yield of aldehyde, and selectivity for aldehyde were defined as the follows:| | |
Conversion (%) = [(C0 − Calcohol)/C0] × 100
| (1) |
| | |
Yield (%) = Caldehyde/C0 × 100
| (2) |
| | |
Selectivity (%) = [Caldehyde/(C0 − Calcohol)] × 100
| (3) |
where C0 is the initial concentration of alcohol; Calcohol and Caldehyde are the concentration of the substrate alcohol and the corresponding aldehyde at a certain time after the photocatalytic reaction, respectively.
3. Results and discussion
3.1. Characterization of photocatalysts
3.1.1. XRD analysis. XRD patterns are recorded to identify the purity, crystallinity and phase composition of the as-synthesized samples as displayed in Fig. 1. The diffraction peaks at 2θ values of 14.2°, 23.3°, 27.4°, 28.7°, 33.4°, 43.6°, 47.8°, 55.9°, 56.6°, 66.8°, and 69.9° are corresponding to the diffractions of the (111), (220), (311), (222), (400), (511), (440), (533), (444), (731) and (800) crystal planes of pure cubic β-In2S3 phase (a = b = c = 1.0774 nm, JCPDS no. 65-0459). No other peaks of impurities were found. However, compared to IS-N, a decrease in diffraction intensity and broadening of diffraction peak can be observed from the other three samples. This may be ascribed to a decrease of the particle size derived from the change of addictive amino acids.
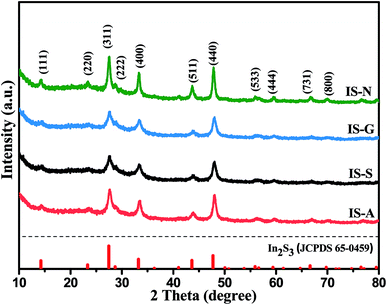 |
| | Fig. 1 XRD patterns of samples: IS-A, IS-S, IS-G, IS-N. | |
3.1.2. UV-vis DRS analysis. UV-vis diffuse reflection spectra of the as-synthesized In2S3 powders are shown in Fig. 2A. It could be seen that all the In2S3 samples have a steep absorption edge in the visible range which are very close. It indicates that they have similar optical properties. The absorption threshold is up to 620 nm. Furthermore, as an indirect semiconductor, the band gap energy (Eg) of the In2S3 samples is estimated by a classical extrapolation approach according to the following equation: αhν = A(hν − Eg)1/2 (where α, ν, Eg and A are absorption coefficient, light frequency, band gap energy and a constant, respectively).35 The band gap of the In2S3 powders was estimated to be 1.98 or 2.0 eV (inset of Fig. 2B) which was in agreement with the reported value of 2.0–2.3 eV.36
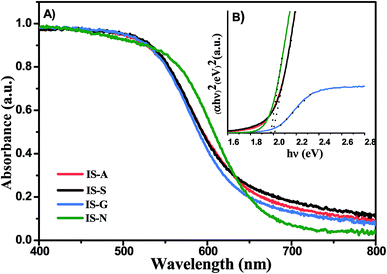 |
| | Fig. 2 (A) UV-vis diffuse reflectance spectra (DRS) and (B) band gap energies of samples: IS-A, IS-S, IS-G, IS-N. | |
3.1.3. FESEM and TEM analysis. To realize the morphological control effect of the amino acids, indium sulfide products synthesized without amino acid, but with aspartic acid, serine, glycine, respectively, were investigated by FESEM and TEM. As shown in Fig. 3, In2S3 particles are mainly composed of microspheres, and the diameters range from 4–8 μm. For the control experiment without addition of amino acid, the morphology of the product is microspheres with a rough surface consisting of uneven flakes, which are very loosely packed together (Fig. 3G and H). When amino acids are used as the additive (Fig. 3, parts of A–F), it can be seen that the In2S3 spheres are assembled with numerous nanoflakes which have a relatively broad thickness. In contrast to the In2S3 product synthesized without amino acid shown in Fig. 3, these products are a high-density structure, and the arrangement of flakes is more compact. The In2S3 particles synthesized with different kinds of amino acids exhibit various morphologies, and this may be explained by the absence of any other functional side group except the carboxyl and amino group. The morphology traits are further confirmed by the TEM image (Fig. 4A–E). TEM image (Fig. 4D) of the representative In2S3 particles synthesized without amino acids indicates that the nanoparticles exhibit a microsphere structure with anomalous surface. By contrast, the flower-like In2S3 sample synthesized with addition of glycine was selected as a typical structure (Fig. 4A). The magnified TEM image (Fig. 4B) confirmed that these microspheres were composed of thin flakelike structures. A set of lattice fringes with the interplane spacing of ca. 0.62 nm is present in the nanoparticles (Fig. 4C and E), which corresponds to the d value of (111) plane of tetragonal In2S3.
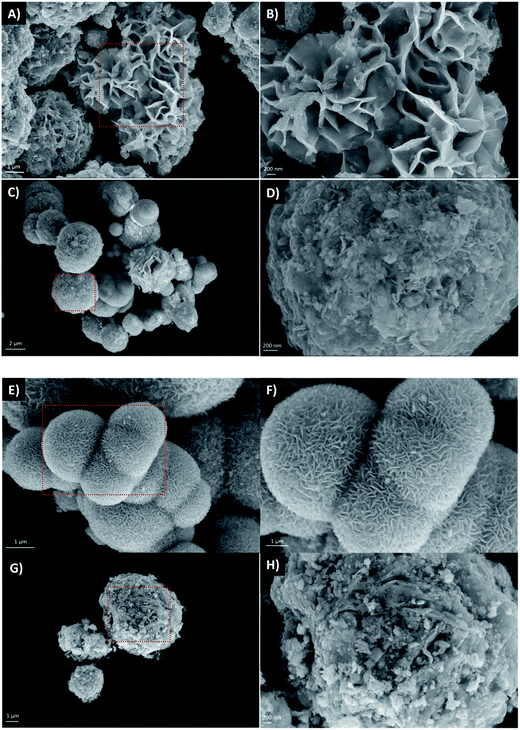 |
| | Fig. 3 FESEM images of In2S3: IS-A (A, B), IS-S (C, D), IS-G (E, F), IS-N (G, H). | |
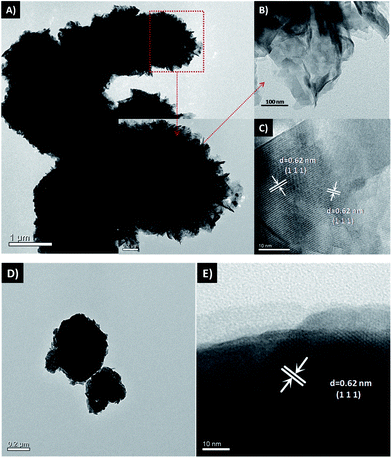 |
| | Fig. 4 (A, B) TEM and (C) HR-TEM images of IS-G, (D) TEM and (E) HR-TEM images of IS-N. | |
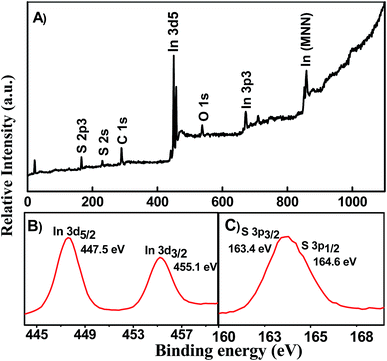
3.1.4. XPS analysis. To further confirm the surface chemical composition and valence states of the elements in In2S3, XPS measurements were carried out for the sample IS-G and IS-N as shown in Fig. 5. The fully scanned spectrum in Fig. 5A showed that the elements In, S, O, and C existed in the IS-G. All of the peaks are calibrated using C 1s (284.6 eV) as the reference. The peaks of C and O may come from adventitious hydrocarbon and the absorption of oxygen or carbon dioxide on the surface of the In2S3 nanoparticles. A typical high-resolution XPS spectrum of In 3d is shown in Fig. 5B. It can be seen that the spectrum containing peaks at 447.5 eV and 455.1 eV were related to In d5/2 and In 3d3/2, respectively. Fig. 5C shows the high-resolution S 2p spectrum of the sample, and the peaks at 163.4 eV and 164.6 eV are attributed to the binding energies of S 2p3/2 and S 2p1/2, respectively. The observed binding energy values are similar to the reported values for In2S3.37,38 The peak separations of In 3d and S 2p are calculated to be 7.6 eV and 1.2 eV, and the two peak area ratios of In 3d3/2 to In 3d5/2 and S 2p1/2 to S 2p3/2 are ca. 2![[thin space (1/6-em)]](https://www.rsc.org/images/entities/char_2009.gif) :3 and 1:2.8, respectively. These results indicate that the In and S are present as In3+ and S2−.39
:3 and 1:2.8, respectively. These results indicate that the In and S are present as In3+ and S2−.39
 |
| | Fig. 5 XPS survey spectra of sample IS-G: (A) survey spectrum, (B) In 3d, (C) S 2p. | |
3.1.5. BET analysis. The surface area and porosity of IS-G and IS-N have been investigated as shown in Fig. S1.† It can be seen that both of the two samples have adsorption–desorption isotherms of type IV isotherms according to the IUPAC classification,40 implying the presence of mesoporous structure. In addition, the isotherm with a broad hysteresis loops at relative pressure (P/P0) between 0.4 and 1.0 is corresponded to H3 hysteresis loop which is due to the nonrigid aggregate of layered structure.41 This is also confirmed by their pore size distribution which is not uniform ranging from 3.5 to 4.5 nm, as presented in the inset of Fig. S1.† And the pore volume of IS-G (0.191 cm3 g−1) is bigger than that of IS-N (0.141 cm3 g−1). Besides, the BET surface area of IS-G is determined to be 108.6 m2 g−1, significantly higher than that observed over IS-N (47.1 m2 g−1). Compared with IS-N, the higher BET surface area of IS-G can be attributed to the introduction of amino acids as a structure guide reagent. More surface active sites for the adsorption of reactant molecules provided by the large surface area would promote the photocatalytic process.
3.2. Evaluation of photocatalytic activity
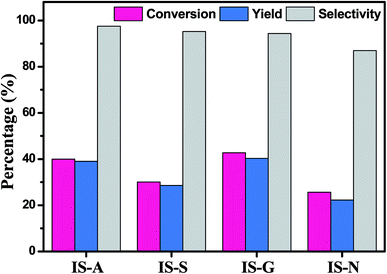
3.2.1. Selective oxidation of benzyl alcohol to benzaldehyde. The catalytic activity of the In2S3 samples are initially evaluated by the selective oxidation of benzyl alcohol (BA) to benzaldehyde (BAD) in benzotrifluoride (BTF) under visible light irradiation (λ > 420 nm). As shown in Fig. 6, the conversion rates of BA, the yields of BAD, and reaction selectivity over different photocatalyst samples are presented after visible light irradiation for 2 h. It can be seen that both BA conversion rate and BAD yield gradually improve with addition of amino acids, respectively. Particularly, the conversion rate of BA over IS-G is nearly 2 times higher than IS-N. As for the reaction selectivity from BA to BAD, it can be seen that In2S3 samples with addition of amino acids is nearly 100%.
 |
| | Fig. 6 Photocatalytic performance for selective oxidation of benzyl alcohol to benzaldehyde using In2S3 (IS-A, IS-S, IS-G, IS-N) samples under visible light irradiation for 2 h. | |
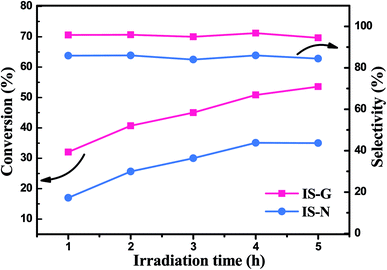
Furthermore, IS-G and IS-N were selected as representative photocatalysts, time-online profile has been shown in Fig. 7. On the whole, it can be clearly seen that the conversion of BA over IS-G and IS-N increases gradually with the extension of time and the former exhibit a better photocatalytic activity at each time point. Besides, the reactive selectivity of the IS-G is also slightly higher than IS-N (approximately maintained at 96 and 86%, respectively) in general.
 |
| | Fig. 7 Time-dependent profile for photocatalytic selective oxidation of benzyl alcohol to benzaldehyde over IS-G and IS-N under visible light irradiation. | |
3.2.2. Selective oxidation of different aromatic alcohols. In order to further confirm the higher photocatalytic selective oxidation activity of IS-G, the photocatalytic oxidation performance test of other aromatic alcohols to corresponding aldehydes was carried out under the same conditions as shown in Fig. 8. It can be clearly seen that the IS-G photocatalyst exhibits higher photocatalytic activities than IS-N for all testing reactions. Therefore, in a system, IS-G can indeed achieve the oxidation of aromatic alcohol in driving under visible light.
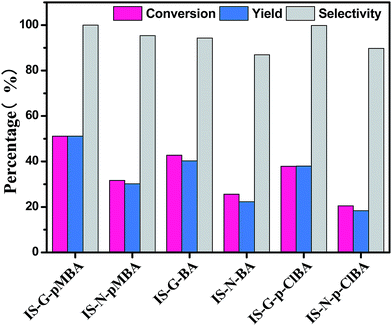 |
| | Fig. 8 Photocatalytic performance for selective oxidation of aromatic alcohols (pMBA: p-methoxybenzyl alcohol, BA: benzyl alcohol, ClBA: p-chlorobenzyl alcohol) to corresponding aldehydes using IS-G and IS-N composite under visible light irradiation for 2 h. | |
3.2.3. Photocatalytic stability of IS-G samples. The IS-G sample has high activity stability during the four successive recycling measurements toward photocatalytic selective oxidation of benzyl alcohol. As shown in Fig. S2,† after being used for five times, the photocatalytic activity of IS-G powder was almost unchanged. In addition, the XRD patterns of IS-G catalyst before and after photocatalytic reaction are shown in Fig. S3,† demonstrate that there is no influence on catalyst's bulk phase before and after photocatalytic reactions. In conclusion, the as-synthesized IS-G sample is a stable and efficient catalyst for selective oxidation of aromatic alcohols to corresponding aldehydes under visible light.
3.3. Proposed photocatalytic mechanism
3.3.1. Photoelectrochemical properties. To further investigate the origins of the higher photocatalytic performance of IS-G for selective oxidation of BA than that of the IS-N, a series of electrochemical analysis have been carried out. As shown in Fig. 9A, the photocurrent density obtained on IS-G electrode under intermittent simulated solar light irradiation is obviously higher than that of IS-N, which suggests the longer life span was achieved on the IS-G with higher surface area.42–44 At the same time, the photogenerated holes are taken up by the hole acceptor in the electrolyte.45 Thus, the improved lifetime of photogenerated electrons of IS-G can effectively lead to the enhanced photoactivity toward the oxidation of aromatic alcohols to corresponding aldehydes.46
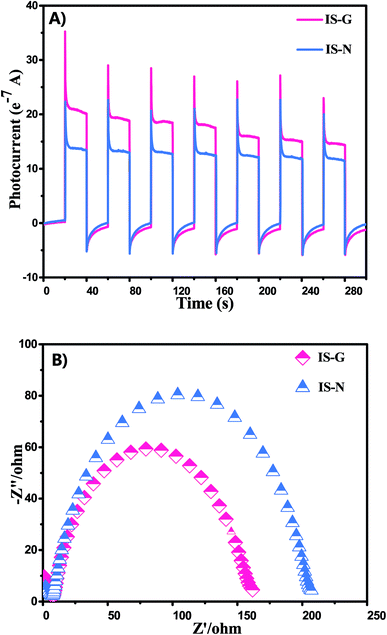 |
| | Fig. 9 (A) Photocurrent transient response of IS-G and IS-N electrodes in 0.1 M Na2SO4 solution without bias versus Ag/AgCl under visible light irradiation. (B) Nyquist impedance plots of IS-G and IS-N in 0.1 M KCl solution containing 0.1 M K3[Fe(CN)6]/K4[Fe(CN)6]. | |
In addition, electrochemical impedance spectroscopy (EIS) has been carried out to further investigate the migration of charge carriers in the electrode materials. Under the similar preparation of the electrodes and electrolyte, the high frequency arc corresponds to the charge transfer limiting process and can be attributed to the charge transfer resistance at the contact interface between the electrode and electrolyte solution.47,48 As shown in Fig. 9B, the IS-G electrode exhibits decreased arc at high frequency under visible light irradiation compared IS-N electrodes. It manifests that the more efficient transfer of charge carriers is obtained over IS-G than that of IS-N.
3.3.2. Role of reactive species. To further investigate the photocatalytic oxidation mechanism of BA to BAD, we perform a sequence of controlled experiments using different radical scavengers over IS-G under visible light irradiation. Here, isopropyl alcohol (IPA), p-benzoquinone (BQ), CCl4 (tetrachloromethane) and TEA (triethanolamine) are used as scavengers for trapping ˙OH radical species, ˙O2−, photogenerated electrons and holes, respectively.49 As displayed in Fig. 10, the conversion rate of BA is drastically decreased with the addition of BQ and CCl4, indicating that ˙O2− is an important role for BA oxidation. In the meantime, a similar slight reduction was observed with the introduction of TEA, which demonstrated that photogenerated holes also play a certain role in the oxidation of BA. However, the addition of IPA did not have any noticeable effect on the conversion of BA, demonstrating that ˙OH is not the reactive species in the oxidation of BA. Accordingly, we can infer that ˙O2− and h+ are the essential reactive species in the reaction system.
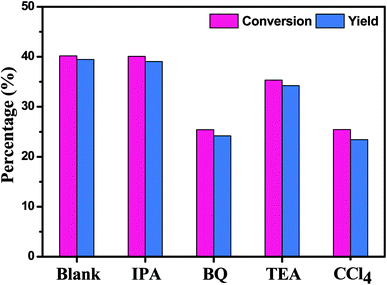 |
| | Fig. 10 Controlled experiments using different radical scavengers on the selective oxidation of benzyl alcohol after visible light irradiation for 2 h. | |
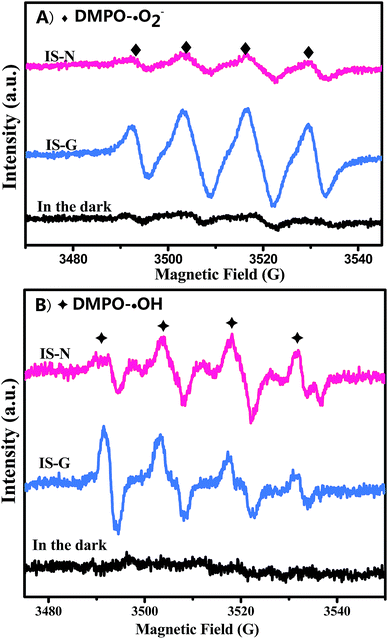
3.3.3. Validation of the reactive species. As shown in Fig. 11, the active radicals formed on the IS-G (as a representative of In2S3 samples synthesized with amino acids) were further determined and compared with that of the IS-N by ESR techniques using DMPO as a trapping reagent. The evolution of the trapped protonated ˙O2− (DMPO–˙O2−, labeled with  ) and ˙OH (DMPO–˙OH, labeled with
  ) signals with irradiation time are shown in Fig. 11A and B, respectively. The characteristic peaks of DMPO–˙O2− adducts50–52 and DMPO–˙OH adducts53 are detected both on IS-G and IS-N systems after visible irradiation for 140 s. The intensity of the formed superoxide radical species in IS-G sample is stronger than that of IS-N, which is in line with a higher photocatalytic performance of IS-G than IS-N on the selective oxidation of benzyl alcohol. Additionally, both of the intensities of the formed hydroxyl radical species in IS-G and IS-N are quite weak, which indicates that there is a slight amount of ˙OH produced in the reaction system. And this result coincides with the former controlled experiments.
 |
| | Fig. 11 ESR spectra of (A) DMPO–˙O2− and (B) DMPO–˙OH adducts formed with visible light (λ > 420 nm) in the suspension of IS-G and IS-N. | |
3.3.4. Redox potentials of the photocatalyst and the reactants. To further testify the above proposed mechanism, the band edge potentials of the semiconductors were estimated using the equation related to Mulliken electronegativity. Herein, the electronegativity of an atom is the arithmetic mean of the atomic electron affinity and the first ionization energy. The conduction band (CB) potential at the point of zero charge can be calculated according to an empirical equation:54where EVB is the valence band potential; ECB is the conduction band potential; X is the absolute electronegativity of the semiconductor; Ee is the energy of free electrons on the hydrogen scale (Ee = 4.5 eV). From the calculation, it is known that the absolute electronegativity of In2S3 is about 4.703 eV. Thus, the ECB and EVB of In2S3 are 0.80 eV and 1.20 eV, respectively. Obviously, the CB edge potential of In2S3 is more negative than the standard redox potentials of EΘ(−O2/˙O2−) (0.33 eV vs. NHE), so it is thermodynamically permissible for transformation of photogenerated electrons to the absorbed O2 to produce the superoxide radicals (˙O2−), which has been verified by the electron spin resonance (ESR) technique analysis before. And the photoexcited holes in the VB of In2S3 cannot directly oxidize BA to BAD or oxidized BAD because the VB potential of In2S3 is more negative than the standard redox potential of BA/BAD EΘ(BA/BAD) (1.98 V vs. NHE).55 Thus, a possible mechanism for selective oxidation of aromatic alcohols over the In2S3 powder can be proposed, as illustrated in Fig. 12. Under the visible light irradiation, the absorbed aromatic alcohol by the In2S3 sample with larger surface area interacts with photogenerated holes to form the corresponding radical cation under the visible light, which further reacts with superoxide radicals, leading to the formation of corresponding aldehydes.56–58
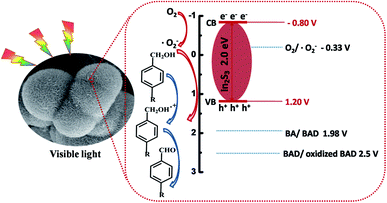 |
| | Fig. 12 A proposed schematic mechanism for photocatalytic selective oxidation of aromatic alcohol to corresponding aromatic aldehyde over the In2S3 sample under visible light irradiation. | |
3.3.5. Effect of morphology. To further explore the morphological control effect of the amino acids, syntheses with a greater variety of amino acids as the crystallization modifiers were also performed. XRD patterns are recorded to identify the purity, crystallinity and phase composition of the as-synthesized In2S3 samples in the presence of the rest of the three kinds of amino acids as displayed in Fig. S4.† No other peaks of impurities were found. FESEM images of In2S3 products synthesized with L-glutamic acid and tryptophan or L-cysteine, respectively, are displayed in Fig. S5,† and their morphologies are described in Table S1.† As shown in Fig. 3 and S5,† for the control experiment without addition of amino acid, the morphology of the product is microspheres with a rough surface consisting of uneven flakes, which are very loosely packed together. With the use of L-glutamic acid as the additive, the obtained In2S3 microspheres (4–5 μm) are consist of nanobricks, while the nanobricks are uniform and are tightly integrated. However, when tryptophan is used as the additive, flowerlike microspheres composed of thin flakelike structures were shown in Fig. S5C.† In addition, In2S3 microspheres with slippery surface could be obtained with the addition of L-cysteine. The results suggest that the formation of sphere structures made of nanoflakes or nanobricks could be related to the molecular conformation of the amino acid, even though they are of similar functional groups (Table S1†). Besides, the conversion rates for selective oxidation of benzyl alcohol to benzaldehyde with the as-synthesized In2S3 samples have all been improved. Furthermore, it has been reported that the hierarchical nanostructure not only provides a high surface area, but also favors multiple light scattering/reflection, resulting in improved photocatalytic activity.59–61 And as far as we know, amino acid as a crystal growth modifier has been conducted in an enormous amount of research in recent years. Chen et al.62,63 synthesized a three-dimensional (3D) flower-like β-In2S3 by hydrothermal methods using indium chloride and L-cys as starting materials. They found that solution pH, In3+ to L-cys molar ratio, and reaction temperature play important roles in the entire process. Chang et al.64,65 synthesized layered MoS2/graphene composites and two-dimensional SnS2/SnO2 nanoplates via an L-cys-assisted method. And these layered structural compounds could extensively improve the cycling behavior of the nanoplates in LIBs (lithium ion batteries). However, how the amino acids with different functionalities and structural conformation influence the crystal growth still needs further study. Kang et al.66 demonstrated that amino acids was used as directing agents to synthesize hierarchical silver microspheres assembled by nanosheets with well-defined morphologies, in the absence of any other surfactants or capping agents. He et al.67 synthesized different tellurium nanostructures by a facile hydrothermal approach with addition of different kinds of amino acids. In conclusion, amino acids with different functionalities and structural conformation have been used as good crystal growth modifiers for controlled growth of In2S3 crystals by a solvothermal approach. And this method would be expected to be a general way to fabricate mesoporous metal sulfides with hierarchical nanoarchitectures, which may be used as an important means to improve the photocatalytic activity with their unique morphologies.
4. Conclusions
In conclusion, amino acids with different functionalities and structural conformation have been used as good crystal growth modifiers for controlled growth of indium sulfide particles by a solvothermal approach. Compared with In2S3 synthesized without amino acids, the flower-like IS-G photocatalyst with nanosheets exhibits better photocatalytic activity toward the selective oxidation of aromatic alcohols to aromatic aldehydes under light irradiation. The highly selective photoactivity is attributed to its big surface area and pore volume, morphology, and highly effective separation of photogenerated charge carriers. According to the results of radical scavenger experiments, the reactive holes and superoxide radicals were suggested to play a critical role in the selective oxidation system. Moreover, the facile solvothermal approach by the introduction of amino acid with a suitable combination of functional groups, such as –NH2 and –COOH, presents a means of achieving well-ordered nanomaterials in a cost-effective and scalable manner.
Acknowledgements
This study was supported by the Natural Science Foundation of China (NSFC, grant No. 51472005, 51272081, 51172086, 21603002 and 21473066) and the Natural Science Foundation of Anhui Province (Grant No. 1608085QB37 and 1408085QB38).
References
- P. L. Anelli, C. Biffi, F. Montanari and S. Quici, J. Org. Chem., 1987, 52, 2559–2562 CrossRef.
- S. Velusamy and T. Punniyamurthy, Org. Lett., 2004, 6, 217–219 CrossRef CAS PubMed.
- R. V. Jagadeesh, H. Junge, M. M. Pohl, J. Radnik, A. Brückner and M. Beller, J. Am. Chem. Soc., 2013, 135, 10776–10782 CrossRef CAS PubMed.
- X. H. Li, X. C. Wang and M. Antonietti, ACS Catal., 2012, 2, 2082–2086 CrossRef CAS.
- D. I. Enache, J. K. Edwards, P. Landon, B. S. Espriu, A. F. Carley, A. A. Herzing, M. Watanabe, C. J. Kiely, D. W. Knight and G. J. Hutchings, Science, 2006, 311, 362–365 CrossRef CAS PubMed.
- A. Tanaka, K. Hashimoto and H. Kominami, J. Am. Chem. Soc., 2012, 134, 14526–14533 CrossRef CAS PubMed.
- E. Fritz-Langhals, Org. Process Res. Dev., 2005, 9, 577–582 CrossRef CAS.
- N. Jiang and A. J. Ragauskas, J. Org. Chem., 2007, 72, 7030–7033 CrossRef CAS PubMed.
- F. Arena, B. Gumina, A. F. Lombardo, C. Espro, A. Patti, L. Spadaro and L. Spiccia, Appl. Catal., B, 2015, 162, 260–267 CrossRef CAS.
- R. V. Jagadeesh, H. Junge, M. M. Pohl, J. Radnik, A. Brückner and M. Beller, J. Am. Chem. Soc., 2013, 135, 10776–10782 CrossRef CAS PubMed.
- X. H. Li, X. C. Wang and M. Antonietti, ACS Catal., 2012, 2, 2082–2086 CrossRef CAS.
- F. Arena, B. Gumina, A. F. Lombardo, C. Espro, A. Patti, L. Spadaro and L. Spiccia, Appl. Catal., B, 2015, 162, 260–267 CrossRef CAS.
- X. L. Fu, X. X. Wang, Z. X. Chen, Z. Z. Zhang, Z. H. Li, D. Y. C. Leung, L. Wu and X. Z. Fu, Appl. Catal., B, 2010, 95, 393–399 CrossRef CAS.
- Y. H. He, D. Z. Li, G. C. Xiao, W. Chen, Y. B. Chen, M. Sun, H. J. Huang and X. Z. Fu, J. Phys. Chem. C, 2009, 113, 5254–5262 CAS.
- C. Herzog, A. Belaidi, A. Ogacho and T. Dittrich, Energy Environ. Sci., 2009, 2, 962–964 CAS.
- R. Lucena, F. Fresno and J. C. Conesa, Catal. Commun., 2012, 20, 1–5 CrossRef CAS.
- X. Z. Li, B. Weng, N. Zhang and Y. J. Xu, RSC Adv., 2014, 4, 64484–64493 RSC.
- H. J. Liang, T. E. Angelini, J. Ho, P. V. Braun and G. C. L. Wong, J. Am. Chem. Soc., 2003, 125, 11786–11787 CrossRef CAS PubMed.
- C. Mao, D. J. Solis, B. D. Reiss, S. T. Kottmann, R. Y. Sweeney, A. Hayhurst, G. Georgiou, B. Iverson and A. M. Belcher, Science, 2004, 303, 213–217 CrossRef CAS PubMed.
- J. L. Zhang, J. M. Du, B. X. Han, Z. M. Liu, T. Jiang and Z. F. Zhang, Angew. Chem., 2006, 45, 1116–1119 CrossRef CAS PubMed.
- A. D. Pomogailo and G. I. Dzhardimalieva, Nanostructured Materials Preparation via Condensation Ways, Springer, 2014, pp. 389–447 Search PubMed.
- Z. Schnepp, Angew. Chem., Int. Ed., 2013, 52, 1096–1108 CrossRef CAS PubMed.
- J. H. Xiang, H. Q. Cao, Q. Z. Wu, S. C. Zhang, X. R. Zhang and A. A. R. Watt, J. Phys. Chem. C, 2008, 112, 3580–3584 CAS.
- B. Zhang, X. C. Ye, W. Y. Hou, Y. Zhao and Y. Xie, J. Phys. Chem. B, 2006, 110, 8978–8985 CrossRef CAS PubMed.
- K. Chang and W. X. Chen, ACS Nano, 2011, 6, 4720–4728 CrossRef PubMed.
- G. J. Zhang, Z. R. Shen, M. Liu, C. H. Guo, P. C. Sun, Z. Y. Yuan, B. H. Li, D. T. Ding and T. H. Chen, J. Phys. Chem. B, 2006, 110, 25782–25790 CrossRef CAS PubMed.
- Z. B. He, S. H. Yu and J. P. Zhu, Chem. Mater., 2005, 17, 2785–2788 CrossRef CAS.
- Q. Z. Wu, H. Q. Cao, Q. Y. Luan, J. Y. Zhang, Z. Wang, J. H. Warner and A. A. R. Watt, Inorg. Chem., 2008, 47, 5882–5888 CrossRef CAS PubMed.
- Q. Z. Wu, H. Q. Cao, Q. Y. Luan, J. Y. Zhang, Z. Wang, J. H. Warner and A. A. R. Watt, Inorg. Chem., 2008, 47, 5882–5888 CrossRef CAS PubMed.
- E. R. Goldman, I. L. Medintz, A. Hayhurst, G. P. Anderson, J. M. Mauro, B. L. Iverson, G. Georgiou and H. Mattoussi, Anal. Chim. Acta, 2005, 534, 63–67 CrossRef CAS.
- F. Jones, M. Mocerino, M. I. Ogden, A. Oliveira and G. M. Parkinson, Cryst. Growth Des., 2005, 5, 2336–2343 CAS.
- C. A. Orme, A. Noy, A. Wierzbicki, M. T. McBride, M. Grantham, H. H. Teng, P. M. Dove and J. J. DeYoreo, Nature, 2001, 411, 775–779 CrossRef CAS PubMed.
- Z. B. He, S. H. Yu and J. P. Zhu, Chem. Mater., 2005, 17, 2785–2788 CrossRef CAS.
- J. Xu, L. Luo, G. Xiao, Z. Zhang, H. Lin, X. Wang and J. Long, ACS Catal., 2014, 4, 3302–3306 CrossRef CAS.
- S. Sakthivel and H. Kisch, Angew. Chem., Int. Ed., 2003, 42, 4908–4911 CrossRef CAS PubMed.
- K. H. Park, K. Jang and S. U. Son, Angew. Chem., Int. Ed., 2006, 45, 4608–4612 CrossRef CAS PubMed.
- S. Rengaraj, S. Venkataraj, C. W. Tai, Y. Kim, E. Repo and M. Sillanpaa, Langmuir, 2011, 27, 5534–5541 CrossRef CAS PubMed.
- J. Shen, B. Yan, M. Shi, H. Ma, N. Li and M. Ye, J. Mater. Chem., 2011, 21, 3415–3421 RSC.
- W. W. Gao, W. X. Liu, Y. H. Leng, X. W. Wang, X. Q. Wang, B. Hu, D. H. Yu, Y. H. Sang and H. Liu, Appl. Catal., B, 2015, 176, 83–90 CrossRef.
- K. S. W. Sing, D. H. Everett, R. A. W. Haul, L. Moscou, R. A. Pierotti, J. Rouquérol and T. Siemieniewska, Pure Appl. Chem., 1985, 57, 603–619 CrossRef CAS.
- L. Nie, A. Meng, J. Yu and M. Jaroniec, Sci. Rep., 2013, 3, 3215 Search PubMed.
- T. Gao, Q. Li and H. T. H. Wang, Chem. Mater., 2005, 17, 887–892 CrossRef CAS.
- J. Feng, Z. F. Wang, B. Shen, L. M. Zhang, X. Yang and N. Y. He, RSC Adv., 2014, 4, 28683–28690 RSC.
- Y. Liu, P. Zhang, B. Z. Tian and J. L. Zhang, ACS Appl. Mater. Interfaces, 2015, 25, 13849–13858 Search PubMed.
- N. Zhang, S. Q. Liu, X. Z. Fu and Y. J. Xu, J. Mater. Chem., 2012, 22, 5042–5052 RSC.
- Z. R. Tang, Y. H. Zhang and Y. J. Xu, ACS Appl. Mater. Interfaces, 2012, 4, 1512–1520 CAS.
- N. Zhang, Y. Zhang, X. Pan, X. Fu, S. Liu and Y.-J. Xu, J. Phys. Chem. C, 2011, 115, 23501–23511 CAS.
- S. Liu, Z. Chen, N. Zhang, Z. R. Tang and Y. J. Xu, J. Phys. Chem. C, 2013, 117, 8251–8261 CAS.
- L. Q. Ye, J. Y. Liu, C. Q. Gong, L. H. Tian, T. Y. Peng and L. Zan, ACS Catal., 2012, 2, 1677–1683 CrossRef CAS.
- V. Brezova, P. Tarabek, D. Dvoranova, A. Stasko and S. Biskupic, J. Photochem. Photobiol., A, 2003, 155, 179–198 CrossRef CAS.
- F. Chen, Y. Xie, J. He and J. Zhao, J. Photochem. Photobiol., A, 2001, 138, 139–146 CrossRef CAS.
- C. Chen, W. Ma and J. Zhao, Chem. Soc. Rev., 2010, 39, 4206–4219 RSC.
- Y. Li, B. Wen, C. Yu, C. Chen, H. Ji, W. Ma and J. Zhao, Chem.–Eur. J., 2012, 18, 2030–2039 CrossRef CAS PubMed.
- Z. W. Mei, S. X. Ouyang, D. M. Tang, T. Kako, D. Golbergc and J. H. Ye, Dalton Trans., 2013, 42, 2687–2690 RSC.
- X. Y. Xiao, J. Jiang and L. Z. Zhang, Appl. Catal., B, 2013, 142, 487–493 CrossRef.
- N. Zhang, X. Z. Fu and Y. J. Xu, J. Mater. Chem., 2011, 21, 8152–8158 RSC.
- N. Zhang, S. Q. Liu, X. Z. Fu and Y. J. Xu, J. Mater. Chem., 2012, 22, 5042–5052 RSC.
- Y. H. Zhang, N. Zhang, Z. R. Tang and Y. J. Xu, Chem. Sci., 2012, 3, 2812–2822 RSC.
- T. Y. Zhao, Z. Y. Liu, K. Nakata, S. Nishimoto, T. Murakami, Y. Zhao, L. Jiang and A. Fujishima, J. Mater. Chem., 2010, 20, 5095–5099 RSC.
- B. Z. Fang, Y. L. Xing, A. Bonakdarpour, S. C. Zhang and D. P. Wilkinson, ACS Sustainable Chem. Eng., 2015, 5, 2381–2388 CrossRef.
- B. Z. Fang, A. Bonakdarpour, K. Reilly, Y. L. Xing, F. Taghipour and D. P. Wilkinson, ACS Appl. Mater. Interfaces, 2014, 6, 15488–15498 CAS.
- L. Y. Chen and Z. D. Zhang, J. Phys. Chem. C, 2008, 112, 18798–18803 CAS.
- L. Y. Chen, Y. G. Zhang, W. Z. Wang and Z. D. Zhang, Eur. J. Inorg. Chem., 2008, 9, 1445–1451 CrossRef.
- K. Chang and W. X. Chen, ACS Nano, 2011, 5, 4720–4728 CrossRef CAS PubMed.
- K. Chang, W. X. Chen and H. Li, Electrochim. Acta, 2011, 56, 2856–2861 CrossRef CAS.
- L. L. Kang, P. Xu, D. T. Chen, B. Zhang, Y. C. Du, X. J. Han, Q. Li and H. L. Wang, J. Phys. Chem. C, 2013, 19, 10007–10012 Search PubMed.
- Z. B. He, S. H. Yu and J. P. Zhu, Chem. Mater., 2005, 11, 2785–2788 CrossRef.
Footnote |
| † Electronic supplementary information (ESI) available. See DOI: 10.1039/c6ra28560k |
|
| This journal is © The Royal Society of Chemistry 2017 |
Click here to see how this site uses Cookies. View our privacy policy here. 
 Open Access Article
 This Open Access Article is licensed under a
  *a,
Xiangju Ye*b,
Xianliang Fu
*a,
Xiangju Ye*b,
Xianliang Fu


 ) and ˙OH (DMPO–˙OH, labeled with
  ) signals with irradiation time are shown in Fig. 11A and B, respectively. The characteristic peaks of DMPO–˙O2− adducts50–52 and DMPO–˙OH adducts53 are detected both on IS-G and IS-N systems after visible irradiation for 140 s. The intensity of the formed superoxide radical species in IS-G sample is stronger than that of IS-N, which is in line with a higher photocatalytic performance of IS-G than IS-N on the selective oxidation of benzyl alcohol. Additionally, both of the intensities of the formed hydroxyl radical species in IS-G and IS-N are quite weak, which indicates that there is a slight amount of ˙OH produced in the reaction system. And this result coincides with the former controlled experiments.

