 Open Access Article
Creative Commons Attribution 3.0 Unported Licence
Optical thermometry based on thermal population of low-lying levels of Eu3+ in Ca2.94Eu0.04Sc2Si3O12
Lu Zhao,
Jiajia Cai,
Fangfang Hu,
Xinyue Li,
Zhongmin Cao,
Xiantao Wei,
Yonghu Chen,
Min Yin * and
Chang-Kui Duan*
Key Laboratory of Strongly Coupled Quantum Matter Physics, Chinese Academy of Sciences, School of Physical Sciences, University of Science and Technology of China, No. 96 Jinzhai Road, Hefei, Anhui Province 230026, P. R. China. E-mail: yinmin@ustc.edu.cn; ckduan@ustc.edu.cn
First published on 23rd January 2017
Abstract
Non-contact optical thermometry using rare-earth materials has attracted a lot of attention due to its realization of non-invasive and real-time temperature determination. In the current work, a new mechanism, differing from the conventional approach utilizing the ratio of intensities emitted from two thermally coupled excited levels, was developed and demonstrated for temperature sensing using Eu3+-doped Ca3Sc2Si3O12 (CSSO). Under the excitation of 610.6 nm-wavelength light, Eu3+ ions at the 7F2 multiplet became excited to the 5D0 state, and then the luminescence intensity originating from the 5D0 state increased significantly as the temperature was increased from 123 K to 273 K. The thermoequilibrium of the 7F2 multiplet with the 7F0 ground state at a weak excitation ensured a steady increase of the luminescence intensity I with temperature T, which well fit the equation I = A![[thin space (1/6-em)]](https://www.rsc.org/images/entities/char_2009.gif) exp
exp![[thin space (1/6-em)]](https://www.rsc.org/images/entities/char_2009.gif) (−B/T) for the transitions to both 7F1 and 7F4 multiplets. A relative sensitivity SR of 1008/T2 was obtained for the 7F1 case, with a value of 1.35% at 273 K. This scheme, as a result of detecting the blue-shifted emission, has the advantages of being less disturbed by stray light from the host and the object of the thermometry. In addition, the high quantum efficiency of a one-photon excited photoluminescence scheme has the advantage of improving the resolution of the thermometry. Furthermore, a near-infrared broadband emission observed in the sample can be adopted as a reference, so as to transform the scheme into one using a luminescence intensity ratio. These results indicated that CSSO:Eu3+ may be used in practical temperature sensing applications.
(−B/T) for the transitions to both 7F1 and 7F4 multiplets. A relative sensitivity SR of 1008/T2 was obtained for the 7F1 case, with a value of 1.35% at 273 K. This scheme, as a result of detecting the blue-shifted emission, has the advantages of being less disturbed by stray light from the host and the object of the thermometry. In addition, the high quantum efficiency of a one-photon excited photoluminescence scheme has the advantage of improving the resolution of the thermometry. Furthermore, a near-infrared broadband emission observed in the sample can be adopted as a reference, so as to transform the scheme into one using a luminescence intensity ratio. These results indicated that CSSO:Eu3+ may be used in practical temperature sensing applications.
1. Introduction
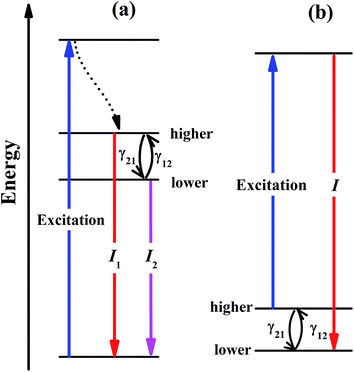
Temperature-dependent luminescence properties of materials based on rare earth elements have been widely studied for their applications in non-contact optical thermometry.1–4 Many of these investigations have focused on the fluorescence intensity ratio (FIR) of two thermally coupled excited energy levels (TCEELs) of rare earth ions such as Pr3+,5 Nd3+,6,7 Gd3+,8 Dy3+,9,10 Ho3+,11,12 Er3+,13–18 and Tm3+,19 and have frequently involved up-conversion (UC) luminescence.6,8,11–16,19 In particular, the FIR technique based on TCEELs has the advantage of requiring few measurements since it is not susceptible to fluctuations of excitation power. However, these FIR schemes suffer from the loss of thermal coupling at low temperatures, causing a deviation of the luminescence intensity ratio from that predicted by the Boltzmann distribution law. As a result, the energy difference between the two levels is usually restrained to be in the range of 200–2000 cm−1.20 The mechanism for the transitions involved in the FIR method based on TCEELs is plotted in Fig. 1(a). First, according to this mechanism, the rare earth ions populating the ground state get excited to a high-energy state. Then the ions relax to the two TCEELs to reach a transient thermoequilibrium before decaying to other energy levels if both the relaxation rate γ21 and the thermal excitation rate γ12 are much faster than the overall decay of the population in the two levels. In such a case, the population of these two TCEELs is governed by the Boltzmann distribution law, so that the FIR satisfies the equation
 | (1) |
 | (2) |
The UC process is usually used in FIR-based techniques for various applications, and one of its advantages is that it is less disturbed than are other processes by stray scattered light, which is usually Stokes type, i.e., red-shifted, and hence is not in the detection wavelength region. However, as the quantum efficiency of UC (defined as the ratio of the number of upconverted photons to that of the incident photons) is usually very low (up to about 1%) under weak to medium excitation strengths suitable for optical thermometry,16,22 there is a trade-off between achieving high temperature accuracy and increasing the signal-to-noise ratio: reducing the heating effect of the laser requires decreasing the incident (usually infrared) laser power, while increasing the signal-to-noise ratio requires increasing the laser power. Some other schemes based on spectral shift,23–25 absolute intensity26–28 and luminescence decay lifetime29–31 have also been explored. Also note that almost all of these techniques suffer from the drawback that only a small portion of the emitted light is in the wavelength range of detection.
In this work, we considered a different optical thermometry mechanism, one involving the temperature dependence of the thermal population of low-lying levels just above the ground level, as plotted in Fig. 1(b). The population of these low-lying levels follows the Boltzmann law, as long as the excitation is not strong enough to substantially disturb the population. The population of the higher level in Fig. 1(b) increases with temperature, so that after the excitation by a laser pulse, the population transferred to the luminescent level increases with temperature, the luminescence intensity of which can then be calibrated to the sensing temperature. In contrast to the mechanism in Fig. 1(a), the thermal coupling in Fig. 1(b) can be retained at low temperatures as long as the excitation is not too strong.
In our previous work,32 we resonantly excited Eu3+ ions in Y2O3 from 7F2 to 5D0 and then detected the 5D0 → 7F4 emission intensity to calibrate the temperature. However, the 5D0 luminescence of Y2O3:Eu3+ was overwhelmingly dominated by the transition to the 7F2 multiplet that overlapped with the excitation wavelength, so only a tiny portion of the 5D0 emission, which amounted to about 1% of the total emission intensity, was used.
In order to avoid the above disadvantage, we developed in the current work a new temperature sensing scheme with Eu3+-doped Ca3Sc2Si3O12 (CSSO:Eu3+) as a model system. The Eu3+ ion dopant was found to substitute for the Ca2+ ion in a dodecahedral site with D2 symmetry,33,34 which could roughly be modeled as D4d when only considering the nearest coordinating O2− ions. As 5D0 → 7F2 is strictly forbidden by D4d point group selection rules, Eu3+ ions in this host actually produced an intense luminescence of 5D0 → 7F1 and 5D0 → 7F4 relative to that of 5D0 → 7F2, much different than that of Eu3+ ions in Y2O3, where 5D0 → 7F2 luminescence dominated the emission. Hence, determining the emission intensity of either the 5D0 → 7F1 or 5D0 → 7F4 transition or the total of the two is expected to realize temperature sensing with all of the advantages mentioned above.
2. Experimental procedure
Powder samples of the garnet CSSO doped with Eu3+ ions were prepared by carrying out a solid state reaction at a high temperature. High-purity CaCO3, SiO2, Sc2O3 and Eu2O3 in a stoichiometric ratio were thoroughly mixed and pressed into a pellet to form Ca2.94Eu0.04Sc2Si3O12 samples. The samples were subjected to three heat treatments at 1450 °C for 3 h in an air atmosphere with intermediate grindings.33The as-prepared phosphors were characterized by using an X-ray diffractometer (MAC Science Co., Ltd, MXP18AHF, Tokyo, Japan) with nickel-filtered Cu Kα radiation (λ = 0.15418 nm), and with the accelerating voltage and tube current being 40 kV and 100 mA, respectively. The photoluminescence excitation spectrum and the temperature dependence of the emission spectrum were investigated by using a double monochromator (Model Jobin-Yvon HRD-1) equipped with a Hamamatsu R928 photomultiplier. The excitation source was a tunable laser system (Model Opolette 355 LD OPO system) with a pulse duration of 7 ns. The decay curves were recorded using a Tektronix TDS2024 digital storage oscilloscope. For the measurements at low temperature, the powder sample was pressed into a round tablet with a thickness of 0.8 mm and diameter of 8.0 mm. And then the tablet was glued to a copper pedestal fixed in a closed-cycle cryostat with cryogenic glue. The temperature of the sample was controlled by the attached copper pedestal, whose temperature was in turn controlled to be in the range 150–300 K by using a WC50 helium compressor and a Lake Shore Model 321 temperature controller.
3. Results and discussion
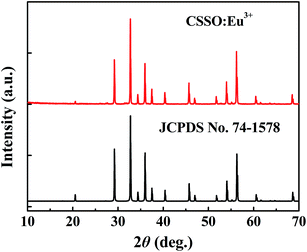
The crystal structure was identified according to the XRD pattern in Fig. 2. All of the diffraction peaks of the sample were found to match well with the standard CSSO (JCPDS no. 74-1578), and no obvious additional peaks of other phases were found, indicating that Eu3+ ions entered the host.Fig. 3 shows the excitation spectrum monitoring the 611 nm-wavelength emission and the emission spectrum under 355 nm-wavelength excitation of CSSO:Eu3+ acquired at room temperature. Unlike Eu3+ ions in many other hosts where the 5D0 → 7F1 and 5D0 → 7F4 transitions have been shown to be much weaker than the 5D0 → 7F2 transition, the Eu3+ ions in CSSO produced very strong 5D0 → 7F1 and 5D0 → 7F4 transitions, comparable to that of 5D0 → 7F2, as a result of Eu3+ replacing Ca2+ in the site with an approximate D4d local symmetry. The emission spectrum showed a 5D0 → 7F2 transition peak at a wavelength of 610.6 nm.
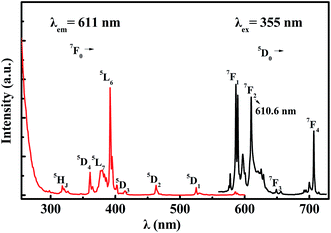 | ||
| Fig. 3 Excitation spectrum (red curve) and emission spectrum (black curve) of Eu3+ in CSSO at room temperature. | ||
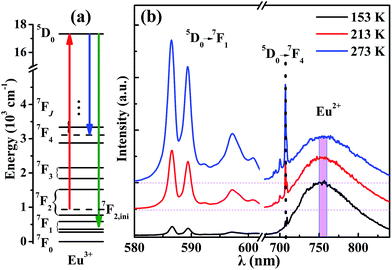
The mechanism of the temperature-sensing scheme is depicted in Fig. 4(a). Initially, the Eu3+ ions populated at a 7F2 Stark level (denoted as 7F2,ini). According to the Boltzmann distribution law, the temperature-dependent population of the 7F2,ini Stark level is given by
 | (3) |
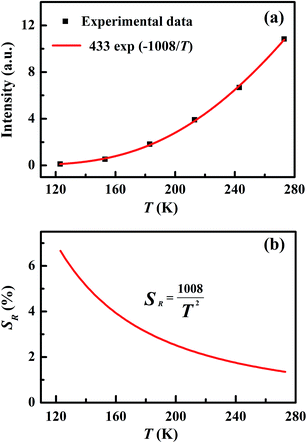
In order to depict this temperature-dependent variation quantitatively, the integrated intensities from 580 nm to 602 nm at various temperatures were calculated, as shown in Fig. 5(a). The filled black rectangles are the experimental data, which well fit the Arrhenius formula I = A![[thin space (1/6-em)]](https://www.rsc.org/images/entities/char_2009.gif) exp(−B/T) with B = 1008 K, as shown by the red solid curve in Fig. 5(a). From this curve, we obtained the relative sensitivity SR = I−1dI/dT = BT−2, which is plotted in Fig. 5(b). It should noted that the constant B was determined to have a value of 1008 K, corresponding to an effective energy difference ΔEeff of 700 cm−1, much smaller than the 910 cm−1 ΔEreal energy difference between 7F2 and 7F0 obtained from the emission spectrum. The error δ is defined as2 δ = |ΔEreal − ΔEeff|/ΔEreal, which was calculated to be 23% in the case of CSSO:Eu3+. The error δ is a key parameter which reflects how much the effective energy difference ΔEeff deviates from the real energy difference ΔEreal. The value of δ we found resulted from the variation of the population of 7F2, because the positions of the energy levels of Eu3+ changed with temperature. Some other factors such as absorption efficiency and luminescence quantum efficiency may have also changed with temperature, but are beyond the scope of our discussion.
exp(−B/T) with B = 1008 K, as shown by the red solid curve in Fig. 5(a). From this curve, we obtained the relative sensitivity SR = I−1dI/dT = BT−2, which is plotted in Fig. 5(b). It should noted that the constant B was determined to have a value of 1008 K, corresponding to an effective energy difference ΔEeff of 700 cm−1, much smaller than the 910 cm−1 ΔEreal energy difference between 7F2 and 7F0 obtained from the emission spectrum. The error δ is defined as2 δ = |ΔEreal − ΔEeff|/ΔEreal, which was calculated to be 23% in the case of CSSO:Eu3+. The error δ is a key parameter which reflects how much the effective energy difference ΔEeff deviates from the real energy difference ΔEreal. The value of δ we found resulted from the variation of the population of 7F2, because the positions of the energy levels of Eu3+ changed with temperature. Some other factors such as absorption efficiency and luminescence quantum efficiency may have also changed with temperature, but are beyond the scope of our discussion.
Measuring the broadband luminescence in the near-infrared region may serve as another way to calibrate temperature. Fig. 6(a) shows the FIR of the integrated fluorescence intensity of 5D0 → 7F1 of Eu3+ with respect to that of Eu2+. The integration interval of the former was carried out from 580 nm to 602 nm, and of Eu2+ from 750 nm to 760 nm (see Fig. 4(b)). The inset of Fig. 6(a) shows the dependence of the corresponding relative sensitivity on temperature.
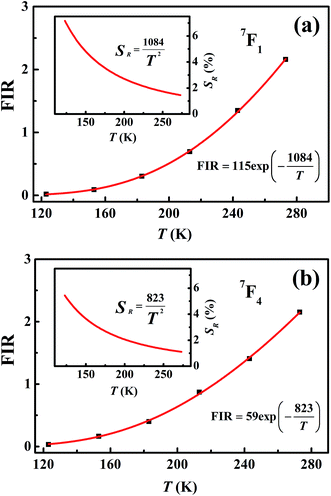 | ||
| Fig. 6 (a) Temperature-dependent FIR and relative sensitivity of 7F1. (b) Temperature-dependent FIR and relative sensitivity of 7F4. | ||
The same treatment for 7F4 as that for 7F1 is shown in the plot in Fig. 6(b), except that Fig. 6(a) shows the ratio of integrated fluorescence intensities while Fig. 6(b) shows the ratio of peak heights instead. The luminescence of 7F4 and Eu2+ overlap around 707 nm and the peak height for 7F4 was determined by the whole peak height of 7F4 and Eu2+ at 707 nm subtracting the peak height for Eu2+ at 707 nm whose value is easy to evaluate from the shape of the broadband. The peak height for Eu2+ was given by the average value of the intensity for Eu2+ between wavelengths of 750 nm and 760 nm (Fig. 4(b)). The advantage of using the fluorescence intensity ratio over the absolute fluorescence intensity lies in that the former corrects for fluctuations of the excitation light, and for changes in the environment and the measurement conditions.
4. Conclusions
In conclusion, an optical thermometry mechanism using the thermal population of Eu3+ ions in low-lying levels was demonstrated with CSSO:Eu3+. Under excitation with 610.6 nm-wavelength light, the CSSO:Eu3+ material showed excellent fluorescence properties and temperature-dependent luminescence properties for temperature sensing with a relative sensitivity of 1008/T2. The wavelength of the emitted light was shorter than that of the excitation light, and such a blue shift was able to reduce errors caused by stray light. The thermal equilibrium between the ground state 7F0 and 7F2 was naturally guaranteed even at low temperatures, so CSSO:Eu3+ was suitable for temperature sensing below room temperature. Furthermore, a broadband emission was observed at a wavelength of about 750 nm, which was attributed to the luminescence of Eu2+ trace impurities, and can be chosen as a reference. Calculating the FIR between 5D0 → 7F1 of Eu3+ and Eu2+ can serve as another way of sensing temperature, and benefits from the advantages of FIR techniques. The experimental data can be fitted using the formula I = A![[thin space (1/6-em)]](https://www.rsc.org/images/entities/char_2009.gif) exp(−B/T) for the emissions to both 7F1 and 7F4 multiplets, and a relative sensitivity SR of 1008/T2 was obtained for the 7F1 case, with a value of 1.35% at 273 K.
exp(−B/T) for the emissions to both 7F1 and 7F4 multiplets, and a relative sensitivity SR of 1008/T2 was obtained for the 7F1 case, with a value of 1.35% at 273 K.
Acknowledgements
This work was financially supported by the National Key Research and Development Program of China (Grant No. 2016YFB0701001); National Key Basic Research Program of China (Grant No. 2013CB921800) and the National Natural Science Foundation of China (Grant No. 11604037, 11374291, 11574298 and 11404321).References
- D. Jaque and F. Vetrone, Nanoscale, 2012, 4, 4301–4326 RSC.
- X. Wang, Q. Liu, Y. Bu, C. Liu, T. Liu and X. Yan, RSC Adv., 2015, 5, 86219–86236 RSC.
- C. D. S. Brites, P. P. Lima, N. J. O. Silva, A. Millán, V. S. Amaral, F. Palacio and L. D. Carlos, Nanoscale, 2012, 4, 4799–4829 RSC.
- X. Wang, R. J. Meier, M. Schäferling, S. Bange, J. M. Lupton, M. Sperber, J. Wegener, V. Ondrus, U. Beifuss, U. Henne, C. Klein and O. S. Wolfbeis, Adv. Opt. Mater., 2016, 4, 1854–1859 CrossRef CAS.
- W. Tang, S. Wang, Z. Li, Y. Sun, L. Zheng, R. Zhang, B. Yang, W. Cao and M. Yu, Appl. Phys. Lett., 2016, 108, 061902 CrossRef.
- W. Xu, Q. Song, L. Zheng, Z. Zhang and W. Cao, Opt. Lett., 2014, 39, 4635–4638 CrossRef CAS PubMed.
- X. Tian, X. Wei, Y. Chen, C. Duan and M. Yin, Opt. Express, 2014, 22, 30333–30345 CrossRef PubMed.
- K. Zheng, Z. Liu, C. Lv and W. Qin, J. Mater. Chem. C, 2013, 1, 5502–5507 RSC.
- Z. Boruc, M. Kaczkan, B. Fetlinski, S. Turczynski and M. Malinowski, Opt. Lett., 2012, 37, 5214–5216 CrossRef CAS PubMed.
- Y. Y. Bu, S. J. Cheng, X. F. Wang and X. H. Yan, Appl. Phys. A, 2015, 121, 1171–1178 CrossRef CAS.
- P. Du, L. Luo and J. S. Yu, J. Alloy. Compd., 2015, 632, 73–77 CrossRef CAS.
- S. Zhou, S. Jiang, X. Wei, Y. Chen, C. Duan and M. Yin, J. Alloys Compd., 2014, 588, 654–657 CrossRef CAS.
- V. Kumar, S. Som, S. Dutta, S. Das and H. C. Swart, RSC Adv., 2016, 6, 84914–84925 RSC.
- P. Du, L. Luo, W. Li and Q. Yue, J. Appl. Phys., 2014, 116, 014102 CrossRef.
- D. He, C. Guo, S. Jiang, N. Zhang, C. Duan, M. Yin and T. Li, RSC Adv., 2015, 5, 1385–1390 RSC.
- S. Zhou, K. Deng, X. Wei, G. Jiang, C. Duan, Y. Chen and M. Yin, Opt. Commun., 2013, 291, 138–142 CrossRef CAS.
- S. Senapati and K. K. Nanda, Phys. Chem. Chem. Phys., 2016 10.1039/C6CP06608A.
- X. Wang, Q. Liu, P. Cai, J. Wang, L. Qin, T. Vu and H. J. Seo, Opt. Express, 2016, 24, 17792–17804 CrossRef PubMed.
- L. Xing, Y. Xu, R. Wang, W. Xu and Z. Zhang, Opt. Lett., 2014, 39, 454–457 CrossRef CAS PubMed.
- S. A. Wade, S. F. Collins and G. W. Baxter, J. Appl. Phys., 2003, 94, 4743–4756 CrossRef CAS.
- J. Berger, J. Stat. Mech.: Theory Exp., 2010, 07, P07022–P0703321 Search PubMed.
- J. Zhou, Z. Liu and F. Li, Chem. Soc. Rev., 2012, 41, 1323–1349 RSC.
- A. Narayanaswamy, L. F. Feiner, A. Meijerink and P. J. van der Zaag, ACS Nano, 2009, 3, 2539–2546 CrossRef CAS PubMed.
- L. M. Maestro, E. M. Rodríguez, F. S. Rodríguez, M. C. Iglesias-de la Cruz, A. Juarranz, R. Naccache, F. Vetrone, D. Jaque, J. A. Capobianco and J. G. Solé, Nano Lett., 2010, 10, 5109–5115 CrossRef CAS PubMed.
- Q. Dai, Y. Zhang, Y. Wang, M. Z. Hu, B. Zou, Y. Wang and W. W. Yu, Langmuir, 2010, 26, 11435–11440 CrossRef CAS PubMed.
- E. H. Song, S. Ding, M. Wu, S. Ye, F. Xiao, G. P. Dong and Q. Y. Zhang, J. Mater. Chem. C, 2013, 1, 4209–4215 RSC.
- C. Gota, K. Okabe, T. Funatsu, Y. Harada and S. Uchiyama, J. Am. Chem. Soc., 2009, 131, 2766–2767 CrossRef CAS PubMed.
- S. Uchiyama, N. Kawai, A. Prasanna de Silva and K. Iwai, J. Am. Chem. Soc., 2004, 126, 3032–3033 CrossRef CAS PubMed.
- N. Rakov, S. A. Vieira, Q. P. S. Silva and G. S. Maciel, Sens. Actuators, B, 2015, 209, 407–412 CrossRef CAS.
- D. Chen, Z. Wan and Y. Zhou, Sens. Actuators, B, 2016, 226, 14–23 CrossRef CAS.
- O. A. Savchuk, P. Haro-González, J. J. Carvajal, D. Jaque, J. Massons, M. Aguiló and F. Díaz, Nanoscale, 2014, 6, 9727–9733 RSC.
- S. Zhou, X. Li, X. Wei, C. Duan and M. Yin, Sens. Actuators, B, 2016, 231, 641–645 CrossRef CAS.
- M. Bettinelli, A. Speghini, F. Piccinelli, A. N. C. Neto and O. L. Malta, J. Lumin., 2011, 131, 1026–1028 CrossRef CAS.
- K. Binnemans, Coord. Chem. Rev., 2015, 295, 1–45 CrossRef CAS.
- I. V. Berezovskaya, V. P. Dotsenko, A. S. Voloshinovskii and S. S. Smola, Chem. Phys. Lett., 2013, 585, 11–14 CrossRef CAS.
- P. A. Tanner and C. Duan, Coord. Chem. Rev., 2010, 254, 3026–3029 CrossRef CAS.
| This journal is © The Royal Society of Chemistry 2017 |

