 Open Access Article
Creative Commons Attribution 3.0 Unported Licence
A novel aptamer-based DNA diamond nanostructure for in vivo targeted delivery of epirubicin to cancer cells†
Khalil Abnous‡
a,
Noor Mohammad Danesh‡bc,
Mohammad Ramezanib,
Parirokh Lavaeed,
Seyed Hamid Jalalianbd,
Rezvan Yazdian-Robatie,
Ahmad Sarreshtehdar Emranif,
Koroush Yousefi Hassanabadg and
Seyed Mohammad Taghdisi *h
*h
aPharmaceutical Research Center, Mashhad University of Medical Sciences, Mashhad, Iran
bNanotechnology Research Center, Mashhad University of Medical Sciences, Mashhad, Iran
cResearch Institute of Sciences and New Technology, Mashhad, Iran
dAcademic Center For Education, Culture and Research (ACECR)-Mashhad Branch, Mashhad, Iran
eDepartment of Pharmaceutical Biotechnology, School of Pharmacy, Mashhad University of Medical Sciences, Mashhad, Iran
fCardiovascular Research Center, Ghaem Hospital, Mashhad University of Medical Sciences, Mashhad, Iran
gDepartment of Infectious Disease, Children Medical Center, North Khorasan University of Medical Sciences, Bojnord, Iran
hTargeted Drug Delivery Research Center, Mashhad University of Medical Sciences, Mashhad, Iran. E-mail: taghdisihm@mums.ac.ir; Fax: +98 513 882 3255; Tel: +98 513 882 3255
First published on 7th March 2017
Abstract
The clinical administration of epirubicin (Epi) in the treatment of cancer has been restricted, owing to its cardiotoxicity. Targeted delivery of anticancer agents could increase their therapeutic efficacy and decrease their off-target effects. In this study, a novel Epi-DNA diamond nanostructure (DDN) conjugate containing two kinds of aptamers (MUC1 and ATP aptamers) was designed and evaluated in the treatment of target cells, including C26 cells (murine colon carcinoma cell) and MCF-7 cells (breast cancer cell). DDN and Epi-DDN conjugate formations were analyzed by gel retardation assay and fluorometric analysis, respectively. Release profiles of Epi from the developed Epi-DDN conjugate were evaluated at pHs 5.4 and 7.4. For the MTT assay (cell viability study), CHO cells (Chinese hamster ovary cell, nontarget), C26 and MCF-7 cells (target) were treated with the Epi-DDN conjugate, DDN, Epi, Epi-DDN conjugate without ATP aptamer and Epi-DDN conjugate without MUC1 aptamer. Internalization of the Epi-DDN conjugate was assessed by flow cytometry analysis and fluorescence imaging. Finally, the designed Epi-DDN conjugate was utilized for inhibition of tumor growth in vivo. 10 μM Epi was efficiently loaded in 1 μM DDN. The drug was released from the Epi-DDN conjugate in a pH-sensitive manner (higher release in acidic conditions). The results of flow cytometry analysis and fluorescence imaging confirmed that the developed Epi-DDN conjugate was effectively internalized into target cells, but not into nontarget cells. The results of the MTT assay were consistent with the internalization data. The Epi-DDN conjugate had more cytotoxicity in MCF-7 and C26 cells and less cytotoxicity in CHO cells in comparison with Epi alone. Moreover, the Epi-DDN conjugate could effectively prohibit tumor growth in vivo.
1. Introduction
Breast cancer is the most common cancer among women, associated with high rates of death. Surgery and chemotherapy are prevalently utilized for the treatment of this cancer.1,2Colon cancer is a major reason of cancer-related death throughout the world.3
Epirubicin (Epi), a chemotherapy drug, is commonly used for the treatment of different malignancies, such as breast, gastric, colon, bladder and ovarian cancers.4–6 Clinical application of Epi has been restricted, owing to its cardiotoxicity and bone marrow suppression.7,8
Targeted delivery of anticancer drugs by nanoparticles increases the internalization of chemotherapeutic agents into cancer tissues and decreases their side effects.9,10
Nowadays, aptamers are broadly used as smart ligands for targeted delivery of anticancer drugs. Aptamers are single-stranded DNA or RNA molecules, screened by an in vitro selection approach, called SELEX (systematic evolution of ligands by exponential enrichment).11,12 They specifically and tightly bind to a broad range of heterogeneous targets, ranging from small molecules to whole cells.13,14 Compared to antibodies, aptamers exhibit significant advantages, such as small size, high reproducibility, no toxicity and immunogenicity, high thermal stability, low cost and the ease of synthesis and modification.15–18 In addition, aptamers have smaller size in comparison with antibodies, resulting in faster and more penetration of aptamers into solid tumors.19 Due to these characteristics, aptamers are promising targeting ligands for application in medicine such as therapeutic and diagnostic applications.20,21
MUC1 aptamer named S2.2 binds with high affinity to abnormally glycosylated mucin-1, a cell surface glycoprotein which expresses in many cancers, such as breast, colon, lung and ovarian cancers.22–24
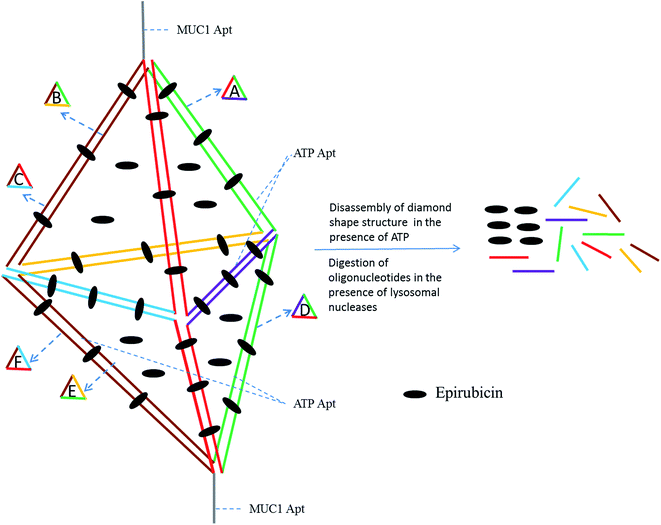
In this paper, a novel MUC1 aptamer-based DNA diamond nanostructure (DDN) was designed for targeted delivery of Epi to tumor cells in vitro and in vivo. The designed DDN was a DNA nanostructure containing short DNA building blocks. It had promising characteristics, including monodispersity and excellent stability. Also, large amounts of Epi, as an intercalating agent, could be loaded in DDN, because of the presence of high amounts of double-stranded DNA sequences in the construction of DDN. Moreover, in this study, ATP aptamer was applied in the building blocks of DDN, in addition to MUC1 aptamer (Fig. 1). Presence of ATP aptamer could facilitate disassembly of DDN in lysosome which has high amounts of ATP, leading to more and fast release of Epi from the DDN because it has been proved that aptamer binds to its corresponding target with a higher binding constant relative to its complementary strand.25,26 These features maked the designed DDN an ideal nanocarrier for delivery of Epi.
2. Materials and methods
2.1. Materials
All the oligonucleotides were synthesized by a Polygen DNA synthesizer (Polygen, Germany) (Tables 1 and S1†). 10k centrifugal device was purchased from PALL (USA). Rat serum and Epirubicin (Epi) were obtained from Sigma-Aldrich (USA).2.2. Cell culture
CHO (C111, Chinese hamster ovary cell), C26 (C532, murine colon carcinoma cell) and MCF-7 (C135, breast cancer cell) cells were purchased from Pasteur Institute of Iran and cultured in RPMI 1640 (Gibco) supplemented with 10% fetal bovine serum (FBS, heat inactivated, Gibco) and 100 units per mL penicillin–streptomycin (Sigma-Aldrich).2.3. Preparation of DDN
In TM buffer (10 mM Tris–HCl, 50 mM MgCl2, pH 7.4) three ssDNAs (A, B and C) were mixed (final concentration of each strand was 20 μM) in microtube 1. The solution was heated at 90 °C for 5 min and then cooled to 4 °C. The same treatment was done for other three ssDNAs (D, E and F) in microtube 2. The two microtubes were mixed and incubated for 2 h at room temperature. Formation of DDN was analyzed by 2% agarose gel electrophoresis. The size of DDN was investigated by a particle size analyzer (Malvern, UK).2.4. Serum stability of DDN
Serum stability of DDN was evaluated by agarose gel electrophoresis. 10 μM DDN was treated with rat serum. After 12 h, the samples were extracted by phenol–chloroform, followed by visualizing undigested DDN on a 2% agarose gel electrophoresis.2.5. Epi loading onto the DDN
To assess Epi-DDN conjugate formation and specify the amount of drug loading in DDN, different concentrations of DDN (0–5 μM) were incubated with a constant concentration of Epi (20 μM) in phosphate buffer saline (PBS, pH 7.4) and fluorescence spectra were recorded by a Synergy H4 microplate reader (BioTeK, USA).2.6. Release profile of Epi from the Epi-DDN conjugate
Epi-DDN conjugate was added to citric acid–sodium phosphate dibasic buffer with pHs 7.4 and 5.5. At specific time intervals (0–72 h), the Epi-DDN conjugate was separated from the buffer by a 10k centrifugal device and the amount of released Epi was determined by recording fluorescence intensities, λEx = 480 nm and λEm = 600 nm.2.7. Flow cytometry analysis
C26, CHO and MCF-7 cells were seeded in 12-well plates (2 × 10⁵ cells per well). Cells were treated with 10 μM Epi and Epi-DDN conjugate (with the same amount of Epi) for 3 h. Then, cells were incubated with trypsin–EDTA for 7 min. After that, the cells were resuspended in PBS for analysis of Epi fluorescence on a BD Accuri C6 flow cytometer (BD Biosciences, US). The data were analyzed by FlowJo 7.6.1 software.2.8. Fluorescence imaging
The internalization of Epi-DDN conjugate into MCF-7 and CHO cells were assessed by fluorescence microscopy. Collagen-treated cover slips (0.1% collagen in acetic acid) were placed in the wells of a 6-well plate. The cells (1 × 10⁵ per well) were allowed to adhere to the surface collagen-treated cover slips overnight. Then, the cells were washed with PBS and incubated with 4 μM Epi and Epi-DN conjugate (4 μM Epi) for 3 h. Next, the cells were rinsed 5 times with cold PBS and fixed with 4% formaldehyde for 15 min. The fluorescent cells were visualized using an inverted fluorescent microscope (CETI, UK).2.9. MTT assay
Escalating-dose studies of Epi (0–10 μM), showed that IC50 of Epi for CHO, MCF-7 and C26 cells were 2.5, 3.5 and 2 μM, respectively. To investigate cell viability, CHO, C26 and MCF-7 cells were seeded in 96-well plates (5 × 10³ cells per well). Cells were incubated with Epi (according to the results of escalating-dose studies), DDN, Epi-DDN conjugate without ATP aptamer, Epi-DDN conjugate without MUC1 aptamer and Epi-DDN conjugate (with the same concentration of Epi) for 3 h. Thereafter, supernatants were eliminated and fresh culture medium was added to each well. Then, cells were incubated for 72 h at 37 °C. Next, 10 μL MTT was added to each well for 3.5 h. Subsequently, 100 μL DMSO was added to each well and A545 was measured by the microplate reader.2.10. In vivo efficacy of the designed Epi-DDN conjugate
Balb/c mice (6 weeks) were obtained from Pasteur Institute of Iran. Animals were maintained in accordance with the guidelines of Mashhad University of Medical Sciences, Mashhad, Iran, and approved by the institutional ethical committee (IEC) of Mashhad University of Medical Sciences. The mice were subcutaneously injected with 3 × 10⁵ C26 cells in the right flank. When the diameter of the tumor reached around 100–200 mm3, the mice were blindly divided to several groups (5 mice in each group) for sample treatment. Afterwards, solid tumor bearing mice were treated with one dose of different treatments, including Epi-DDN conjugate (equal to 2.4 mg kg−1 Epi per mouse), Epi (equal to 2.4 mg kg−1 Epi per mouse) and normal saline as blank control, intravenously. The tumor volumes were measured with a caliper every 4 days up to 16 days.2.11. Statistical analysis
Statistical tests were carried out using the Student's t-test. Data are means ± SD, n = 3 independent treatments. P values less than 0.05 means as significant; whereas p > 0.05 is considered that data are not significantly different.3. Results
3.1. Characterization of prepared DDN
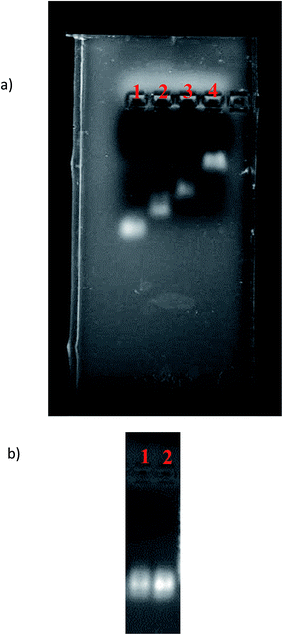
The formation of DDN was verified using gel retardation assay. As indicated in Fig. 2(a), the band of DDN was retarded relative to the bands of other DNA combinations lacking one or more strands. The size of DDN and Epi-DDN conjugate were about 24 and 24.5 nm as measured by the particle size analyzer. Stability analysis showed that the band of DDN was sharp after 12 h incubation with serum, confirming stability of the designed DDN in biological samples like serum (Fig. 2(b)).3.2. Epi loading in the DDN
Fluorometric analysis was used to evaluate the formation of Epi-DDN conjugate. Epi fluorescence characteristic, as an intercalating agent, decreases following its binding to DNA.8,27 Fig. 3 indicates the quenching profile of Epi fluorescence spectra after incubation with different amounts of DDN (0–5 μM) to a constant concentration of drug (20 μM). Results showed that the maximum quenching of Epi occurred at 1![[thin space (1/6-em)]](https://www.rsc.org/images/entities/char_2009.gif) :
:![[thin space (1/6-em)]](https://www.rsc.org/images/entities/char_2009.gif) 10 mole ratio of DDN to Epi.
10 mole ratio of DDN to Epi.
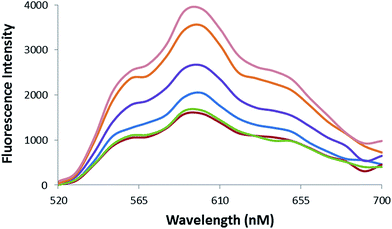 | ||
| Fig. 3 Fluorescence spectra of Epi (20 μM) after treatment with increasing concentrations of DDN (from top to bottom 0, 0.2, 0.5, 1, 2, 5 μM). | ||
3.3. pH-triggered Epi release from DDN
Release of drug from Epi-DDN conjugate was pH-dependent. In acidic condition (pH 5.5), simulating the pHs of lysosome and cancer cell environment, around 54% of Epi was released from the conjugate in 72 h at 37 °C (Fig. 4), while only about 18% of drug was released from the Epi-DDN conjugate after the same treatment at pH 7.4.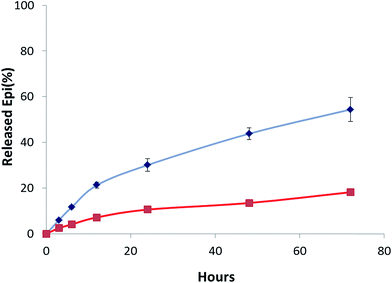 | ||
| Fig. 4 Profile of Epi release from Epi-DDN conjugate in citric acid–sodium phosphate dibasic buffer at 37 °C at pH 7.4 (bottom) and at pH 5.5 (top). | ||
3.4. Internalization assay
The fluorescent images of MCF-7 and CHO cells after treatment with Epi-DDN conjugate and Epi have been shown in Fig. 5. The images indicated more internalization of Epi-DDN conjugate into target cells (MCF-7) and its less internalization into nontarget cells (CHO) compared with Epi alone.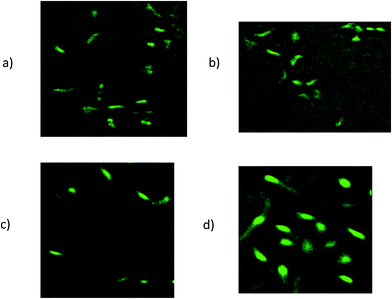 | ||
| Fig. 5 Fluorescent images of MCF-7 cells after treatment with Epi-DDN conjugate (a) and Epi (b). Fluorescent images of CHO cells after treatment with Epi-DDN conjugate (c) and Epi (d). | ||
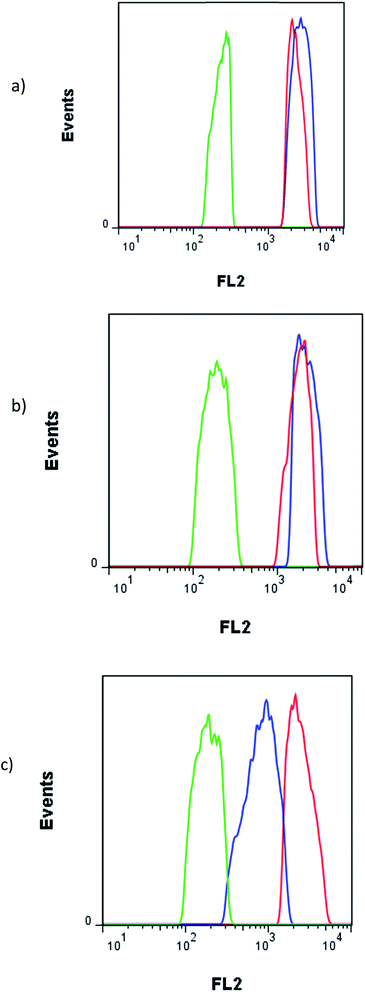
The fluorescence FL2 histograms of C26, CHO and MCF-7 cells after treatment with 10 μM Epi and Epi-DDN conjugate have been shown in Fig. 6. FL2 log intensity for MCF-7 cells after no treatment, treatments with Epi-DDN conjugate and Epi were, 193 ± 13, 2240 ± 128 and 1827 ± 129, respectively. FL2 log intensity for C26 cells after no treatment, treatments with Epi-DDN conjugate and Epi were, 234 ± 15, 2738 ± 232 and 2311 ± 165, respectively. FL2 log intensity for CHO cells after no treatment, treatments with Epi-DDN conjugate and Epi were, 189 ± 13, 857 ± 39 and 2557 ± 213, respectively.
3.5. Cell viability
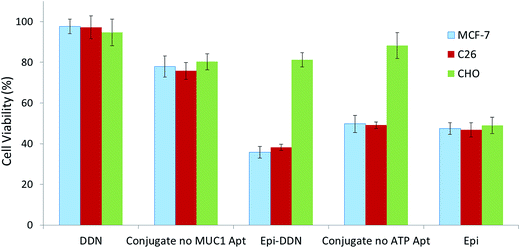
MTT assay was carried out to determine C26, MCF-7 and CHO cells viability (Fig. 7). CHO cell viability after treatments with DDN, Epi-DDN conjugate, Epi, Epi-DDN conjugate without ATP aptamer and Epi-DDN conjugate without MUC1 aptamer were 94.2 ± 6.5%, 81.2 ± 3.5%, 49 ± 4.1, 85.6 ± 6.4% and 80.3 ± 3.9%, respectively. C26 cell viability after treatments with DDN, Epi-DDN conjugate, Epi, Epi-DDN conjugate without ATP aptamer and Epi-DDN conjugate without MUC1 aptamer were 97.2 ± 5.6%, 38.1 ± 1.5%, 46.8 ± 3.5%, 49.1 ± 1.6% and 75.8 ± 4.7%, respectively. MCF-7 cell viability after treatments with DDN, Epi-DDN conjugate, Epi, Epi-DDN conjugate without ATP aptamer and Epi-DDN conjugate without MUC1 aptamer were 97.6 ± 3.6%, 35.8 ± 2.7%, 47.5 ± 2.9%, 49.7 ± 4.2% and 77.9 ± 5.2%, respectively.3.6. Inhibition of tumor growth in vivo
For assessment of the antitumor efficacy of Epi-DDN conjugate, 15 mice were blindly allocated into three groups and each group received one dose of the following treatments: Epi-DDN conjugate, Epi and normal saline. The results showed for Epi-DDN conjugate, Epi and normal saline, tumor volumes after 16 days post treatment were 620 ± 50, 1910 ± 135 and 4610 ± 298 mm3, respectively (Fig. 8).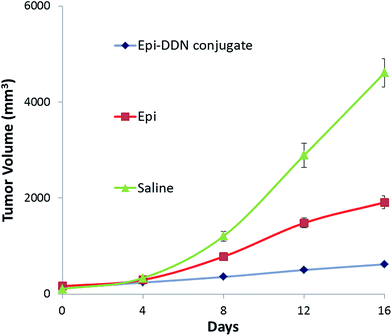 | ||
| Fig. 8 In vivo antitumor efficacy of Epi-DDN conjugate against mice bearing C26 cells after intravenous administration of saline, Epi, and Epi-DDN conjugate via the tail vein during 16 days. | ||
4. Discussion
Chemotherapy is one of the leading methods of tumor treatment. Non-specific interactions of anticancer drugs causes their high toxicity. Targeted drug delivery to solid cancers could improve anticancer drugs efficacy and minimize their side effects by delivery of high amounts of anticancer drugs to intended site.28,29Presence of MUC1 and ATP aptamers in the building blocks of DDN, high drug loading and high stability of the designed DDN make this DNA nanostructure (Fig. 1) a smart and appropriate carrier for Epi delivery.
Epi binds to DDN, because of its intercalating feature. Also, some amounts of Epi could be trapped in the space of the DDN structure. Binding of Epi to DDN was evaluated by recording the quenching profile of Epi fluorescence followed treatment with DDN. Upon addition of DDN to drug, Epi fluorescence intensity decreased about 57.6%, confirming the formation of Epi-DDN conjugate (Fig. 3).
While the Epi-DDN conjugate lost about 18% of its Epi in citric acid–sodium phosphate dibasic buffer (pH 7.4) after 72 h, changing to pH 5.5 facilitated the release of Epi from the Epi-DDN conjugate to 54% under the same condition (Fig. 4). The results indicated the release of drug was more in acidic condition, simulating pH of lysosome and cancer tissues. So, tumor environment and lysosome could be exploited to trigger the release of Epi from the Epi-DDN conjugate. Acidic environment could change conformation of DDN and enhance solubility and hydrophilicity of Epi through inducing protonation of the –NH2 group of Epi, resulting in less interaction between DDN and Epi and facilitating drug release. In cancer cells, the release of Epi from the Epi-DDN conjugate must be more than this concentration, because lysosome not only contains acidic condition but also has high concentrations of ATP and catalytic enzymes, which could ease the release of Epi from the Epi-DDN conjugate, owing to the presence of ATP aptamer in the building blocks of DDN.
Flow cytometry analysis specified that the treatment of C26 and MCF-7 cells (target) with Epi-DDN conjugate significantly enhanced the fluorescence signal of drug in both cell lines compared to free Epi (p < 0.05), indicating more internalization of Epi into Epi-DDN conjugate-treated cells, because of the presence of MUC1 aptamer on the structure of DDN as a targeting ligand (Fig. 6). Moreover, relative to Epi alone, the fluorescence signal of CHO cells (nontarget) incubated with Epi-DDN conjugate was significantly lower (p < 0.05), showing less entry of Epi-DDN conjugated into CHO cells. The results demonstrated that MUC1 aptamer on the structure of DDN could efficiently distinguish between nontarget and target cells. Less entry of Epi-DDN conjugate into CHO cells was due to the absence of the target site of MUC1 aptamer on the surface of this cell line. MUC1 is a smart ligand and uses receptor-mediated endocytosis (RME) for internalization into target cells.30 So, RME is assumed as the internalization mechanism for Epi-DDN conjugate, while free Epi does not have a receptor-mediated uptake.
The results of fluorescence imaging were compatible with the internalization data obtained from flow cytometry analysis (Fig. 5). The results confirmed more internalization of Epi-DDN conjugate into MCF-7 cells (target) and less internalization of the conjugate into CHO cells (nontarget) relative to Epi alone.
The internalization data was also verified by MTT assay too (Fig. 7). Treatment of C26, CHO and MCF-7 cells with DDN did not significantly influence their cell viability (p > 0.05). Incubation of these cell lines with drug alone significantly reduced their cell viability to approximately 50% (p < 0.05) and led to cell death. Compared to Epi alone, treatment of CHO cells with Epi-DDN conjugate significantly increased cell viability to 81.2% (p < 0.05). Relative to free Epi, the cell viability of C26 and MCF-7 cells treated with Epi-DDN conjugate were significantly reduced (p < 0.05), due to the presence of MUC1 aptamer as targeting ligand on the structure of DDN. Also, compared to Epi-DDN conjugate without ATP aptamer and Epi-DDN conjugate without MUC1 aptamer, treatment of MCF-7 and C26 cells (target cells) with Epi-DDN conjugate (containing ATP and MUC1 aptamers) significantly reduced cell viability (p < 0.05), confirming the roles of ATP and MUC1 aptamers for the best function of the developed conjugate.
The clinical efficacy of Epi-DDN conjugate was evaluated by allograft mouse models injected with C26 cells. Analysis of the anticancer efficiency showed that tumor volume in tumor-bearing mice after treatment with Epi-DDN conjugate, Epi and saline increased about 5.3, 11 and 42.7 fold, respectively (Fig. 8). The results indicated that Epi-DDN conjugate could significantly decrease the tumor growth compared to Epi alone (p < 0.05). This arises from the presence of two MUC1 aptamers on the surface of each DDN, resulting in the access of Epi-DDN conjugate to target site of aptamer on the surface of C26 cells and therefore its internalization into these cells.
5. Conclusion
In summary, a novel Epi-DDN conjugate containing two kinds of aptamers (MUC1 and ATP aptamers) was developed for targeted delivery of chemotherapy drug to C26 and MCF-7 cells (target). This conjugate inherited characteristics of high stability, cancer targeting, efficient drug loading and pH and ATP-triggered drug release. Due to these properties, the presented delivery system could reduce side effects of Epi in nontarget cells (CHO cells) and increase its therapeutic efficacy in target cells. Furthermore, the fabricated Epi-DDN conjugate was capable to effectively prohibit tumor growth in vivo.Conflict of interest
There is no conflict of interest about this article.Acknowledgements
Financial support of this study was provided by Mashhad University of Medical Sciences.References
- C. Wang, Y. H. Pan, M. Shan, M. Xu, J. L. Bao and L. M. Zhao, Int. J. Mol. Sci., 2015, 16, 4698–4712 CrossRef CAS PubMed.
- U. Karunarathna, M. Kongsema, S. Zona, C. Gong, E. Cabrera, A. R. Gomes, E. P. S. Man, P. Khongkow, J. W. H. Tsang, U. S. Khoo, R. H. Medema, R. Freire and E. W. F. Lam, Oncogene, 2016, 35, 1433–1444 CrossRef CAS PubMed.
- Y. L. Lo, Int. J. Mol. Sci., 2013, 14, 158–176 CrossRef CAS PubMed.
- S. M. Taghdisi, N. M. Danesh, M. Ramezani, P. Lavaee, S. H. Jalalian, R. Y. Robati and K. Abnous, Eur. J. Pharm. Biopharm., 2016, 102, 152–158 CrossRef CAS PubMed.
- I. Matai, A. Sachdev and P. Gopinath, ACS Appl. Mater. Interfaces, 2015, 7, 11423–11435 CAS.
- S. H. Jalalian, S. M. Taghdisi, N. Shahidi Hamedani, S. A. Kalat, P. Lavaee, M. Zandkarimi, N. Ghows, M. R. Jaafari, S. Naghibi, N. M. Danesh, M. Ramezani and K. Abnous, Eur. J. Pharm. Sci., 2013, 50, 191–197 CrossRef CAS PubMed.
- M. Nasr, N. Nafee, H. Saad and A. Kazem, Eur. J. Pharm. Biopharm., 2014, 88, 216–225 CrossRef CAS PubMed.
- S. M. Taghdisi, N. M. Danesh, A. Sarreshtehdar Emrani, K. Tabrizian, M. Zandkarimi, M. Ramezani and K. Abnous, J. Drug Targeting, 2013, 21, 739–744 CrossRef CAS PubMed.
- D. M. Eckmann, R. J. Composto, A. Tsourkas and V. R. Muzykantov, J. Mater. Chem. B, 2014, 2, 8085–8097 RSC.
- R. Senthilkumar, D. S. Karaman, P. Paul, E. M. Björk, M. Odén, J. E. Eriksson and J. M. Rosenholm, Biomater. Sci., 2015, 3, 103–111 RSC.
- F. Du, L. Guo, Q. Qin, X. Zheng, G. Ruan, J. Li and G. Li, TrAC, Trends Anal. Chem., 2015, 67, 134–146 CrossRef CAS.
- X. Tang, Y. S. Wang, J. H. Xue, B. Zhou, J. X. Cao, S. H. Chen, M. H. Li, X. F. Wang, Y. F. Zhu and Y. Q. Huang, J. Pharm. Biomed. Anal., 2015, 107, 258–264 CrossRef CAS PubMed.
- S. Wu, H. Zhang, Z. Shi, N. Duan, C. Fang, S. Dai and Z. Wang, Food Control, 2015, 50, 597–604 CrossRef CAS.
- F. Zhao, Q. Xie, M. Xu, S. Wang, J. Zhou and F. Liu, Biosens. Bioelectron., 2015, 66, 238–243 CrossRef CAS PubMed.
- N. M. Danesh, P. Lavaee, M. Ramezani, K. Abnous and S. M. Taghdisi, Int. J. Pharm., 2015, 489, 311–317 CrossRef CAS PubMed.
- S. Eissa, M. Siaj and M. Zourob, Biosens. Bioelectron., 2015, 69, 148–154 CrossRef CAS PubMed.
- Y. Lian, F. He, H. Wang and F. Tong, Biosens. Bioelectron., 2015, 65, 314–319 CrossRef CAS PubMed.
- W. Zhou, P. J. Jimmy Huang, J. Ding and J. Liu, Analyst, 2014, 139, 2627–2640 RSC.
- D. Xiang, C. Zheng, S. F. Zhou, S. Qiao, P. H. Tran, C. Pu, Y. Li, L. Kong, A. Z. Kouzani, J. Lin, K. Liu, L. Li, S. Shigdar and W. Duan, Theranostics, 2015, 5, 1083–1097 CrossRef CAS PubMed.
- D. Xiang, S. Shigdar, G. Qiao, T. Wang, A. Z. Kouzani, S. F. Zhou, L. Kong, Y. Li, C. Pu and W. Duan, Theranostics, 2015, 5, 23–42 CrossRef PubMed.
- C. Li, T. Chen, I. Ocsoy, G. Zhu, E. Yasun, M. You, C. Wu, J. Zheng, E. Song, C. Z. Huang and W. Tan, Adv. Funct. Mater., 2014, 24, 1772–1780 CrossRef CAS PubMed.
- Z. Liu, H. Zhao, L. He, Y. Yao, Y. Zhou, J. Wu, J. Liu and J. Ding, RSC Adv., 2015, 5, 16931–16939 RSC.
- C. S. M. Ferreira, C. S. Matthews and S. Missailidis, Tumor Biol., 2006, 27, 289–301 CrossRef CAS PubMed.
- W. Du, Y. Yuan, L. Wang, Y. Cui, H. Wang, H. Xu and G. Liang, Bioconjugate Chem., 2015, 26, 2571–2578 CrossRef CAS PubMed.
- Q. Song, M. Peng, L. Wang, D. He and J. Ouyang, Biosens. Bioelectron., 2016, 77, 237–241 CrossRef CAS PubMed.
- C. Yang, Q. Wang, Y. Xiang, R. Yuan and Y. Chai, Sens. Actuators, B, 2014, 197, 149–154 CrossRef CAS.
- A. Erdem and M. Ozsoz, Anal. Chim. Acta, 2001, 437, 107–114 CrossRef CAS.
- X. Li, Q. Zhao and L. Qiu, J. Controlled Release, 2013, 171, 152–162 CrossRef CAS PubMed.
- J. K. Vasir and V. Labhasetwar, Technol. Cancer Res. Treat., 2005, 4, 363–374 CrossRef CAS PubMed.
- P. Ray and R. R. White, Pharmaceuticals, 2010, 3, 1761–1778 CrossRef CAS PubMed.
Footnotes |
| † Electronic supplementary information (ESI) available. See DOI: 10.1039/c6ra28234b |
| ‡ These authors contributed equally to the work. |
| This journal is © The Royal Society of Chemistry 2017 |

