 Open Access Article
Creative Commons Attribution 3.0 Unported Licence
Solvent free mechanochemical synthesis of Eu3+ complex and its luminescent sensing of trace water and temperature†
Daqing Yang,
Zhiqiang Li,
Liang He,
Yucheng Deng and
Yige Wang *
*
School of Chemical Engineering and Technology, Hebei University of Technology, Tianjin, 300130, China. E-mail: wangyige@hebut.edu.cn
First published on 3rd March 2017
Abstract
Mechanochemical transduction processes which translate macroscopic forces into chemical reactions are a design method to synthesize new advanced functional materials. Herein we present a simple, facile and solventless method for the formation of a Eu3+ coordination complex by simply grinding 4′,4′′′′-(1,4-phenylene)bis(2,2′:6′,2′′-terpyridine) and EuCl3·6H2O in a mortar for a short time. The resulting complex exhibits outstanding stimuli-responsive emissions for temperature and trace water in organic solvents. The ratiometric luminescence determination method based on the emission intensity ratio of two independent transitions of Eu3+ provides a way to rapidly detect traces of water (0.1–5% v/v) in various organic solvents through the luminescence quenching mechanism. Furthermore, by virtue of the temperature-dependent luminescent behavior, the complex allows for the design of a thermometer with an excellent linear response to temperature over a wide range, from 80 to 420 K with a high relative sensitivity of 0.52% per K at 300 K and an unprecedented high sensitivity of 10.26% per K at 420 K. The dynamically reversible complexation between Eu3+ and the ligand facilitates its application as a smart material.
1. Introduction
The luminescence of trivalent lanthanide ions (Ln3+) is especially interesting as they typically show highly desirable physical properties such as sharp emission lines, long lifetimes, high quantum yields and large Stocks shifts, making them suitable for a variety of advanced photonic applications.1–4 However, the emission intensities of bare lanthanide ions are weak because of the forbidden nature of the f–f transitions. This problem can be addressed by coordinating Ln3+ to organic ligands bearing the suitable light-absorbing chromophores via the so-called antenna effect.5,6 Ln3+ complexes are normally obtained by the coordinative interactions between metal ions and organic ligands. They have attracted the attention of researchers across various fields due to their versatile structure, morphology and physical properties as well as their unique redox, optical, electronic, catalytic and magnetic properties induced by the incorporated metal ions.7–14 Tridentate terpyridine ligands can act as efficient Ln3+ emission sensitizers and as organic linkers suitable for constructing the Ln3+ complexes.15–18 Various luminescence materials were prepared by a self-assembly process between Ln3+ and tridentate terpyridine ligands. In addition to interesting luminescent features such as tunable emission color and white-light emission, these materials are endowed with stimuli-responsive ability and/or self-healability.13,19–24 Furthermore, the morphology of the Ln3+ complexes is highly dependent on the concentration, ligand to metal ratio and the ligand flexibility.25–27 Their preparation usually needs the use of environmentally hazardous solvents. Mechanochemical synthesis provides alternatives to the conventional solvent-based strategy since they can offer obvious advantages such as the reduction or elimination of solvent use, access to new materials or alternative solid forms, convenience, and shorter reaction times.28–32 Up to now, a variety of compounds such as metal complexes and metal–organic frameworks (MOFs) have been successfully prepared by solvent-free (or minimal amount of solvent assisted) mechanochemical method.33–39 However, no reports on the Ln3+ complexes induced by complexation of Eu3+ with organic linker consisting of terpyridine moieties prepared by mechanochemical method appear in the literature yet, to the best of our knowledge.Herein we report a rapid, solvent-free, room temperature mechanochemical synthesis of an Eu3+ complex by simply grinding 4′,4′′′′-(1,4-phenylene)bis(2,2′:6′,2′′-terpyridine) (L) and EuCl3·6H2O in a mortar for a fixed time. The complex shows bright red luminescence that is highly sensitive to even low level water in organic solvents and to temperature variation in a wide range from 80 to 470 K. The detection of traces of water (0.1–5% v/v) contained in organic solvents such as ether and THF can be easily achieved through an effective luminescence quenching mechanism due to the replacement of L with water molecules which strongly quench the radiative emission. The temperature dependent luminescent properties allow for the design of a thermometer with an excellent linear response to temperature over a wide range from 80–300 K and 300–420 K with a high relative sensitivity of 0.52% per K at 300 K and an unprecedented high sensitivity of 10.26% per K at 420 K.
2. Results and discussion
2.1 Preparation and characterization
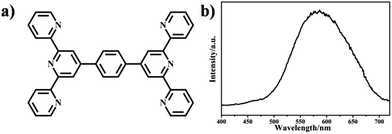
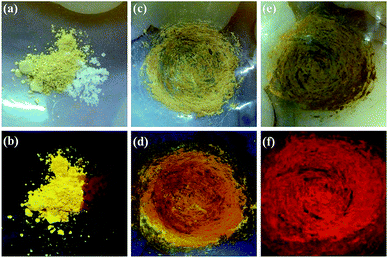
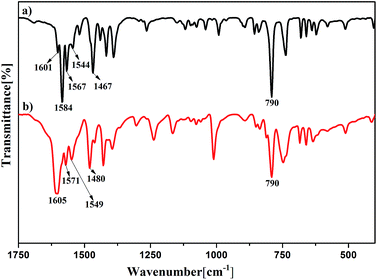
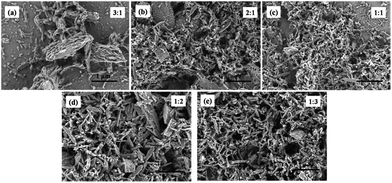
L belongs to the three tridentate ligands family. Its chemical structure and emission spectrum are shown in Fig. 1. Compared with single terpyridine compound, bis-terpyridine can be used to build supramolecular compound flexibly.40 We successfully prepared the Eu3+ complex (denoted as Eu(L)n, n= the molar ratio of Eu3+/L) with L and EuCl3·6H2O by the mechanochemical technique within a short time. Upon manual grinding for 10 min, the emission colors of the complex showed obvious change from yellow (Fig. 2b) to bright red (Fig. 2f). The obtained complex shows good solubility in MeOH solution and the bright emission implies the coordination of nitrogen atoms from L with Eu3+ ions and the sensitization of L to the metal ions, which is further confirmed by FT-IR spectra and luminescent data. The bands at 1601 to 1544 cm−1 in the FT-IR spectrum of the L shown in Fig. 3a are assigned to the pyridine ring of L, the strong band at 790 cm−1 can be ascribed to the C–C bond between the pyridine rings.41–43 Upon manual grinding with EuCl3·6H2O for several minutes, the absorption bands corresponding to the terpyridine moieties of L shift to 1605 to 1549 cm−1 (Fig. 3b), indicative of the coordination of nitrogen atoms of L to Eu3+ ions.The morphology was investigated by scanning electron microscopy (SEM) and the data are shown in Fig. 4. The SEM images reveal that the samples with L to Eu3+ molar ratio below 3 are mainly consist of micro sized bars (0.2–0.5 μm), which are smaller in size compared with the samples prepared by the conventional solution method. A closer look at the images demonstrates that the bars actually are formed by the aggregation of much smaller nanoparticles. Further increase the molar ratio of L to Eu3+ to 3![[thin space (1/6-em)]](https://www.rsc.org/images/entities/char_2009.gif) :
:![[thin space (1/6-em)]](https://www.rsc.org/images/entities/char_2009.gif) 1 leads to the formation of sample with totally different morphology (Fig. 4e). The fibrous nature of the Eu3+ complexes consisting of long intertwining bundles of strings (0.6–0.8 μm) is evidenced from the typical SEM image. Furthermore, spherical nanoparticles with average size of less than 100 nm are also observed.
1 leads to the formation of sample with totally different morphology (Fig. 4e). The fibrous nature of the Eu3+ complexes consisting of long intertwining bundles of strings (0.6–0.8 μm) is evidenced from the typical SEM image. Furthermore, spherical nanoparticles with average size of less than 100 nm are also observed.
The composition and the thermal-stability of the Eu3+ complex can be roughly estimated by thermogravimetric (TG) analysis. We take the sample Eu(L)1 as an example. The TG curve (Fig. S1, ESI†) shows 16.6% weight loss up to 480 °C is attributed to the desorption of physically adsorbed water and residual solvents. This indicates the as-synthesized sample has a high thermal-stability. The second weight loss (ca. 47.75%) in the range of 480–720 °C can be ascribed to the decomposition of coordinated ligand.44 A horizontal thermal curve was observed above 1100 °C, which is due to the formation of the thermally stable product Eu2O3 (30.38%). The amount of the chelated europium(III) ions was determined to be 26.24%, and this value roughly corresponds to a molar ratio of 1![[thin space (1/6-em)]](https://www.rsc.org/images/entities/char_2009.gif) :
:![[thin space (1/6-em)]](https://www.rsc.org/images/entities/char_2009.gif) 1 between L and Eu3+. To further confirm that the elemental composition of complex, elemental analysis was carried out. Elemental analysis for Eu(L)1, found (calcd): C 54.42 (54.1), H 3.13 (3.0), N 10.57 (10.52).
1 between L and Eu3+. To further confirm that the elemental composition of complex, elemental analysis was carried out. Elemental analysis for Eu(L)1, found (calcd): C 54.42 (54.1), H 3.13 (3.0), N 10.57 (10.52).
2.2 Optical properties
As shown in Fig. 2f, the final materials prepared by solvent-free mechanochemical synthesis method show bright red-emission when illuminated with a 365 nm UV lamp, indicating the formation of Eu–L coordination bonds. We therefore investigate the luminescence properties of the as-synthesized samples, Eu(L)n, by steady state and time-resolved emission measurements. Fig. 5 shows the excitation and emission spectra. The broad bands ranging from 250 to 410 nm in all the excitation spectra shown in Fig. 5a are attributed to the absorption of L. The emission spectra (Fig. 5b) are formed by a series of line-like bands ascribed to the 5D0 → 7FJ (J = 0, 1, 2, 3 and 4) transitions of Eu3+ with the 5D0 → 7F2 transition at 613 nm as the most prominent one, which is responsible for the bright red emission color shown in Fig. 2f. The emission intensity is highly dependent on the molar ratio of L to Eu3+ ratio. It increases gradually with the molar ratio increasing and reaches the maximum when the molar ratio is 1![[thin space (1/6-em)]](https://www.rsc.org/images/entities/char_2009.gif) :
:![[thin space (1/6-em)]](https://www.rsc.org/images/entities/char_2009.gif) 1, further increasing the molar ratio leads to the gradual decrease of the emission intensity. The luminescence decay curves were measured under excitation at 360 nm and can be well fitted by mono-exponential functions (Fig. S2, ESI†), indicating that only one major emitting species is available in the samples,45,46 from which the decay time was determined and the data are shown in Table 1. The decay time increases slightly from 0.24 ms to 0.36 ms when the L to Eu3+ molar ratio increases from 1
1, further increasing the molar ratio leads to the gradual decrease of the emission intensity. The luminescence decay curves were measured under excitation at 360 nm and can be well fitted by mono-exponential functions (Fig. S2, ESI†), indicating that only one major emitting species is available in the samples,45,46 from which the decay time was determined and the data are shown in Table 1. The decay time increases slightly from 0.24 ms to 0.36 ms when the L to Eu3+ molar ratio increases from 1![[thin space (1/6-em)]](https://www.rsc.org/images/entities/char_2009.gif) :
:![[thin space (1/6-em)]](https://www.rsc.org/images/entities/char_2009.gif) 3 to 1
3 to 1![[thin space (1/6-em)]](https://www.rsc.org/images/entities/char_2009.gif) :
:![[thin space (1/6-em)]](https://www.rsc.org/images/entities/char_2009.gif) 1, further increasing the molar ratio leads to the slight decrease of the decay time, which could be explained by a ligand quenching pathway caused the C–H vibrations of some ligands.47–49 Furthermore, we also investigated the behavior of the emission intensity ratio I(5D0 → 7F2)/I(5D0 → 7F1) (R) of materials. R is typically used to measure the degree of Eu3+ ions asymmetry variation in different local environment and normally becomes larger with increasing interaction of the Eu3+ with its neighbours due to the decrease in its site symmetry.50,51 The largest intensity ratio (3.60) was observed for 1
1, further increasing the molar ratio leads to the slight decrease of the decay time, which could be explained by a ligand quenching pathway caused the C–H vibrations of some ligands.47–49 Furthermore, we also investigated the behavior of the emission intensity ratio I(5D0 → 7F2)/I(5D0 → 7F1) (R) of materials. R is typically used to measure the degree of Eu3+ ions asymmetry variation in different local environment and normally becomes larger with increasing interaction of the Eu3+ with its neighbours due to the decrease in its site symmetry.50,51 The largest intensity ratio (3.60) was observed for 1![[thin space (1/6-em)]](https://www.rsc.org/images/entities/char_2009.gif) :
:![[thin space (1/6-em)]](https://www.rsc.org/images/entities/char_2009.gif) 1 Eu(L)1. It reflects that the lower symmetry of the Eu3+ and hence a larger Eu3+–L interaction of the complexes, implying a more complete coordination between Eu3+ to terpyridine ligand.
1 Eu(L)1. It reflects that the lower symmetry of the Eu3+ and hence a larger Eu3+–L interaction of the complexes, implying a more complete coordination between Eu3+ to terpyridine ligand.
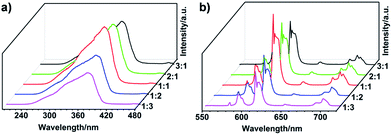 | ||
Fig. 5 (a) Excitation spectra monitored at 613 nm and (b) emission spectra excited at 360 nm of the samples in the solid state: L to Eu3+ ratio from 3![[thin space (1/6-em)]](https://www.rsc.org/images/entities/char_2009.gif) : :![[thin space (1/6-em)]](https://www.rsc.org/images/entities/char_2009.gif) 1 to 1 1 to 1![[thin space (1/6-em)]](https://www.rsc.org/images/entities/char_2009.gif) : :![[thin space (1/6-em)]](https://www.rsc.org/images/entities/char_2009.gif) 3. 3. | ||
L![[thin space (1/6-em)]](https://www.rsc.org/images/entities/char_2009.gif) : :![[thin space (1/6-em)]](https://www.rsc.org/images/entities/char_2009.gif) Eu3+ Eu3+ |
τ [ms] | nw | R |
|---|---|---|---|
3![[thin space (1/6-em)]](https://www.rsc.org/images/entities/char_2009.gif) : :![[thin space (1/6-em)]](https://www.rsc.org/images/entities/char_2009.gif) 1 1 |
0.30 | 3.37 | 3.20 |
2![[thin space (1/6-em)]](https://www.rsc.org/images/entities/char_2009.gif) : :![[thin space (1/6-em)]](https://www.rsc.org/images/entities/char_2009.gif) 1 1 |
0.33 | 2.71 | 3.24 |
1![[thin space (1/6-em)]](https://www.rsc.org/images/entities/char_2009.gif) : :![[thin space (1/6-em)]](https://www.rsc.org/images/entities/char_2009.gif) 1 1 |
0.36 | 2.36 | 3.60 |
1![[thin space (1/6-em)]](https://www.rsc.org/images/entities/char_2009.gif) : :![[thin space (1/6-em)]](https://www.rsc.org/images/entities/char_2009.gif) 2 2 |
0.25 | 3.78 | 3.01 |
1![[thin space (1/6-em)]](https://www.rsc.org/images/entities/char_2009.gif) : :![[thin space (1/6-em)]](https://www.rsc.org/images/entities/char_2009.gif) 3 3 |
0.24 | 4.00 | 2.89 |
2.3 Sensing of low-level water in organic solvents
The attractive dynamic properties of metal-coordination bonds make the complexes highly interesting for preparing stimuli-responsive smart materials for such bonds provide unique environmental sensibility.52,53 Ln3+–N interactions are typically weaker than Ln3+–O interactions,54 which indicates that Eu3+–N coordination bonds in the complex in this study are easily affected by water molecules and hence the luminescence can tend to be quenched through vibrational coupling with high O–H vibration overtones in or near the first coordination spheres. Thus, the as-synthesized samples can be used to detect water content in organic solvents. Since we have known that the sample with L to Eu3+ molar ratio being 1![[thin space (1/6-em)]](https://www.rsc.org/images/entities/char_2009.gif) :
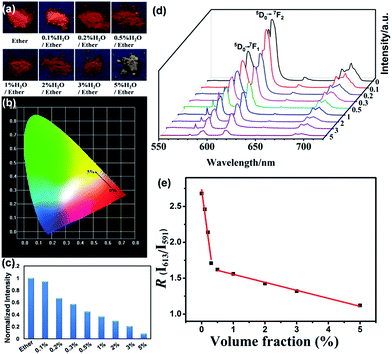
:![[thin space (1/6-em)]](https://www.rsc.org/images/entities/char_2009.gif) 1 (Eu(L)1) shows much stronger emission intensity and much longer decay times than that with other molar ratios, we therefore test the performance of Eu(L)1 as a luminescent sensor of moisture in organic solvents. The exposure of Eu(L)1 to the vapors of ether containing aliquots of water (0–5% v/v) for 20 min leads to obvious reduction in the brightness of the emission light and the remarkable changes in emission color as shown in Fig. 6a, which reveals that the bright emission color becomes yellowish when the water level in ether is up to 5%. The observed emission colors match well with the calculated chromaticity coordinates based on the CIE (Commission Internationaled’ Eclairage) chromaticity diagram and can be easily and directly observed by naked eyes under an UV lamp (Fig. 6b). Their corresponding emission intensity of 5D0 → 7F2 decreases gradually with the increase of water in ether as shown in Fig. 6c and d. The histogram in Fig. 6c clearly shows that even a very small amount (0.1%, v/v) of H2O to anhydrous ether cause about 6% decrease of the emission intensity. When the water content is up to 5% (v/v), the emission intensity is decreased to 8% of its original value. Furthermore, the emission intensity ratio R of 613 nm (5D0 → 7F2) and 591 nm (5D0 → 7F1) changes remarkably as the water content changes. It reduces from 2.65 for the pure ether to 1.17 for that containing 5% (v/v) water (Table S1, ESI†), indicating that the symmetry of the Eu3+ sites has changed remarkably, possibly caused by the coordination of water molecules to Eu3+ ions via the replacement of L, owing to the dynamical feature of N–Eu3+ coordination bonds. This can be further supported by the decrease of the luminescence decay time calculated from the decay curves as shown in Table S1.† Interestingly, two-separated linear fitting in Fig. 6e shows that R is changed linearly with the increasing water concentrations added to ether solution, the functions are shown in Table S2 (ESI†), with a correlation coefficient of 0.993. This indicates that Eu(L)1 is an excellent self-calibrated luminescent sensor for quantitative analysis of water in ether, which can make the water molecular detection independent of the local environment, thus conquering the main disadvantages of single emission intensity-based measurements.55,56
1 (Eu(L)1) shows much stronger emission intensity and much longer decay times than that with other molar ratios, we therefore test the performance of Eu(L)1 as a luminescent sensor of moisture in organic solvents. The exposure of Eu(L)1 to the vapors of ether containing aliquots of water (0–5% v/v) for 20 min leads to obvious reduction in the brightness of the emission light and the remarkable changes in emission color as shown in Fig. 6a, which reveals that the bright emission color becomes yellowish when the water level in ether is up to 5%. The observed emission colors match well with the calculated chromaticity coordinates based on the CIE (Commission Internationaled’ Eclairage) chromaticity diagram and can be easily and directly observed by naked eyes under an UV lamp (Fig. 6b). Their corresponding emission intensity of 5D0 → 7F2 decreases gradually with the increase of water in ether as shown in Fig. 6c and d. The histogram in Fig. 6c clearly shows that even a very small amount (0.1%, v/v) of H2O to anhydrous ether cause about 6% decrease of the emission intensity. When the water content is up to 5% (v/v), the emission intensity is decreased to 8% of its original value. Furthermore, the emission intensity ratio R of 613 nm (5D0 → 7F2) and 591 nm (5D0 → 7F1) changes remarkably as the water content changes. It reduces from 2.65 for the pure ether to 1.17 for that containing 5% (v/v) water (Table S1, ESI†), indicating that the symmetry of the Eu3+ sites has changed remarkably, possibly caused by the coordination of water molecules to Eu3+ ions via the replacement of L, owing to the dynamical feature of N–Eu3+ coordination bonds. This can be further supported by the decrease of the luminescence decay time calculated from the decay curves as shown in Table S1.† Interestingly, two-separated linear fitting in Fig. 6e shows that R is changed linearly with the increasing water concentrations added to ether solution, the functions are shown in Table S2 (ESI†), with a correlation coefficient of 0.993. This indicates that Eu(L)1 is an excellent self-calibrated luminescent sensor for quantitative analysis of water in ether, which can make the water molecular detection independent of the local environment, thus conquering the main disadvantages of single emission intensity-based measurements.55,56
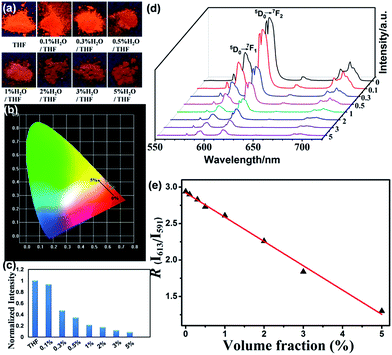
Eu(L)1 is also tested as a moisture sensor in THF. The photophysical parameters such as luminescence colors, emission intensity and chromaticity coordinates change along with the variation of water content in THF are shown in Fig. 7. The variations of R and luminescence lifetime of Eu(L)1 are decreased as water increases from 0% to 5% v/v (Table S3, ESI†). The linear relationship between R and the water molecular content in THF (0–5%, v/v) could be fitted to the function shown in Fig. 7e and Table S2 (ESI†).
2.4 Temperature-dependent photoluminescence
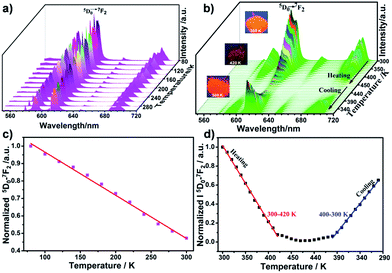
The luminescent behavior of the complex can also be tuned by temperature variation and the temperature dependent luminescence spectra of Eu(L)1 are shown in Fig. 8. When the temperature varies from 80 to 300 K (ΔT = 20 K), the emission peak remains unchanged, while the normalized luminescence intensity of 5D0 → 7F2 transition at 613 nm band is gradually decreased (Fig. 8a). The temperature (T1) can be linearly related to the luminescence intensity (I1) within the range from 80 to 300 K by eqn (1) with a correlation coefficient of 0.995 (Fig. 8b):| T1 = 491.1 − 405I1 | (1) |
Remarkably, approximately 53% of the luminescence intensity of the Eu3+ center decreased with a stepwise increase in temperature from 80 to 300 K, and the change in intensity ratio was 0.24% per K (Table S4, ESI†). In addition, the temperature sensibility of Eu(L)1 can further be confirmed by the luminescence lifetime, which is decreased from 0.22 ms to 0.18 ms when the temperature enhanced from 80 to 300 K.
The aforementioned properties make the as-synthesized complex Eu(L)1 a potential candidate for temperature-sensing from cryogenic temperatures to room temperature. Very interestingly, it shows excellent sensibility for the temperature range from room temperature up to 470 K. Fig. 8c shows that the luminescence intensity at 613 nm band decreases profoundly by more than 98% upon raising the temperature from 300 to 470 K. The luminescence intensity of Eu(L)1 gradually decreased with a stepwise increase in temperature. In addition, the change in luminescence performance was easily visible by the naked eye on excitation under UV lamp (Fig. 8c, inset). Moreover, the relation between the normalized luminescence intensity (I2) and temperature (T2) in the range from 300 K to 420 K (ΔT = 10 K) present a good linearity (eqn (2), R = 0.998, Fig. 8d):
| T2 = 427.4 − 125I2 | (2) |
The luminescence intensity decreases by 0.77% per K on increasing temperature (Table S4, ESI†), this indicating rather high sensitivity in wide temperature range from room temperature up to high temperatures.
Although several luminescence-based thermometers with a wide operating range have been reported,57–61 single Eu3+-containing luminescent thermometers with a linear response over the temperature range from cryogenic temperatures to high temperature are rarely reported. The sample we present in this work allows for the design of a thermometer with an excellent linear response to temperature over a wide range, from 80 to 420 K with a high relative sensitivity of 0.52% per K at 300 K and an unprecedented high sensitivity of 10.26% per K at 420 K (Fig. S3, ESI†).62–64 It is clear that these values are 5–40 times higher than which previously reported in ref. 65 and are rarely observed for luminescence thermometry. These results indicate that Eu(L)1 is an excellent and useful luminescent thermometer.
It worthy to note that the emission intensity of Eu(L)1 was almost fully quenched at 420 K as shown in Fig. 8c, which was normally caused by the thermal activation of nonradiative deactivation pathways.62,66,67 However, the dissociation of the Eu–L bond could not be excluded.65,68 The attractive dynamic property of Eu–L coordination bond makes Eu(L)1 reveal good temperature-dependent luminescence behavior. As shown in Fig. 9, heating and cooling can result in the dissociation and formation of the dynamic bond. To further verify the reversibility of the dynamic connection of Eu3+ and L, we also detect the luminescence behavior of the complex with a stepwise decrease in temperature from 450 to 300 K (ΔT = 10 K) after the environmental temperature of Eu(L)1 was heated to 470 K. Interesting, the emission intensity of Eu(L)1 was gradually increased and recovered to 66.3% of its original value as shown in Fig. 8d, implying that the re-formation of Eu3+–L complexes, which is in good agreement with our assumption. The relationships between the normalized luminescence intensity (I3) of the complex and temperature (T3) in cooling process were established and linearly fitted to the function shown in Table S4 (ESI†), with the correlation coefficient reach up to 0.998. The luminescence intensity decreases by 0.59% per K on stepwise decreasing temperature. The result indicates that Eu(L)1 also has high sensitivity in wide range of temperature in the cooling process.
3. Experimental
3.1 Materials
EuCl3·6H2O (99.99%) was purchased from Beijing HWRK Chem and L (96%) was purchased from Sigma-Aldrich. They were used without further purification.3.2 Mechanochemical synthesis of Eu(L)1
L (27.0 mg, 0.05 mmol) and EuCl3·6H2O (18.3 mg, 0.05 mmol) were manually ground in a mortar with a pestle for 10 min.3.3 Exposure to organic solvents (water content from 0 to 5% v/v)
The powder samples of Eu(L)1 were prepared for the detecting experiments. For each experiment, 200 mg Eu(L)1 were put in a small bottle and exposed to solvents (water content from 0% to 5%, v/v). The powder samples (Eu(L)1) and the small bottle were placed into a sealed container (about 100 mL), which contains about 4 mL organic solvent for 1 h.3.4 Characterization
Infrared (IR) spectra were obtained with a Bruker Vector 22 spectrophotometer by using KBr pellets for solid samples from 400 to 4000 cm−1 at a resolution of 4 cm−1. Elemental analysis was performed on an Elementar Vario EI system. SEM images were obtained from a FE-SEM (Hitachi S-4300) at an acceleration voltage of 10 kV. Samples on quartz substrate were directly put in the chamber of the instrument, for the photophysical measurements. The steady-state luminescence spectra and the lifetime measurements were measured on an Edinburgh Instruments FS920P spectrometer. Absolute quantum yield measurements were carried on the aforementioned fluorescence spectrophotometer equipped with an integrating sphere. A UV-visible Agilent Cray 100 spectrometer, with a quartz cuvette with path length 10 mm, was used to determine the wavelength of the maximum UV absorbance peak. The absorbance was measured from 200 to 800 nm.4. Conclusions
In summary, a solid state Eu3+ complex was successfully synthesized by mechanochemical synthetic method. Without using any solvents and requiring only a few minutes, the single-step mechanochemical reaction serves as a “green” approach to prepare complex by the self-assembly process between Eu3+ and bis-terpyridine compound. Remarkably, all photophysical data reported herein point towards the same conclusion that Eu(L)1 (ligand![[thin space (1/6-em)]](https://www.rsc.org/images/entities/char_2009.gif) :
:![[thin space (1/6-em)]](https://www.rsc.org/images/entities/char_2009.gif) Eu3+ = 1
Eu3+ = 1![[thin space (1/6-em)]](https://www.rsc.org/images/entities/char_2009.gif) :
:![[thin space (1/6-em)]](https://www.rsc.org/images/entities/char_2009.gif) 1) shows the best luminescence performance and well stimuli-responsiveness (including temperature, moisture). Eu(L)1 can act as a highly efficient luminescent sensor for detecting, in real time, traces of water (0.1–5% v/v) in ether and THF, which is based on the ratiometric luminescence determination method. Furthermore, Eu(L)1 reveals excellent linear correlation between emission intensity and temperature ratio from 80–300 K, and 300–420 K, with high relative sensitivity values of 0.52% per K at 300 K and 10.26% per K at 420 K, enabling it to be a candidate for luminescent thermometer. Surprisingly, the emission intensity of the complex can be recovered to 66.3% of its original value in the cooling process from 450 to 300 K, which is attributed to the re-formation of Eu–L, making Eu(L)1 as an unprecedentedly smart material. We believe that our strategy will open up a new perspective for the development of luminescent complexes in the near future.
1) shows the best luminescence performance and well stimuli-responsiveness (including temperature, moisture). Eu(L)1 can act as a highly efficient luminescent sensor for detecting, in real time, traces of water (0.1–5% v/v) in ether and THF, which is based on the ratiometric luminescence determination method. Furthermore, Eu(L)1 reveals excellent linear correlation between emission intensity and temperature ratio from 80–300 K, and 300–420 K, with high relative sensitivity values of 0.52% per K at 300 K and 10.26% per K at 420 K, enabling it to be a candidate for luminescent thermometer. Surprisingly, the emission intensity of the complex can be recovered to 66.3% of its original value in the cooling process from 450 to 300 K, which is attributed to the re-formation of Eu–L, making Eu(L)1 as an unprecedentedly smart material. We believe that our strategy will open up a new perspective for the development of luminescent complexes in the near future.
Acknowledgements
This work was financially supported by the National Natural Science Foundation of China (21271060, 21502039, 21236001, 21605036), the Hebei Natural Science Foundation (B2016202147, B2016202149), the Graduate outstanding innovative topics of Hebei Province (220056) and the Educational Committee of Hebei Province (LJRC021).References
- X. Huang, S. Han, W. Huang and X. Liu, Chem. Soc. Rev., 2012, 42, 173–201 RSC.
- S. Eliseeva and J. C. G. Buenzli, Chem. Soc. Rev., 2010, 39, 189–227 RSC.
- Y. Yang, Q. Zhao, W. Feng and F. Li, Chem. Rev., 2012, 113, 192–270 CrossRef PubMed.
- Y. Ding, Y. Wang, H. Li, Z. Duan, H. Zhang and Y. Zheng, J. Mater. Chem., 2011, 21, 14755–14759 RSC.
- N. Sabbatini, M. Guardigli and J. M. Lehn, Coord. Chem. Rev., 1993, 123, 201–228 CrossRef CAS.
- D. Yang, Y. Wang, L. He and H. Li, ACS Appl. Mater. Interfaces, 2016, 8, 19709–19715 CAS.
- C. Tschierske, Angew. Chem., Int. Ed., 2000, 39, 2454–2458 CrossRef CAS PubMed.
- Q. Zheng, Z. Ma and S. Gong, J. Mater. Chem. A, 2016, 4, 3324–3334 CAS.
- T. Suzuki, T. Sato, J. Zhang, M. Kanao, M. Higuchi and H. Maki, J. Mater. Chem. C, 2016, 4, 1594–1598 RSC.
- R. K. Pandey, M. Delwar Hossain, C. Chakraborty, S. Moriyama and M. Higuchi, Chem. Commun., 2015, 51, 11012–11014 RSC.
- R. K. Pandey, M. D. Hossain, S. Moriyama and M. Higuchi, J. Mater. Chem. A, 2014, 2, 7754–7758 CAS.
- A. Wild, A. Winter, F. Schlutter and U. S. Schubert, Chem. Soc. Rev., 2011, 40, 1459–1511 RSC.
- S. Hornig, I. Manners, G. R. Newkome and U. S. Schubert, Macromol. Rapid Commun., 2010, 31, 771–771 CrossRef CAS PubMed.
- C. Rajadurai, O. Fuhr, R. Kruk, M. Ghafari, H. Hahn and M. Ruben, Chem. Commun., 2007, 25, 2636–2638 RSC.
- A. Duerrbeck, S. Gorelik, J. Hobley, J. E. Wu, A. Hor and N. Long, Chem. Commun., 2015, 51, 8656–8659 RSC.
- O. Kotova, R. Daly, C. M. G. dos Santos, M. Boese, P. E. Kruger, J. J. Boland and T. Gunnlaugsson, Angew. Chem., Int. Ed., 2012, 51, 7208–7212 CrossRef CAS PubMed.
- T. Sato and M. Higuchi, Chem. Commun., 2012, 48, 4947–4949 RSC.
- G. Lyu, Q. Zhang, J. I. Urgel, G. Kuang, W. Auwarter, D. Ecija, J. V. Barth and N. Lin, Chem. Commun., 2016, 52, 1618–1621 RSC.
- M. Martínez-Calvo, O. Kotova, M. E. Möbius, A. P. Bell, T. McCabe, J. J. Boland and T. Gunnlaugsson, J. Am. Chem. Soc., 2015, 137, 1983–1992 CrossRef PubMed.
- J. R. Kumpfer, J. Jin and S. J. Rowan, J. Mater. Chem., 2010, 20, 145–151 RSC.
- W. Weng, J. B. Beck, A. M. Jamieson and S. J. Rowan, J. Am. Chem. Soc., 2006, 128, 11663–11672 CrossRef CAS PubMed.
- A. J. McConnell, C. S. Wood, P. P. Neelakandan and J. R. Nitschke, Chem. Rev., 2015, 115, 7729–7793 CrossRef CAS PubMed.
- P. Chen, Q. Li, S. Grindy and N. Holten-Andersen, J. Am. Chem. Soc., 2015, 137, 11590–11593 CrossRef CAS PubMed.
- Z. Zhang, Y.-N. He, L. Liu, X.-Q. Lu, X.-J. Zhu, W.-K. Wong, M. Pan and C.-Y. Su, Chem. Commun., 2016, 52, 3713–3716 RSC.
- V. A. Friese and D. G. Kurth, Coord. Chem. Rev., 2008, 252, 199–211 CrossRef CAS.
- P. Wei, X. Yan and F. Huang, Chem. Soc. Rev., 2015, 44, 815–832 RSC.
- G. Yu, K. Jie and F. Huang, Chem. Rev., 2015, 115, 7240–7303 CrossRef CAS PubMed.
- X. Ma, G. K. Lim, K. D. M. Harris, D. C. Apperley, P. N. Horton, M. B. Hursthouse and S. L. James, Cryst. Growth Des., 2012, 12, 5869–5872 CAS.
- D. E. Crawford and J. Casaban, Adv. Mater., 2016, 28, 5747–5754 CrossRef CAS PubMed.
- A. Kobayashi, T. Hasegawa, M. Yoshida and M. Kato, Inorg. Chem., 2016, 55, 1978–1985 CrossRef CAS PubMed.
- A. D. Katsenis, A. Puškarić, V. Štrukil, C. Mottillo, P. A. Julien, K. Užarević, M.-H. Pham, T.-O. Do, S. A. J. Kimber, P. Lazić, O. Magdysyuk, R. E. Dinnebier, I. Halasz and T. Friščić, Nat. Commun., 2015, 6, 1–6 Search PubMed.
- S. L. James, C. J. Adams, C. Bolm, D. Braga, P. Collier, T. Friscic, F. Grepioni, K. D. M. Harris, G. Hyett, W. Jones, A. Krebs, J. Mack, L. Maini, A. G. Orpen, I. P. Parkin, W. C. Shearouse, J. W. Steed and D. C. Waddell, Chem. Soc. Rev., 2012, 41, 413–447 RSC.
- P. J. Beldon, L. Fábián, R. S. Stein, A. Thirumurugan, A. K. Cheetham and T. Friščić, Angew. Chem., Int. Ed., 2010, 49, 9640–9643 CrossRef CAS PubMed.
- K. Užarević, T. C. Wang, S.-Y. Moon, A. M. Fidelli, J. T. Hupp, O. K. Farha and T. Friščić, Chem. Commun., 2016, 52, 2133–2136 RSC.
- T. Friščić, D. G. Reid, I. Halasz, R. S. Stein, R. E. Dinnebier and M. J. Duer, Angew. Chem., 2010, 122, 724–727 CrossRef.
- T. Friščić, Chem. Soc. Rev., 2012, 41, 3493–3510 RSC.
- A. L. Garay, A. Pichon and S. L. James, Chem. Soc. Rev., 2007, 36, 846–855 RSC.
- S. L. James, C. J. Adams, C. Bolm, D. Braga, P. Collier, T. Friščić, F. Grepioni, K. D. Harris, G. Hyett and W. Jones, Chem. Soc. Rev., 2012, 41, 413–447 RSC.
- M. Ferguson, N. Giri, X. Huang, D. Apperley and S. L. James, Green Chem., 2014, 16, 1374–1382 RSC.
- E. C. Constable, Chem. Soc. Rev., 2007, 36, 246–253 RSC.
- D. Wang, H. Wang and H. Li, ACS Appl. Mater. Interfaces, 2013, 5, 6268–6275 CAS.
- P. Zhang, Y. Wang, H. Liu and Y. Chen, J. Mater. Chem., 2011, 21, 18462–18466 RSC.
- R. López, D. Villagra, G. Ferraudi, S. Moya and J. Guerrero, Inorg. Chim. Acta, 2004, 357, 3525–3531 CrossRef.
- A. Duerrbeck, S. Gorelik, J. Hobley, A. M. Yong, G. S. Subramanian, A. Hor and N. Long, J. Mater. Chem. C, 2015, 3, 8992–9002 RSC.
- P. Cao, O. Khorev, A. Devaux, L. Sägesser, A. Kunzmann, A. Ecker, R. Häner, D. Brühwiler, G. Calzaferri and P. Belser, Chem.–Eur. J., 2016, 22, 4046–4060 CrossRef CAS PubMed.
- A. Devaux, G. Calzaferri, P. Belser, P. Cao, D. Brühwiler and A. Kunzmann, Chem. Mater., 2014, 26, 6878–6885 CrossRef CAS.
- M. P. Oude Wolbers, F. C. van Veggel, B. H. Snellink-Ruël, J. W. Hofstraat, F. A. Geurts and D. N. Reinhoudt, J. Am. Chem. Soc., 1997, 119, 138–144 CrossRef.
- C. Bischof, J. Wahsner, J. Scholten, S. Trosien and M. Seitz, J. Am. Chem. Soc., 2010, 132, 14334–14335 CrossRef CAS PubMed.
- D. D'Alessio, S. Muzzioli, B. W. Skelton, S. Stagni, M. Massi and M. I. Ogden, Dalton Trans., 2012, 41, 4736–4739 RSC.
- D. Yang, Y. Wang, Y. Wang, Z. Li and H. Li, ACS Appl. Mater. Interfaces, 2015, 7, 2097–2103 CAS.
- D. Yang, Y. Wang, Y. Wang and H. Li, Sens. Actuators, B, 2016, 235, 206–212 CrossRef CAS.
- P. Chen and N. Holten-Andersen, Adv. Opt. Mater., 2015, 3, 1041–1046 CrossRef CAS.
- M. Chiper, R. Hoogenboom and U. S. Schubert, Macromol. Rapid Commun., 2009, 30, 565–578 CrossRef CAS PubMed.
- J. H. Forsberg, Coord. Chem. Rev., 1973, 10, 195–226 CrossRef CAS.
- P. Li, Z. Li and H. Li, Adv. Opt. Mater., 2016, 4, 156–161 CrossRef CAS.
- M. Yao and W. Chen, Anal. Chem., 2011, 83, 1879–1882 CrossRef CAS PubMed.
- T. Wang, P. Li and H. Li, ACS Appl. Mater. Interfaces, 2014, 6, 12915–12921 CAS.
- Z. Li, Z. Hou, D. Ha and H. Li, Chem.–Asian J., 2015, 10, 2720–2724 CrossRef CAS PubMed.
- C. D. Brites, P. P. Lima, N. J. Silva, A. Millán, V. S. Amaral, F. Palacio and L. D. Carlos, Nanoscale, 2013, 5, 7572–7580 RSC.
- X. Xu, Z. Wang, P. Lei, Y. Yu, S. Yao, S. Song, X. Liu, Y. Su, L. Dong and J. Feng, ACS Appl. Mater. Interfaces, 2015, 7, 20813–20819 CAS.
- K. Miyata, Y. Konno, T. Nakanishi, A. Kobayashi, M. Kato, K. Fushimi and Y. Hasegawa, Angew. Chem., Int. Ed., 2013, 52, 6413–6416 CrossRef CAS PubMed.
- S. N. Zhao, L. J. Li, X. Z. Song, M. Zhu, Z. M. Hao, X. Meng, L. L. Wu, J. Feng, S. Y. Song and C. Wang, Adv. Funct. Mater., 2015, 25, 1463–1469 CrossRef CAS.
- A. Cadiau, C. D. Brites, P. M. Costa, R. A. Ferreira, J. Rocha and L. D. Carlos, ACS Nano, 2013, 7, 7213–7218 CrossRef CAS PubMed.
- C. D. Brites, P. P. Lima, N. J. Silva, A. Millán, V. S. Amaral, F. Palacio and L. D. Carlos, Nanoscale, 2012, 4, 4799–4829 RSC.
- X.-d. Wang, O. S. Wolfbeis and R. J. Meier, Chem. Soc. Rev., 2013, 42, 7834–7869 RSC.
- Y. Cui, F. Zhu, B. Chen and G. Qian, Chem. Commun., 2015, 51, 7420–7431 RSC.
- X. Rao, T. Song, J. Gao, Y. Cui, Y. Yang, C. Wu, B. Chen and G. Qian, J. Am. Chem. Soc., 2013, 135, 15559–15564 CrossRef CAS PubMed.
- J. B. Beck and S. J. Rowan, J. Am. Chem. Soc., 2003, 125, 13922–13923 CrossRef CAS PubMed.
Footnote |
| † Electronic supplementary information (ESI) available. See DOI: 10.1039/c6ra28099d |
| This journal is © The Royal Society of Chemistry 2017 |

