DOI:
10.1039/C6RA28057A
(Paper)
RSC Adv., 2017,
7, 16049-16056
Effect of surface physicochemical properties on the flocculation behavior of Bacillus licheniformis†
Received
12th December 2016
, Accepted 6th March 2017
First published on 13th March 2017
Abstract
The flocculation behaviors of B. licheniformis CGMCC 2876 under different culture conditions were studied in this paper. In the non-bioflocculant producing process, the flocculability of B. licheniformis was enhanced with an increase of ionic strength from 0.001 to 0.3 M, and similar results were observed with the decrease of pH from 7 to 4. The interfacial free energy between cells was 38.8 mJ m−2, suggesting the cells with hydrophilic surfaces repelled each other. In the bioflocculant producing process, extended DLVO theory was adopted to describe the flocculation behavior. The changes in the flocculation behavior of bacterial cells were primarily attributed to the hydrophobic attraction energy interaction between cells with the lowest value of −104.1 mJ m−2. Combined with scanning electron microscopy (SEM), transmission electron microscopy (TEM) and X-ray photoelectron spectroscopy analysis, the cell auto-flocculation of B. licheniformis was finally attributed to the hydrophobic polysaccharide secreted as a cell capsule, which led to an increased surface hydrophobicity, thus increasing the flocculation potential.
1. Introduction
Flocculation is seen as an easy, low-cost and eco-friendly process of cell separation, which does not require energy input.1 It has some advantages for industrial processes because of the simplicity of liquid/solid separation and the ease of cell mass retention in the reactor.2 In addition, some flocculation behaviors can play an important role beyond the cell separation process; such as in the case of brewing industry, where the failure of yeasts to flocculate can adversely affect beer flavor characteristics.3 As far as we know, flocculable cells are mainly reported with yeasts, which have been used for industrial purposes, for example continuous ethanol production from aggregated yeast and methane fermentation with an upflow anaerobic sludge-blanket reactor.4,5
As for bacteria, some studies about the flocculation ability have also been done, for instance, the photosynthetic bacterium, R. acidophila and Rhodovulum sp., and the activated sludge flocs consisting of various bacteria.2,6–8 However, the flocculation characteristics and mechanism in bacteria cells has not been clearly explored.
The relationship between flocculence and cell hydrophobicity was found by Amory et al.9,10 Also the ionic strength, surface zeta potential and extracellular polymeric substances have been reported to be associated with the flocculation behaviors of Pseudomonas putida KT2442, Lactococcus lactis and some other marine bacteria.11–14 Correlations have been found between the microbial surface structures and the surface properties, for instance, the surface negative charges of Bacillus subtilis were attributed to phosphate groups, and the surface hydrophilicity of Escherichia coli was associated with high levels of (C–(O,N)) and (OH–(C–O–C)) functional groups while the cell surface hydrophobicity was associated with (C–(C,H)) functional groups.15–17
In our previous study, two different types of extracellular bioflocculants were determined in the culture of B. licheniformis, which have been proved their potential applications in sugar refinery industry.18,19 However, the separation of bacteria cells from the culture broth was hard due to the high viscosity of the solution. Thus, the cell flocculation behavior of B. licheniformis was evaluated in this research. The cell surface was characterized and the flocculation behavior of bacteria cells were discussed with extended DLVO (XDLVO) theory. This research will not only offer valuable results in bioflocculant production, but also provide important foundation for studies on the flocculation process of bacteria cells instead of yeast cells.
2. Materials and methods
2.1 Strain and culture conditions
B. licheniformis, isolated in our laboratory and stored in the China General Microbiological Culture Collection Centre (CGMCC, Beijing, China) with the accession number 2876, was adopted in the present study. The compositions of the cultivation medium and cultivation conditions for B. licheniformis can be found in our previous paper.18 The cells were collected by centrifugation at 9000 rpm for 20 min at given intervals and washed twice with physiological saline. Thereafter, the cell pellets were used in the analysis as follows.
2.2 Microbial flocculation test
In the present study, an index, F, was measured to describe the flocculating ability of B. licheniformis.20 The harvested cells were re-suspended in NaCl or CaCl2 electrolyte solutions with various concentrations of 0.001, 0.003, 0.01, 0.03, 0.1, 0.3, 1, 3 and 5 mol L−1. The optical density of the cell suspension was measured at 650 nm (A0) using a UV-1800 spectrophotometer (Shimadzu). Thereafter, the B. licheniformis suspensions were centrifuged at 1000 rpm for 2 min and the supernatant was measured again at 650 nm (At). Then, the F value can be calculated as:| | |
F% = (1 − At/A0) × 100
| (1) |
The effect of pH on flocculating ability of B. Licheniformis was examined using cell suspensions with pH 4–9, which were adjusted by adding 1 mol L−1 HCl or NaOH.
2.3 Surface characteristics
2.3.1 Contact angle determination. The apparent advancing contact angle of the cells was measured using a contact angle analyzer.21 Briefly, the washed cells were captured on a cellulose acetate membrane filter (pore diameter 0.45 μm) by underpressure filtration. Homogeneous cellular layers were washed twice with ultrapure water and then placed in a Petri dish on 1% (w/v) agar plate containing 10% (v/v) glycerol to preserve a constant moisture content. The membranes were placed on glass sides and allowed to air dry for 30 to 90 min. Contact angles was directly measured at 25 °C, employing the sessile drop technique with a droplet of a specified polar or non-polar solvent. The polar and non-polar solvents used in the present study can be seen in Table S1.†
2.3.2 Zeta potential measurements. The same suspension used for the flocculation test was also used for zeta potential measurements using a Nano-ZS and MPT-2 (Malvern, UK) to get information on the net charge of cells. In the present study, the zeta potentials of cell suspension were analyzed simultaneously as the function of culture time.
2.3.3 Cell surface thermodynamic evaluation. The surface tension of a substance i comprises the apolar (LW) component and the polar (AB) component, which can be expressed aswhere the γABi component composed of the electron-acceptor surface tension parameter (designated as γi+) and electron-donor parameter (designated as γi−) can be defined as:22| |
 | (3) |
The three unknown entities γLWB, γB+ and γB− of B. Licheniformis can be calculated by the Young's equation23
| |
 | (4) |
where
θ is the advancing contact angle between the cell surfaces and drops of liquid L and can be determined by the contact angle measurement method introduced above.
Then, the interfacial tension between cell surfaces and water, γBL, can be calculated by eqn (5)–(7):24
| |
 | (6) |
| |
 | (7) |
Combined with the above equations, the free interaction energy between cells immersed in water is divided into two parts: the Lifshitz–van der Waals (LW) component and the acid–base (AB) component.25
| | |
ΔGBLB = ΔGLWBLB + ΔGABBLB = −2γLWBL − 2γABBL
| (8) |
2.3.4 X-ray photoelectron spectroscopy (XPS) analysis. In the present study, X-ray photoelectron spectroscopy analyses were performed as described by Amory et al., which had been improved and verified to ensure the repeatability and reliability.9 The harvested cell pellet was resuspended in 2 mL of deionized water, quickly immersed in liquid nitrogen, and freeze-dried. Subsequently, the obtained powder was mounted on standard studs by using double side adhesive tape. The measurements were carried out on a PHI QUANTUM 2000 instrument with a monochromatised microfocused Al X-ray source at 10 kV and 20 mA. Each analysis consisted of a wide survey scan (pass energy 187.85 eV, step size 0.8 eV) and a high-resolution scan (pass energy 58.70 eV, step size 0.1 eV).
2.4 Flocculating activity of the culture broth
The modified method was used to determine the flocculating activity of the fermentation broth.26 Kaolin clay suspension was formed by suspending 0.2 g kaolin clay in 40 mL distilled water. After mixing, the suspension was diluted to 50 mL with 0.2 g L−1 of CaCl2 and certain amount of bioflocculant (fermentation broth). For each run of the flocculation test, the reaction was stirred at 300 rpm for 5 min and then allowed to settle freely for 5 min at room temperature. By measuring the decrease in turbidity in the upper phase of the suspension, only 0.1 mL liquid in the top of the 50 mL suspension was transferred to micro cells and then its turbidity was measured. Flocculating activity can be expressed as the flocculating rate (FR), which is calculated by| | |
FR (%) = ((A − B)/A) × 100
| (9) |
where A and B are the optical density values at 550 nm of the control and the sample, respectively.
2.5 The classical DLVO and the XDLVO approach
According to the classical DLVO theory, the total interaction energy (Vt) between two cells in a water can be regard as the sum of the Van der Waals attractive energy (Vd) and the electrostatic repulsive energy (Ve):27,28with| |
 | (11) |
| |
 | (12) |
where ABLB is the Hamaker constant and its value can be determined from the equation as following:29| |
 | (13) |
where, the value of γLWB can be calculated from eqn (4), l0 (≈0.157 nm) is the minimum equilibrium distance,30 ϕδ is the surface potential which is often represented by the zeta potential of the cell, κ is the reciprocal of the double-layer thickness, R, with the assumed value of 2 μm for B. Licheniformis, is the cell radius and H represents the separation distance between two cells.
However, since the classical DLVO theory fails to predict the stabilities of very hydrophilic and very hydrophobic particle suspension,31 hence the acid–base interaction (Vab) is introduced into the following XDLVO theory:32
with
| |
 | (15) |
where

is defined in
eqn (8) and the value of the decay length
λ which is controlled both by the particle size and the ionic strength of the suspensions varies from 0.6 nm to 13 nm.
30,33
3. Results and discussion
3.1 DLVO approach to cellular interactions in non-bioflocculant producing process
3.1.1 Effects of ionic strength on the flocculability of B. licheniformis. Fig. 1(a) showed that the zeta potential of B. licheniformis cultured in non-bioflocculant producing medium, increased from −35.1 mV to zero below (−0.6 mV) with an increase of NaCl concentration from 0.001 to 5 M. This was caused by the compression of the diffuse double layer (κ−1). Zeta potentials in CaCl2 electrolyte solution were lower than those in NaCl electrolyte solutions at the same ionic strength, indicating that Ca2+ has a stronger compression ability on κ−1 than Na+. The flocculability of B. licheniformis in various ionic strength were shown in Fig. 1(b). Both in NaCl and CaCl2 solutions, the flocculability, expressed as F, increased with the increase of ionic strength from 0.001 to 0.3 M, then decreased sharply with a further increase in ionic strength over 0.3 M. The peak value of F (<30) suggested the poor flocculability of B. licheniformis in non-bioflocculant producing process.
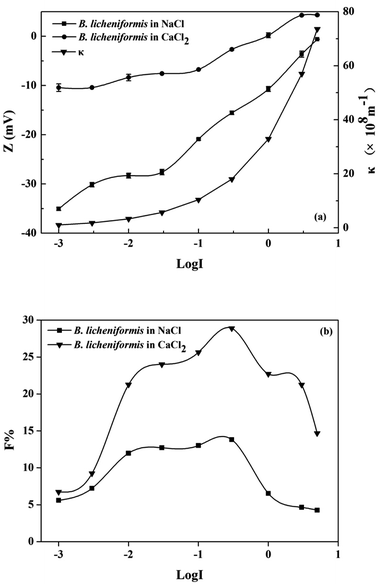 |
| | Fig. 1 Effect of ionic strength on the (a) zeta potential, κ and (b) flocculability of B. licheniformis. | |
The variations of potential energy between B. licheniformis cells at different ionic strengths were described with classical DLVO theory (Fig. S1†). With the increase of electrolyte concentration from 0.003 to 0.3 M, the diffuse double layer was compressed and zeta potential decreased, hence the contribution of electrostatic repulsive energy to the total interaction energy became less and the maximum energy barrier dropped from 2188 to 116 kT. However, the flocculation performance of B. Licheniformis was still poor because even the lowest potential barrier (116 kT) is still ten times higher than the critical flocculation energy barrier (10 kT), beyond which the hydrophobic colloidal particles were always difficult to flocculate with each other.10,28 In spite of this, the energy barriers between cells would be well predicted with the classical DLVO theory at an ionic strength from 0.001 to 0.3 M. But at higher ionic strength, cell flocculability deviated from the predicted curve as an additional repulsive hydration force might play an important role between cells.10
3.1.2 Effects of pH on the flocculability of B. licheniformis. The zeta potentials and flocculability of B. licheniformis as a function of pH were shown in Fig. 2(a). Zeta potential decreased with an increase in pH from 4 to 7. This was attributed to the adsorption of H+, a potential-determining ion.34 Similar changes were found with F because the electrostatic repulsive energy was reduced with the increased cellular zeta potential according to the classical DLVO theory.25 The minimum value of F was 12.1 at pH 7. Both zeta potential and flocculability of the cells increased with the increase of pH from 7 to 9 afterwards. Similar phenomenon was reported by Lin et al. that the adsorption of Pseudomonas putida on minerals varied with pH values, which was probably related to the changing of surface properties.35
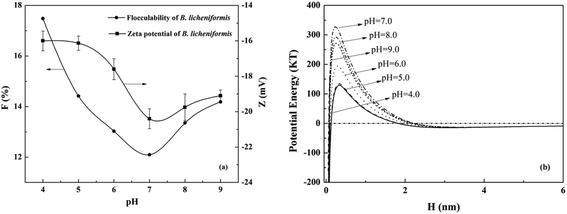 |
| | Fig. 2 Effects of pH on the (a) zeta potential, flocculability and (b) DLVO potential energy of B. licheniformis in 0.3 M NaCl solution. | |
Using DLVO theory, the energy barriers at different pH were described in Fig. 2(b). The effects of ionic strength on the DLVO energy barrier Vt and flocculability F were much stronger than that of pH. Under different pH conditions, the contribution of Vd to the total interaction energy of B. licheniformis was invariant, while that of Ve was changing (Fig. S2†). Thus, this difference led to different F at different pH values. As shown in eqn (11), the effective Hamaker constant (ABLB) was the main factor that governs Va. The apolar component of the B. licheniformis surface tension (30.4 mJ m−2), which controls the value of ABLB (eqn (13)), showed no much difference with that of water (21.8 mJ m−2). Thus ABLB was 1.32 × 10⁻²¹ J, even lower than 10−20 J which was mostly used in previous bacterial studies.36,37 Consequently, the contribution of Vd can be neglected and the cellular suspensions kept stable in our study. There has been report that the attractions between cells were primarily caused by Van der Waals attractive energy which were typically independence of pH and ionic strength based on DLVO theory.12
3.2 Contact angles and surface thermodynamics of B. licheniformis
In principle, the contact angle ranged from 0 to 180°, and the cell surfaces with water contact angle lower than 90° could be designated as hydrophilic.38 Also, the hydrophilic cells were those with ΔGBLB > 0, whereas hydrophobic cells were those with ΔGBLB < 0.39 The surface free energies of B. licheniformis were presented in Table 1. Both the water contact angle and interfacial free energy indicated that the cell surface was hydrophilic. The surface free energy connoted the repulsion between cells. Generally, the Lifshitz–van der Waals component (ΔGLWBLB) is negative, responsible for cell attraction, but ΔGABBLB can be either repulsive or attractive.40 As for B. licheniformis, the value of ΔGLWBLB was −1.42 mJ m−2 because of similar apolar (LW) surface tension component to that of water. The repulsive acid–base component (ΔGABBLB) of 40.2 mJ m−2 dominated in the cell to cell interaction energy. Therefore, the suspension of B. Licheniformis had a flocculability of no more than 30%. This could be the primary cause for the poor flocculating ability of the bacterial cells.
Table 1 Contact angles, surface tension and surface energy of B. licheniformis obtained in the present experimentsa
| Contact angle (°) |
Surface tension and surface free energy of B. licheniformis and their components (mJ m−2) |
| Wa, water; Fo, formamide; Br, α-bromonaphthalene. |
| θWa |
45.6 |
B. licheniformis |
γB |
γLWB |
γABB |
| 30.8 |
30.4 |
0.40 |
| θFo |
55.0 |
B. licheniformis–water |
γBL |
γLWBL |
γABBL |
| −19.4 |
0.71 |
−20.1 |
| θBr |
48.4 |
B. licheniformis–B. licheniformis |
ΔGBLB |
ΔGLWBLB |
ΔGABBLB |
| 38.8 |
−1.42 |
40.2 |
3.3 Flocculation characterization of B. licheniformis in the bioflocculant producing process
3.3.1 The contact angles and zeta potentials. Time courses of zeta potentials of the cells along with flocculating activity of the fermentation broth and glucose consumption were shown in Fig. 3(a). The measured temporal variations of microbial concentration of B. licheniformis during the bioflocculant producing process indicated that the exponential growth phase ended at the end of the 24th hour of cultivation time (Fig. S3†). Glucose was consumed rapidly and the flocculating activity of the culture broth increased to 83% in the first 16 hours, meanwhile zeta potentials decreased from −36.5 to −48.3 mV in the first 16 hours, then jumped to −17.2 mV near the end of the exponential growth phase period before decreasing. As shown in Fig. 3(b), the water contact angle raised from 63.9 to 119.0° at the 14th hour, which indicated that the cell surface was starting to change from hydrophilic to hydrophobic in the first 14 hours and thus the cells would change from repulsive to attractive with each other. This result was further explained with the cellular surface free energy later.
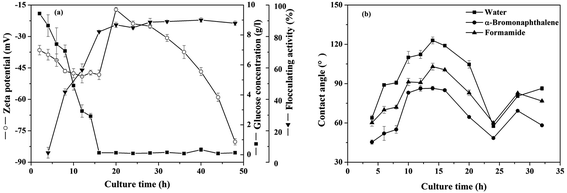 |
| | Fig. 3 Temporal variations of (a) the zeta potentials, residual glucose concentration, flocculating activity and (b) contact angles on bacterial lawns for B. licheniformis during the bioflocculant producing process. | |
3.3.2 Quantification of the surface thermodynamics. It was already proved that the cellular surface thermodynamics changed at different growth phase, such as the decrease in hydrophobicity of Azospirillum brasilens during growth and the changing of the interfacial free energy from negative to positive for Ralstonia eutropha in its entire growth phase.41,42 As shown in Fig. 4(a)–(d), the cellular surface tension and free energy of B. licheniformis were calculated. Van Oss had previously suggested that γLWB values for most hydrophilic biological material surfaces was 40 mJ m−2 with minor variability.40 As shown in Fig. 4(b), a γLWB value of 30 mJ m−2 was obtained only at the first 8 hours of the growth phase, which was comparable to that reported by Van Oss. Then, γLWB decreased to nearly 10 mJ m−2 when bioflocculant was produced at the stationary phase, which indicated that the hydrophilic parts of the cellular surfaces decreased. It is worth noting that the polar (AB) component gave almost no contribution to the cell surface tension because the cell surface belonged to the electron donor with no electron-acceptor capacity (Fig. 4(a)). Thus, the surface tension was the same as the apolar (LW) component. These style substances were always described as monopoles, with a strong γB+ or a strong γB− parameter, but these parameters, in the absence of a surface tension parameter of the opposite sign, do not contribute to the energy of flocculation.22 Even so, the γB− exhibited a significantly change compared with γB+, reflecting the variation of cell surface structure, i.e., the functional groups such as RCOH and RCOOH favor γB−, while the functional groups such as –CH![[double bond, length as m-dash]](https://www.rsc.org/images/entities/char_e001.gif) CH– and
CH– and ![[double bond splayed left]](https://www.rsc.org/images/entities/char_e009.gif) C
C![[double bond, length as m-dash]](https://www.rsc.org/images/entities/char_e001.gif) CH2– weaken γB−.43
CH2– weaken γB−.43
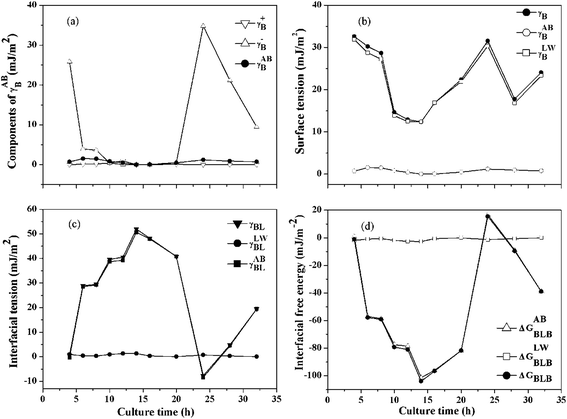 |
| | Fig. 4 Surface thermodynamics parameters of B. licheniformis during the bioflocculant producing process: (a) components of γABB, (b) surface tension of bacteria, (c) interfacial tension between bacteria and water, (d) interfacial free energy between bacteria immersed in water. | |
In contrast with the polar (AB) component (γLWBL), the acid–base (AB) component (γABBL) could be negative or positive as shown in Fig. 4(c). With γABBL > 0, ΔGABBLB < 0, the cells immersed in water attracted each other and the attractive energy belonged to the hydrophobic attraction energy, even electrical surface charges were presented on the cellular surfaces and vice versa.44 As shown in Fig. 4(d), the contribution of ΔGLWBLB could be neglected because of the great changing in ΔGABBLB. So the values of ΔGBLB were the same as that of ΔGABBLB, and the maximum change of ΔGBLB occurred at the 14th hour, which indicated that the hydrophobic parts of cell surface raised and cell flocculation occurred at the exponential growth phase. The cellular surfaces started to switch from hydrophilic to hydrophobic and the role of the hydrophobic attraction energy became more important gradually.
3.4 The XDLVO approach to cellular interactions in the bioflocculant producing process
The images of Fig. 5 showed the most cell aggregation at the 16th hour during growth. This was caused by the rise of hydrophobicity of cell surface. From TEM images, capsules were found on the cell surface during bioflocculant production, which contributed to the surface hydrophobic properties.
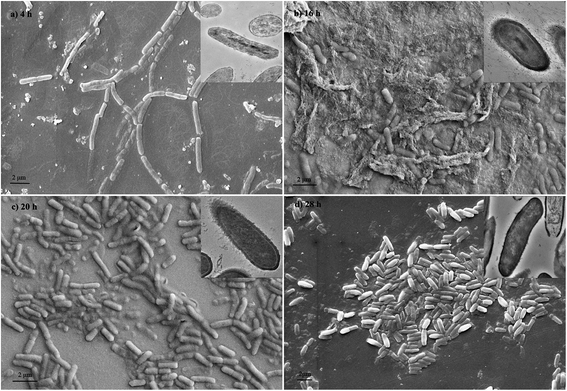 |
| | Fig. 5 Scanning electron micrographs and transmission electron microscopy (in the top right corner) photos of B. Licheniformis at different growth phase. | |
Based on classical DLVO theory, the energy barriers were always higher than 1500 kT (Fig. S4†) during the whole process of bioflocculant production. This was in contrast to the phenomena observed by using scanning electron microscope. Nevertheless, based on the XDLVO theory, where the acid–base energy (Vab) was included in eqn (14), the energy barriers became lower from the 6th to 14th hour, resulting in easier flocculation behavior. Cell flocculation was more obvious at an energy barrier of 6.4 kT at the 8th hour than at an energy barrier of 16.6 kT at the 6th hour (higher than the critical energy barrier of flocculation 10 kT).10 Similarly, the energy barriers vanished after 10 hours of cultivation, demonstrating that the cells could easily flocculate. These were in quite agreement with the experimental results of ΔGBLB, which proved that XDLVO theory was more suitable to describe the flocculation behavior of B. licheniformis cells during the process of bioflocculant production.
In classical DLVO theory, the bacteria cells were assumed perfectly smooth surfaces,45 which was quite a different case with B. licheniformis CGMCC 2876 when capsule was formed in the bioflocculant producing process. On the other hand, XDLVO equation, including an additional acid–base interaction item depending on the acid–base surface energy component, could well elucidate the surface characteristics and flocculability of B. licheniformis cells in the bioflocculant producing process. The item of the acid–base interactions in the equation exerted a significant decrease to the total energy barrier, which was caused by the negative acid–base interactions from the 6th to 14th hour of cultivation (Fig. S5†). Based on the surface thermodynamics of B. licheniformis, the cells were strong electron donors, thus had the acid–base surface energy component,46 which inevitably generated negative and attractive acid–base interactions between B. licheniformis.
3.5 Relationship between the flocculation behavior and cell surface compositions
XPS could provide an elemental analysis of the outmost layer of the bacterial cell with a depth 2–5 nm owing to inelastic scattering of the electrons in the sample.47 Since Baddiley et al. reported the use of XPS analysis for the study of bacteria in 1973, there have been many applications of XPS to microorganism.48–50 Three equations were adopted in the present analysis:| | |
O/C = 0.325(CPr/C) + 0.833(CPs/C)
| (17) |
| | |
1 = CPr/C + CPs/C + CCH/C
| (18) |
where CPr, CPs, and CCH are the atomic concentrations of carbon present in peptides, polysaccharides, and hydrocarbon-like products, respectively. N/C and O/C are atomic concentration ratios of oxygen and nitrogen, respectively, with respect to carbon.
Results showed that the percentage of proteins on cell surface fell from 56.0% at the 4th hour to 19.3% at the 14th hour. Meanwhile, the percentages of polysaccharides and lipids rose to 46.2% and 34.5%, respectively, which may contribute to the increased hydrophobicity of cell surface (Fig. S6†). Then, the increase in the content of proteins from the 14th hour to the 16th hour, especially near the latter time of the 16th hour of cultivation, gave rise to the reduction of water contact angle and the increase of ΔGBLB slightly as shown in Fig. 3 and 4, respectively. Further calculation suggested that the increase of protein produced a linear decrease of water contact angle and increase of interfacial free energy in exponential phase. For the increase of polysaccharide, did the opposite (Fig. S7†). Lipids always had been reported to be hydrophobic.24,51
As the extracellular polymeric substance is multicomponent soft materials with microstructures that are not fixed in time, the bacterial surface hydrophobicity and flocculation behaviors are always different in the period of fermentation.41,52 Sugars were all rather hydrophilic and quite soluble in water, nonetheless, these in the form of polymers could became more hydrophobic for the structure.24 It was because of the polysaccharides produced on the surface with large size and intertwined shape that the bacteria cells had hydrophobic properties in water.26 Similarly, extracellular polysaccharides of Aulacoseira granulata were found to be hydrophobic and have an promotional role on bacterial flocculation.53 The amazing ability of Azospirillum to interact with a fairly wide range of host plants was studied and found to be associated with the carbohydrate components of bacteria surface.54 In addition, it was found that E. coli initial adhesion to solid substrates was dependent on molecular interactions caused by lipopolysaccharides.55 Proteins can comprise hydrophilic and/or hydrophobic amino acids in any proportion.24 In our present study, the cell surface hydrophobic property increased along with the decrease of protein. However, different phenomenon was found in Azospirillum brasilens.41 In general, both saturated chains and unsaturated chains attracted each other in water, which would generate a hydrophobic energy of attraction.24 The concentrations of lipid on two hydrophilic bacteria surfaces studied by Rouxhet et al. were all lower than 15.0%.51 However, B. licheniformis had a higher proportion of lipid on surface during bioflocculant producing process, which facilitated the cellular flocculation.
3.6 Hypothesis of the flocculation mechanism
Base on the characterization of surface physicochemical properties, XDLVO analysis and cell surface changing during the process of bioflocculant production, the flocculation model of B. licheniformis was hypothesized in Fig. 6. Initially, the bacteria, surrounded by water molecule, had hydrophilic surface and its suspension was stable. However, with the secretion of bioflocculant, comprising hydrophobic polysaccharides, a capsule was formed around the cell surface. Then, the value of the interfacial free energy between cells, especially for the acid–base (AB) component, was decreased, suggesting the increase of hydrophobicity of cell surface. Meanwhile, the value of the acid–base energy was and water molecules were rejected with the strengthening of cell surface hydrophobicity. Thus, the bacteria became attracted and finally flocculated with each other.
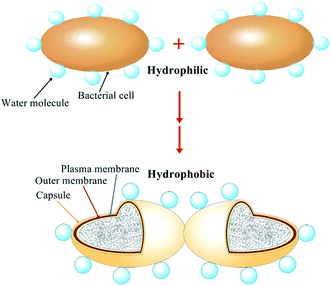 |
| | Fig. 6 Flocculation model of B. Licheniformis (not to scale). | |
4. Conclusions
All these results about the experimentally surface physicochemical characteristics and XDLVO theory could well bridge the micro-scale structures with the flocculation behavior of B. licheniformis. It is proved that variation in surface composition is the essential cause of hydrophobic (or hydrophilic) property of the cellular surface, and the properties of cell surface can in turn affect the flocculation behavior of the cells themselves indeed, which will allow us to apply their flocculation behavior in cultivation and harvesting of cells, achieving energetic and economic viability.
Acknowledgements
This work was financially supported by the National Natural Science Foundation of China (51378444, 21676221), Xiamen Southern Oceanographic Center (15GYY024NF03) and the University of Science and Technology in Fujian Province in the cooperative major project (2015H6004), the program for New Century Exellent Talents of Education Ministry of China (ncet-13-0501).
References
- E. V. Soares, J. Appl. Microbiol., 2010, 110, 1–18 CrossRef PubMed.
- M. Watanabe, K. Sasaki, Y. Nakashimada, T. Kakizono, N. Noparatnaraporn and N. Nishio, Appl. Microbiol. Biotechnol., 1998, 50, 682–691 CrossRef CAS.
- K. J. Verstrepen, G. Derdelinckx, H. Verachtert and F. R. Delvaux, Appl. Microbiol. Biotechnol., 2003, 61, 197–205 CrossRef CAS PubMed.
- G. Lettinga, A. F. M. V. Velsen, S. W. Hobma, W. D. Zeeuw and A. Klapwijk, Biotechnol. Bioeng., 1980, 22, 699–734 CrossRef CAS.
- F. H. White and A. D. Portno, J. Inst. Brew., 1978, 84, 228–230 CrossRef CAS.
- T. T. More, J. S. Yadav, S. Yan, R. D. Tyagi and R. Y. Surampalli, J. Environ. Manage., 2014, 144, 1–25 CrossRef CAS PubMed.
- B.-M. Wilén, B. Jin and P. Lant, Water Res., 2003, 37, 2127–2139 CrossRef.
- G. P. Sheng, H. Q. Yu and Z. B. Yue, Appl. Microbiol. Biotechnol., 2005, 69, 216–222 CrossRef CAS PubMed.
- D. E. Amory and P. G. Rouxhet, J. Inst. Brew., 1988, 94, 79–84 CrossRef CAS.
- Y.-I. Chang and P.-K. Chang, Colloids Surf., A, 2002, 211, 67–77 CrossRef CAS.
- N. Mangwani, S. K. Shukla, S. Kumari, S. Das and T. S. Rao, RSC Adv., 2016, 6, 57540–57551 RSC.
- N. I. Abu-Lail and T. A. Camesano, Biomacromolecules, 2003, 4, 1000–1012 CrossRef CAS PubMed.
- A. J. D. Kerchove and M. Elimelech, Langmuir, 2005, 21, 6462–6472 CrossRef PubMed.
- T. Nomura, H. Narahara, H. Tokumoto and Y. Konishi, Adv. Powder Technol., 2009, 20, 537–541 CrossRef CAS.
- F. Ahimou, C. J. P. Boonaert, Y. Adriaensen, P. Jacques, P. Thonart, M. Paquot and P. G. Rouxhet, J. Colloid Interface Sci., 2007, 309, 49–55 CrossRef CAS PubMed.
- F. Hamadi, H. Latrache, H. Zahir, A. Elghmari, M. Timinouni and M. Ellouali, Braz. J. Microbiol., 2008, 39, 10–15 CrossRef PubMed.
- P. G. Rouxhet and M. J. Genet, Surf. Interface Anal., 2011, 43, 1453–1470 CrossRef CAS.
- Y. Xiong, Y. Wang, Y. Yu, Q. Li, H. Wang, R. Chen and N. He, Appl. Environ. Microbiol., 2010, 76, 2778–2782 CrossRef CAS PubMed.
- X. Zhuang, Y. Wang, Q. Li, S. Yan and N. He, Biotechnol. Bioprocess Eng., 2012, 17, 1041–1047 CrossRef CAS.
- X. Liu, G. Sheng and H. Yu, Environ. Sci. Technol., 2007, 41, 4620–4625 CrossRef CAS PubMed.
- H. J. Busscher, A. H. Weerkamp, H. C. V. D. Mei, A. W. J. V. Pelt, H. P. D. Jong and A. J. Arends, Appl. Environ. Microbiol., 1984, 48, 980–983 CAS.
- C. J. V. Oss, R. J. Good and M. K. Chaudhury, Langmuir, 1988, 4, 884–891 CrossRef.
- T. Young, Philos. Trans. R. Soc. London, 1805, 95, 65–87 CrossRef.
- C. J. V. Oss, Colloids Surf., B, 1995, 5, 91–110 CrossRef.
- A. Vilinska and K. H. Rao, Miner. Metall. Process., 2011, 28, 151–158 CAS.
- Z. Wang, L. Shen, X. Zhuang, J. Shi, Y. Wang, N. He and Y.-I. Chang, Ind. Eng. Chem. Res., 2015, 54, 2894–2901 CrossRef CAS.
- B. V. Derjaguin and L. D. Landau, Acta Physicochim. URSS, 1941, 14, 633–662 Search PubMed.
- E. J. W. Verwey and J. T. G. Overbeck, Theory of the stability of lyophobic colloids, Elsevier Academic press, Amsterdam, 1948 Search PubMed.
- D. G. Brown and P. R. Jaffe, Environ. Sci. Technol., 2006, 40, 195–201 CrossRef CAS PubMed.
- C. J. V. Oss, M. K. Chaudhury and R. J. Good, Chem. Rev., 1988, 88, 927–941 CrossRef.
- H. Yotsumoto and R. H. Yoon, J. Colloid Interface Sci., 1993, 157, 426–433 CrossRef CAS.
- S. Song and S. Lu, J. Colloid Interface Sci., 1994, 166, 35–42 CrossRef CAS.
- Y. Zeng, S. Grandner, C. L. P. Oliveira, A. F. Thünemann, O. Paris, J. S. Pedersen, S. H. L. Klapp and R. von Klitzing, Soft Matter, 2011, 7, 10899–10909 RSC.
- K. Doymus, Turk. J. Chem., 2007, 31, 589–597 CAS.
- D. Lin, W. Ma, Z. Jin, Y. Wang, Q. Huang and P. Cai, Colloids Surf., B, 2016, 138, 10–16 CrossRef CAS PubMed.
- D. G. Brown, Environ. Sci. Technol., 2006, 40, 195–201 CrossRef CAS PubMed.
- M. J. Gross, O. Albinger, D. G. Jewett, B. E. Logan, R. C. Bales and R. G. Arnold, Water Res., 1995, 29, 1151–1158 CrossRef CAS.
- R. A. Gittens, L. Scheideler, F. Rupp, S. L. Hyzy, J. Geis-Gerstorfer, Z. Schwartz and B. D. Boyan, Acta Biomater., 2014, 10, 2907–2918 CrossRef CAS PubMed.
- C. J. V. Oss, Cell Biophys., 1989, 14, 1–16 CrossRef PubMed.
- C. J. V. Oss, Colloids Surf., A, 1993, 78, 1–49 CrossRef.
- Y. F. Dufrgne and P. G. Rouxhet, Can. J. Microbiol., 1996, 42, 548–556 CrossRef.
- X. M. Liu, G. P. Sheng, J. Wang and H. Q. Yu, Appl. Microbiol. Biotechnol., 2008, 79, 187–194 CrossRef CAS PubMed.
- K. A. Strevett and G. Chen, Res. Microbiol., 2003, 154, 329–335 CrossRef CAS PubMed.
- C. J. van Oss, J. Mol. Neurosci., 2003, 16, 177–190 CAS.
- M. Hermansson, Colloids Surf., B, 1999, 14, 105–119 CrossRef CAS.
- A. Ozkan and H. Berberoglu, Colloids Surf., B, 2013, 112, 302–309 CrossRef CAS PubMed.
- P. G. Rouxhet, N. Mozes, P. B. Dengis, Y. F. Dufrene, P. A. Gerin and M. J. Genet, Colloids Surf., B, 1994, 2, 347–369 CrossRef CAS.
- J. Baddiley, I. C. Hancock and P. M. A. Sherwood, Nature, 1973, 243, 43–45 CrossRef CAS PubMed.
- P. B. Dengis, P. A. Gerin and P. G. Rouxhet, Colloids Surf., B, 1995, 4, 199–211 CrossRef CAS.
- H. C. V. D. Mei, J. D. Vries and H. J. Busscher, Surf. Sci. Rep., 2000, 39, 1–24 CrossRef.
- C. J. P. Boonaert and P. G. Rouxhet, Appl. Environ. Microbiol., 2000, 66, 2548–2554 CrossRef CAS PubMed.
- J. M. Arroyo, D. Olmos, B. Orgaz, C. H. Puga, C. San José and J. González-Benito, RSC Adv., 2014, 4, 51451–51458 RSC.
- A. A. H. Vieira, P. I. C. Ortolano, D. Giroldo, M. J. D. Oliveira, T. B. Bittar, A. T. Lombardi and A. L. Sartori, Limnol. Oceanogr., 2008, 53, 1887–1899 CrossRef CAS.
- I. M. Skvortsov and V. V. Ignatov, FEMS Microbiol. Lett., 1998, 165, 223–229 CrossRef CAS PubMed.
- Q. Lu, J. Wang, A. Faghihnejad, H. Zeng and Y. Liu, Soft Matter, 2011, 7, 9366–9379 RSC.
Footnote |
| † Electronic supplementary information (ESI) available: Fig. S1–S6 and Table S1. See DOI: 10.1039/c6ra28057a |
|
| This journal is © The Royal Society of Chemistry 2017 |
Click here to see how this site uses Cookies. View our privacy policy here.  Open Access Article
 ab,
Zhen Chena,
Lijie Yanga,
Fen Tana,
Yuanpeng Wanga,
Qingbiao Lia,
You-Im Changc,
Chuan-Jian Zhong
 d and
Ning He*a


 is defined in eqn (8) and the value of the decay length λ which is controlled both by the particle size and the ionic strength of the suspensions varies from 0.6 nm to 13 nm.30,33


![[double bond, length as m-dash]](https://www.rsc.org/images/entities/char_e001.gif) CH– and
CH– and ![[double bond splayed left]](https://www.rsc.org/images/entities/char_e009.gif) C
C![[double bond, length as m-dash]](https://www.rsc.org/images/entities/char_e001.gif) CH2– weaken γB−.43
CH2– weaken γB−.43


