 Open Access Article
Creative Commons Attribution 3.0 Unported Licence
Phthalocyanine incorporated alginate hydrogel with near infrared fluorescence for non-invasive imaging monitoring in vivo
Jie Liang†
,
Xia Dong†,
Chang Wei,
Deling Kong,
Tianjun Liu and
Feng Lv *
*
Tianjin Key Laboratory of Biomedical Materials, Institute of Biomedical Engineering, Chinese Academy of Medical Sciences & Peking Union Medical College, Tianjin 300192, PR China. E-mail: lvfeng2002@163.com; Fax: +86-22-87893236; Tel: +86-22-87893236
First published on 19th January 2017
Abstract
In vivo fates of alginate compounds are crucial for developing their biomedical applications. Near infrared fluorescence imaging in vivo can non-invasively monitor and reveal the process of the implants. Herein, a near infrared fluorescent alginate conjugated PEG was prepared by labeling zinc phthalocyanine, and then a dual fluorescent drug delivery system was designed with a rhodamine-loaded zinc phthalocyanine conjugated hydrogel. The hydrogel erosion and drug delivery in vivo were non-invasively tracked by a multispectral fluorescence imaging system with nude mice as models. The in vivo near infrared fluorescence imaging results revealed the real time process of the visible drug delivery system based on the alginate hydrogel. A multispectral fluorescence imaging technique can separate the fluorescence signals of the drug and the carrier from the drug-loaded hydrogel. The phthalocyanine-incorporated alginate hydrogel is a potential visible implant system.
Introduction
Alginate, a natural type of polysaccharide compound derived from various species of brown algae, has been extensively applied as scaffolds for tissue repair and wound healing, drug delivery carriers or extracellular matrices.1–3 Alginate hydrogels are usually constructed via ionic bonding with divalent ions by a simple method and have attracted significant attention in the biomedical fields with the demands for less invasive procedures because of their injectability and biocompatibility.4,5 As the functional requirements of novel biomaterials increase, research focusing on the modification of alginate has surged. Alginate conjugated with PEG compounds has recently been developed as a potential biomaterial, such as mucoadhesive polymers and hybrid microspheres,6,7 because of its less immunogenic and antigenic ability, low hemolysis and aggregation of erythrocytes by PEG modification. Moreover, the PEG chain can improve the adhesion to the mucus for the hydrogel because of the chain interpenetration at the hydrogel and mucus interface.8,9 Accordingly, a detailed investigation of alginate conjugated with PEG hydrogel requires more attention.Non-invasive monitoring in vivo is an advanced method for the evaluation of implant biomaterials and drug delivery systems.10 It can reveal information on the in situ status of materials and drugs with an accurate volume assessment compared to in vitro or ex vivo evaluations with biosamples taken from the body.11 With the development of imaging skills and equipment, medical imaging plays an important role in the tracking and monitoring of implant biomaterials and drug delivery systems.12,13 Fluorescence imaging has beneficial potential in clinical applications because of its high sensitivity, low radiation and non-invasiveness.14,15 Currently, fluorescence imaging has been successfully serviced for whole-body fluorescence imaging on adult humans.16 More importantly, compared to other imaging methods, fluorescence imaging can be used to track two or more fluorescence signals by separation from the different drugs and carriers, which affords the ability to locate and monitor multiple drugs and carriers simultaneously.17,18 In addition, near infrared fluorescence imaging can enhance the sensitivity and penetration depth in biological tissues and organs by avoiding the scattering effect and background interference from the bioorganisms in the near infrared region (NIR).19,20 It is advantageous to non-invasively monitor implant biomaterials or drug delivery systems using near infrared fluorescence imaging.
Zinc phthalocyanine, a type of extended π-conjugated electronic macrocycle compound with intense fluorescence in the near infrared region, was widely applied in the biological, photo-physical and catalytic fields.21–23 Because of the advantages of excellent fluorescence quantum yields, large near infrared absorption and acceptable biocompatibility, zinc phthalocyanine compounds have progressed as photosensitizers and fluorescence imaging probes.24,25 Several near infrared fluorescence imaging probes have been developed by us26,27 for tumor imaging based on zinc phthalocyanine conjugated compounds, which demonstrates that zinc phthalocyanine conjugated compounds have favorable fluorescence imaging effects with good biocompatibility. The polymers conjugated with zinc phthalocyanine can also develop into novel fluorescent materials. Zinc phthalocyanine labeled polyethylene glycol has recently been reported to track and monitor the in vivo process of polyethylene glycol in our group.28 This suggests that zinc phthalocyanine could become a novel fluorescent tag to monitor biomaterials in vivo because of its satisfactory near infrared fluorescence emission.
Rhodamine, a water soluble near infrared fluorescent dye, is usually modeled as a hydrophilic drug.11,29 It is suitable to be applied for the tracking of drug release by fluorescence imaging. In this paper, a near infrared fluorescent alginate conjugated PEG was prepared by labeling zinc phthalocyanine, and a dual fluorescent drug delivery system was designed with a rhodamine loaded zinc phthalocyanine conjugated hydrogel. The structure and properties of the drug delivery system were investigated by rheological analysis, thermogravimetric analysis (TGA), and UV-visible and fluorescence spectrophotometry. By the separation of the fluorescence signals from the model drug and the hydrogel, the hydrogel erosion and drug delivery in vivo were non-invasively monitored using a multispectral fluorescence imaging system with nude mice as models. This provides a novel fluorescent biomaterial and method for the evaluation of a drug delivery system with alginate.
Experiment section
Materials
Poly(ethylene glycol) (PEG Mn = 1000, Merck, USA) was vacuum dried at 60 °C for 12 hours before use. 4-Chlorophthalonitrile (AR) was purchased from Shijiazhuang Aifa Chemical Technology Company, China. Sodium alginate (AR) was provided by Shanghai Jingchun Biotech Corporation, China. Chloral hydrate (>99.0, pharmaceutical grade) was provided by Qingdao Yulong Algae Co., Ltd., China. Other reagents were all analytic reagent (AR) grade.Nude mice (seven weeks old, 20–25 g) were used. All animal procedures were conducted following the protocol approved by the Institutional Laboratory Animal Ethics Committee and the Institutional Animal Care and Use Committee (IACUC), Peking Union Medical College, People's Republic of China. All animal experiments were performed in compliance with the Guiding Principles for the Care and Use of Laboratory Animals, Peking Union Medical College, People's Republic of China. Animals were housed in cages with free access to food and water.
Synthesis of zinc phthalocyanine–PEG–alginate copolymer
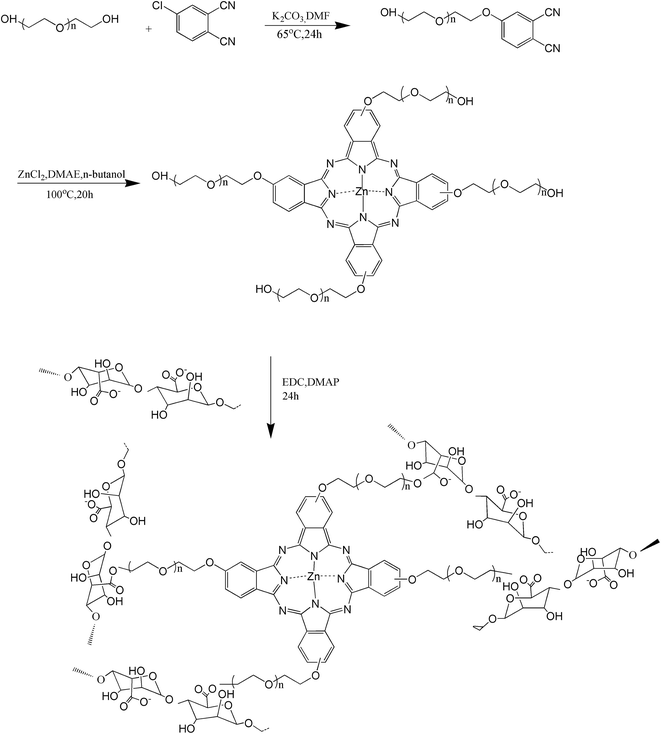
The zinc phthalocyanine–PEG–alginate copolymer was synthesized as shown in Fig. 1. Zinc phthalocyanine conjugated PEG was synthesized by the substitution reaction and condensation of 4-chlorophthalonitrile and PEG.28 Zinc phthalocyanine–PEG copolymer (0.2 g) and alginate (0.6 g) were dissolved in 50 mL of water, and EDC·HCl (0.5 mg) and DMAP (0.5 mg) were added to catalyze the reaction. After stirring for 24 h at room temperature, the mixture was precipitated with formaldehyde and filtered, and the solid was dried for 12 h at 30 °C under vacuum to obtain the zinc phthalocyanine–PEG–alginate copolymer.Characterization of the zinc phthalocyanine–PEG–alginate copolymer
The Nicolet 2000 instrument from Thermo Fisher, USA was used to record the infrared spectra for the samples from 4000 to 400 cm−1 with KBr plates. The 1H-NMR spectra of alginate and the zinc phthalocyanine–PEG–alginate copolymer were recorded on a VARIAN INOVA instrument from the USA at 500 MHz using D2O as the solvent and TMS as an internal reference. Thermogravimetric analysis (TGA) (Thermo Fisher, USA) was used to analyze the thermal properties of zinc phthalocyanine–PEG–alginate copolymers under a nitrogen atmosphere. The temperature range was from 20 to 500 °C for the wet copolymer and from 25 to 1000 °C for the dry copolymer at a heating rate of 10 °C min−1.The rheology of zinc phthalocyanine–PEG–alginate hydrogel was analyzed by an MCR 302 Rheometer of Anton-Paar from Austria. Under a frequency of 1 Hz, the storage modulus (G′) and loss modulus (G′′) were measured. It is well known that the rheological property is independent of the shearing stress under the linear viscoelastic region. Zinc phthalocyanine–PEG–alginate hydrogel at a concentration of 20 mg mL−1 was placed under the cone plate, and a CaCl2 solution (2%) was added after a few seconds.
Optical measurements and fluorescence imaging in vitro
UV-vis spectra of alginate and zinc phthalocyanine–PEG–alginate copolymer were recorded on a Thermo Fisher Scientific Varioskan TM Flash multimode microplate spectrum photometer from the USA. The optical characteristics were evaluated by UV-vis at a concentration of 2.5 mg mL−1 in an aqueous solution. Fluorescence imaging in vitro was recorded by a CRI Maestro imaging system from the USA with an excitation wavelength of 635 nm and an emission wavelength from 670 nm to 900 nm. The exposure time was set at 300 ms.In vitro release of rhodamine
Zinc phthalocyanine–PEG–alginate copolymer (5 mg) was mixed with 250 μL of rhodamine solution (5 mg mL−1), and then turned into a rhodamine-loaded hydrogel with the addition of 50 μL of CaCl2 (2 wt%). The rhodamine-loaded hydrogel was placed in a 2 mL Eppendorf tube and immersed in 20 mL of phosphate buffer saline (pH = 7.4) at 37 °C in a 60 rpm water bath for 5 days. The dialysis fluid was absorbed from PBS at 37 °C after 3 h, 6 h, 9 h, 12 h, 1 d, 2 d, 3 d, 4 d and 5 d, respectively. The concentration of the released rhodamine was determined by a Waters e2695 HPLC from the USA at an absorption wavelength of 550 nm. The cumulative release ratio of the rhodamine was calculated from the standard curve method.Dual fluorescence tracking for rhodamine and zinc phthalocyanine–PEG–alginate hydrogel in vitro and in vivo
To ensure the separation of the rhodamine and hydrogel by multispectral fluorescence imaging in vivo, the fluorescence imaging in vitro was performed by the CRI Maestro imaging system firstly. Multispectral fluorescence imaging can extract the signals of the hydrogel and the drug, and then track the degradation of the hydrogel and the delivery of the drug in vivo. The excitation wavelength was set at 635 nm to extract the signal of the hydrogel and another excitation wavelength was set at 523 nm to extract the signal of rhodamine.Nude mice (n = 3) were labeled separately to carry out a parallel experiment. The mice were assigned to an intraperitoneal injection at a concentration of 4% for chloral hydrate. Then, 100 μL of rhodamine-loaded zinc phthalocyanine–PEG–alginate hydrogel and 10 μL of CaCl2 (2 wt%) were subcutaneously injected into the left back of the nude mice. The rhodamine solution of 100 μL was injected in the subcutaneous tissue of the right back as a control. In order to track the release of the rhodamine, the excitation wavelength was set at 523 nm. Meanwhile, the excitation wavelength was set at 635 nm to track the degradation of the hydrogel for 21 days. The hydrogel and the rhodamine were unmixed with red and blue to separate the spectral species from the cube files and were calculated quantitatively by the Maestro software.
Results and discussion
Preparation and structural characterization of the zinc phthalocyanine–PEG–alginate copolymer
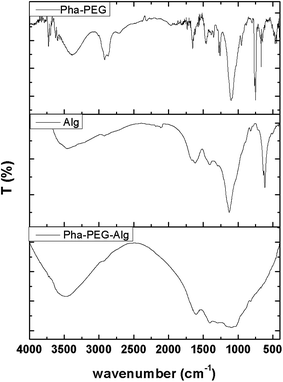
Alginate conjugation was generally functionalized on the hydroxyl or carboxyl functional groups of alginate by a condensation reaction due to its simple and convenient method.30,31 Herein, zinc phthalocyanine–PEG–alginate copolymer was prepared by a condensation reaction of zinc phthalocyanine–PEG copolymer and alginate. Except for the enhancement of the biocompatibility, PEG linkage can prevent the aggregation of the zinc phthalocyanine compound by the extension of the long chain, avoiding the quenching of fluorescence signals. The near infrared fluorescence of zinc phthalocyanine was applied to monitor the degradation of the alginate conjugation as the conjugation is covalently linked.The chemical structure of the alginate conjugation was characterized by FT-IR and 1H-NMR spectroscopy. The infrared spectra of the zinc phthalocyanine–PEG copolymer, alginate and zinc phthalocyanine–PEG–alginate copolymer are shown in Fig. 2. According to the peak position and the intensity of the infrared spectrum, the zinc phthalocyanine–PEG–alginate copolymer can be inferred by the recognizable functional groups. In the IR spectrum of the zinc phthalocyanine–PEG copolymer, the peak at 3386 cm−1 is the signal of the stretching vibration for the –OH band. Due to the association, the strong peak of the –N–H– band at 2919 cm−1 is shifted in the low frequency direction. The phthalocyanine unit shows its characteristic peak at 1653 cm−1, which is the signal of the –C![[double bond, length as m-dash]](https://www.rsc.org/images/entities/char_e001.gif) N– band. The separate peaks were shown at 3500–3700 cm−1 and 800–600 cm−1 because of the stretching vibration and bending vibration of the aromatic hydrogen. The peak at 1456 cm−1 is attributed to the skeleton vibration for the benzene ring. In the infrared spectrum of the alginate, the peaks at 3400, 1617, 1408 and 1129 cm−1 are the signals of the –OH, –C
N– band. The separate peaks were shown at 3500–3700 cm−1 and 800–600 cm−1 because of the stretching vibration and bending vibration of the aromatic hydrogen. The peak at 1456 cm−1 is attributed to the skeleton vibration for the benzene ring. In the infrared spectrum of the alginate, the peaks at 3400, 1617, 1408 and 1129 cm−1 are the signals of the –OH, –C![[double bond, length as m-dash]](https://www.rsc.org/images/entities/char_e001.gif) O–, –CH2–, –C–O–C– bands, respectively. The characteristic peak of the –C
O–, –CH2–, –C–O–C– bands, respectively. The characteristic peak of the –C![[double bond, length as m-dash]](https://www.rsc.org/images/entities/char_e001.gif) O– band at 1617 cm−1 is caused by a shift to the low frequency direction. In the IR spectrum of the zinc phthalocyanine–PEG–alginate copolymer, the characteristic peaks at 2900 and 1604 cm−1 are the signals of the –N–H– and –C
O– band at 1617 cm−1 is caused by a shift to the low frequency direction. In the IR spectrum of the zinc phthalocyanine–PEG–alginate copolymer, the characteristic peaks at 2900 and 1604 cm−1 are the signals of the –N–H– and –C![[double bond, length as m-dash]](https://www.rsc.org/images/entities/char_e001.gif) N– bands.
N– bands.
 | ||
| Fig. 2 IR spectra of the zinc phthalocyanine–PEG copolymer, alginate and zinc phthalocyanine–PEG–alginate copolymer. | ||
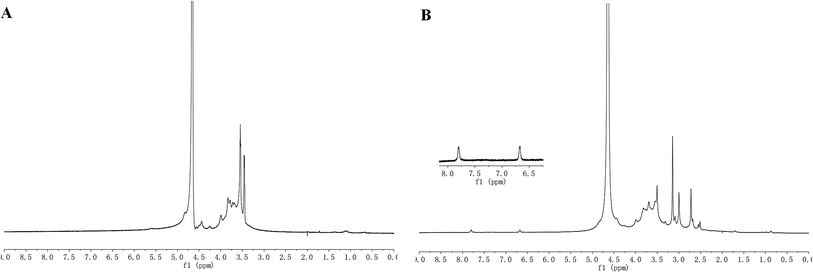
As shown in Fig. 3, the proton type and the proton chemical environment are provided by nuclear magnetic resonance spectroscopy. The characteristic peaks at 3.4–4.4 ppm are the signals of the saccharide units in the 1H-NMR spectra of alginate. In the 1H-NMR spectra of the zinc phthalocyanine–PEG–alginate copolymer, the faint peaks at 6.671 ppm and 7.805 ppm are the signals of the protons in the benzene ring of the zinc phthalocyanine unit, and the characteristic peaks at 2.4–4.4 ppm are the signals of the saccharide unit. Besides, the characteristic peak of the PEG unit is at 3.538 ppm. All these signals verified the successful conjugation of the zinc phthalocyanine–PEG–alginate copolymer.
Thermogravimetric and rheological analysis of the zinc phthalocyanine–PEG–alginate hydrogel
The zinc phthalocyanine–PEG–alginate hydrogel was formed immediately from a green solution by the ion-crosslinking with 2 wt% CaCl2 (Fig. 4). The decomposition temperature of the zinc phthalocyanine–PEG–alginate copolymer can be reflected from the TGA curve in Fig. 5. In the curve of the wet hydrogel sample, the water content for the zinc phthalocyanine–PEG–alginate copolymer is about 98%, and there is a declining trend for the quality ratio in the temperature from 100 °C to 500 °C. The curve of the dry copolymer was measured to investigate the thermogravimetric change of the material component. There is obvious weightlessness from 200 °C to 300 °C, which is the decomposition process of the alginate. The zinc phthalocyanine–PEG chain was broken after 500 °C based on the TGA curve of the dry copolymer. The weight of the copolymer has a reduction at about 800 °C, and then has a remnant of 20% at about 1000 °C. This affirmed the multi-components of phthalocyanine–PEG–alginate conjugation. | ||
| Fig. 4 Optical image of the zinc phthalocyanine–PEG–alginate copolymer water solution (A) and hydrogel (B). | ||
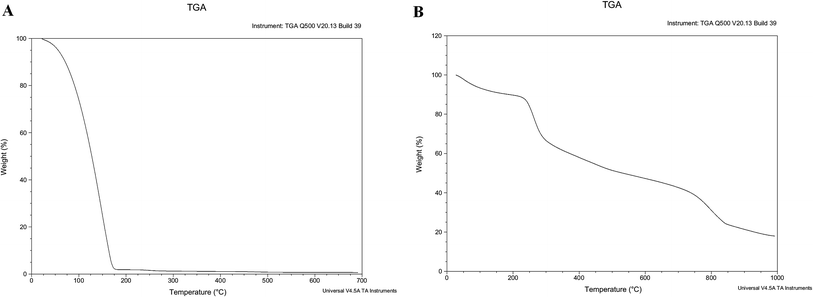 | ||
| Fig. 5 TGA curve of wet and dry zinc phthalocyanine–PEG–alginate copolymer ((A) wet hydrogel, (B) dry copolymer). | ||
A time sweep measurement was carried out to explore the hydrogel system, in which the gelation response time and the swelling behavior of the hydrogel could be recorded. As shown in Fig. 6, the storage modulus (G′) and loss modulus (G′′) were monitored using time as a variable. It was found that the loss modulus (G′′) was higher than the storage modulus (G′) before the CaCl2 solution was added, which indicated the sol state of the copolymer. When the CaCl2 solution contacted the alginate conjugation solution, the sol–gel transition appeared immediately, in less than 5 seconds. Beyond the crossover point, the system became more elastic at a gel state. Meanwhile, the loss modulus (G′′) value was lower than the storage modulus (G′). It is obvious that the hydrogel formed with a rapid gelation response process, which ensures beneficial injectability. The rapid gelation can locate the hydrogel in the target zone, preventing its fluidness and diffusibility. When alginate conjugation is used as a drug carrier, rapid gelation also avoids a burst release. Alginate conjugation ionic hydrogel has a specific advantage as an injectable implant or drug carrier compared to other hydrogels.
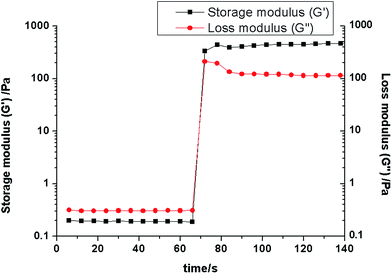 | ||
| Fig. 6 Rheological analysis as a function of time for the zinc phthalocyanine–PEG–alginate hydrogel. | ||
Optical measurement and fluorescence imaging in vitro
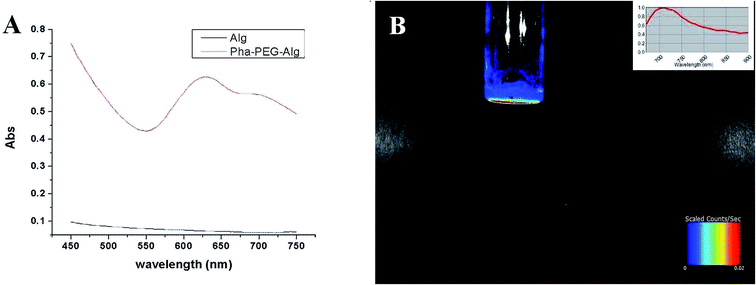
The UV-vis spectra of sodium alginate aqueous solution and the phthalocyanine–PEG–alginate copolymer aqueous solution are shown in Fig. 7. Sodium alginate is a copolymer consisting of different saccharide units without obvious ultraviolet absorption peaks from 450 nm to 750 nm. Nevertheless, the phthalocyanine–PEG–alginate copolymer aqueous solution has a strong typical absorption peak at 630 nm and a weak typical absorption peak at 700 nm, which signify the characteristic signals of the phthalocyanine compound. In order to ensure the feasibility for imaging tracking in vivo of the phthalocyanine–PEG–alginate copolymer, the fluorescence signal in vitro for the hydrogel was analyzed. As shown in Fig. 7, the phthalocyanine–PEG–alginate hydrogel in vitro has an acceptable fluorescence signal. The near infrared fluorescence emission is the most important property of the phthalocyanine–PEG–alginate hydrogel compared to other fluorescent hydrogels. Generally, the ideal wavelength range for in vivo fluorescence imaging is from approximately 600 nm to 1000 nm in the near infrared region. The biological chromophore hemoglobin and other biological components from elastin, collagen, and other biological fluorophores introduce weak light absorption, low light scattering and autofluorescence with little interference in the near infrared region.32 The near infrared fluorescent hydrogel with phthalocyanine–PEG–alginate can enhance the imaging sensitivity and penetration depth in biological tissues and organs by avoiding the scattering effect and the background interference from bioorganisms, which improves the imaging tracking effect.In vitro release of rhodamine
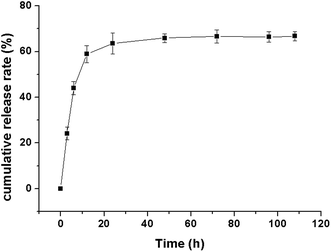
Rhodamine, a drug model with near infrared fluorescence, was loaded in the phthalocyanine–PEG–alginate hydrogel to investigate the release process. The release curve of the rhodamine in vitro is shown in Fig. 8. The release trend slowed down gradually, and the release rate decreased gradually. The cumulative release rate of the rhodamine loaded hydrogel rapidly increased from 0 to 58% in the first 12 h. From then on, the drug was released steadily and sustainably to 66% in the fifth day. The rhodamine loaded hydrogel in vitro could be released rapidly within 12 hours, and it was released gently after the first day.Multispectral fluorescence imaging in vitro and in vivo
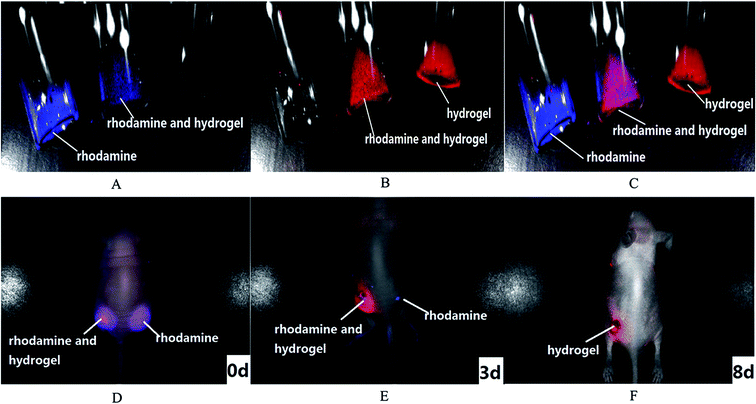
Multispectral fluorescence imaging can separate the fluorescence signals of the drug and the hydrogel from the drug loaded hydrogel. Dual fluorescence signals were collected by a CRI imaging system. The fluorescence signal of the rhodamine was collected at the excitation wavelength of 523 nm and emission wavelengths from 560 nm to 750 nm (Fig. 9A), while that of the hydrogel was collected at the excitation wavelength of 635 nm and emission wavelengths from 670 nm to 900 nm (Fig. 9B). Based on the difference of each specific fluorescence signal, the multispectral analysis spectrum can distinguish and separate the different labels from the drug and carrier with a multicolor composite image. The dual fluorescence signals could be identified and unmixed clearly in Fig. 9C. The signals of the rhodamine and the hydrogel are signified with blue and red. The single rhodamine and hydrogel could be distinguished with their respective fluorescence signal in the rhodamine solution or the hydrogel and with both signals in the rhodamine loaded hydrogel. This suggests that multispectral fluorescence resolution in vitro could be applied in mixed fluorescence signals and collected respective signals successfully.The multispectral fluorescence separation in vitro affords a reference for multispectral fluorescence imaging in vivo. The dual fluorescence imaging in vivo of the drug loaded hydrogel was monitored in Fig. 9D–F. The signal of the rhodamine was blue, and the phthalocyanine–PEG–alginate hydrogel was red. They were tracked in nude mice. On the first day, the signal of a single rhodamine solution was seen in the right back of the nude mice, while the mixed signals of the rhodamine and the hydrogel were seen in the left back. The signals of the free rhodamine group and the rhodamine loaded hydrogel group were equivalent. After 3 days, the fluorescence signals of the free rhodamine group and the rhodamine loaded hydrogel group were both reduced. In addition, the fluorescence signal of the free rhodamine group was weaker than that of the rhodamine loaded hydrogel group due to the sustained release effect for the phthalocyanine–PEG–alginate hydrogel. After 8 days, the fluorescence signal of the rhodamine disappeared owing to the metabolism in vivo, while the signal of the hydrogel remained. Therefore, the fluorescence signals of the phthalocyanine–PEG–alginate hydrogel and the rhodamine can be recognized and separated by multispectral fluorescence imaging in vivo.
Multispectral fluorescence imaging is a unique function for tracking two or more fluorescence signals by separation from different drugs and carriers that other imaging techniques cannot provide. It is an important prerequisite of multispectral analysis that the spectrum is different for each specific fluorescent component. A multicolor composite image can be generated to distinguish different labels and reveal the interrelation of the drug and carrier based on their differences in emission. Rhodamine and phthalocyanine have different fluorescence emissions, thus the drug and hydrogel can be located and monitored in situ in a drug loaded hydrogel system by multispectral fluorescence imaging.
Tracking for rhodamine release in vivo
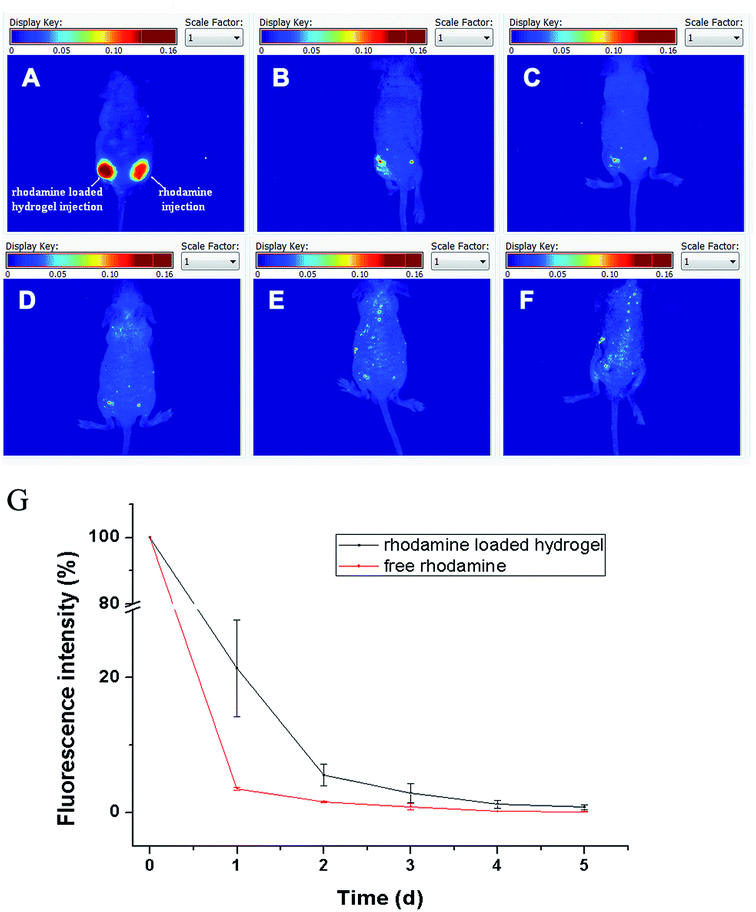
In terms of the release of rhodamine, the fluorescence signal of rhodamine had obvious attenuation. The graphs for the relative fluorescence signal intensity of the free rhodamine and the rhodamine loaded hydrogel are shown in Fig. 10A. In general, the free rhodamine group of the nude mice at the left back was metabolized faster than that at the right back in which the rhodamine was loaded on the hydrogel. The rhodamine signal quickly reduced between 24 h due to the fast metabolism. Using quantitative analysis of the fluorescence signal of the rhodamine by a CRI imaging system (Fig. 10B), the relative fluorescence intensities of the rhodamine were 28% and 4% in the rhodamine loaded hydrogel group and free rhodamine group. The hydrogel played a prominent role for the drug with a sustained release. The relative fluorescence intensity of the free rhodamine was near 1%, and the rhodamine loaded on the hydrogel was about 10% after 2 days. After being released for 5 days, the rhodamine had also been released completely. In view of the drug release property of the hydrogel, the phthalocyanine–PEG–alginate hydrogel can attract more attention because of its sustained release behavior for carrying drugs. What is more, the hydrogel could potentially be regarded as an injectable vehicle for drug delivery.Degradation monitoring for the zinc phthalocyanine–PEG–alginate hydrogel in vivo
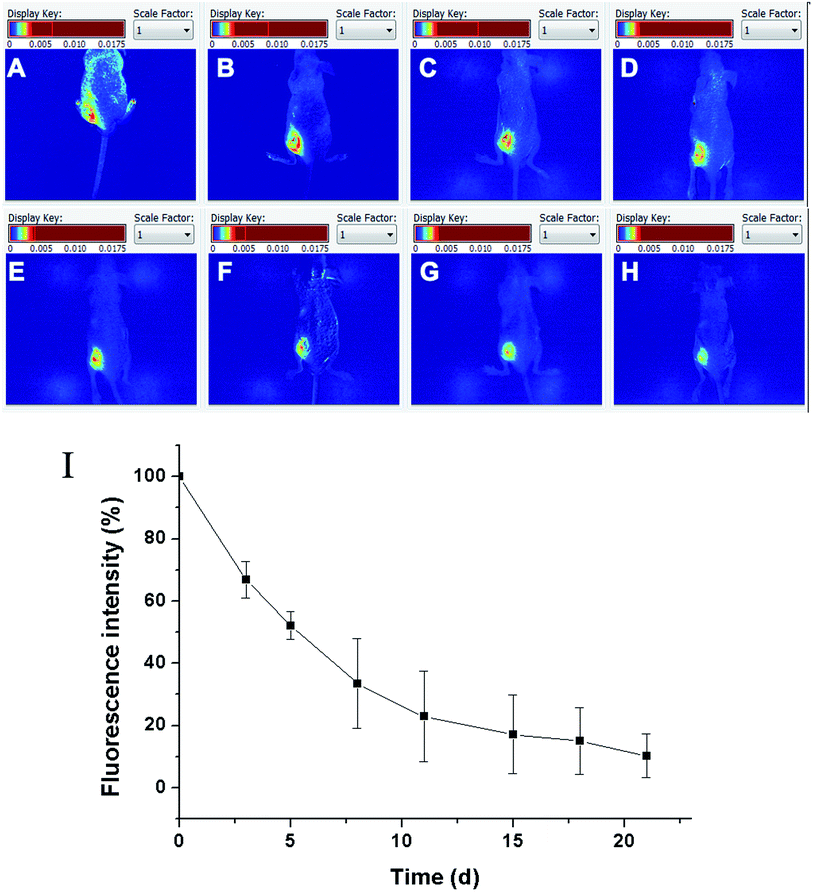
The degradation of the zinc phthalocyanine–PEG–alginate hydrogel was monitored from the total near infrared fluorescence decay of phthalocyanine using a non-invasive imaging system. The separated fluorescence signal of the hydrogel is shown in Fig. 11A. On the basis of the fluorescence imaging in vivo, the signal of the hydrogel was reduced from 0 d to 21 d. The degradation time of the hydrogel was far more than the release of the rhodamine, suggesting that the hydrogel could be an injectable material to maintain drug effects for a long time. To analyze the relative fluorescence signal intensity quantitatively (Fig. 11B), it was seen that the hydrogel showed a clear reduction in vivo. The relative fluorescence signal intensity of the rhodamine loaded hydrogel group was approximately 50% on the eighth day. The residual hydrogel was one quarter of the original hydrogel after 18 days, which indicated that such a degradable hydrogel could be capable of tracking by fluorescence signal. The zinc phthalocyanine was feasible and advantageous as a fluorescence label in the fluorescence imaging for nude mice.Overall, the imaging technique can obtain high quality data, requiring a much smaller number of animals than the other methods in vitro or ex vivo.33,34 For the assessment of the carrier degradation, in vitro or ex vivo assays cannot objectively reflect the real-time process and the status of the material degradation from damaging the samples, including the gravimetric or volume determination of periodic samples or the physicochemical properties measurement of molecular weight, mechanical properties, morphology and viscosity.35–37 The zinc phthalocyanine–PEG–alginate hydrogel can be used to develop a novel fluorescent hydrogel for degradation tracking in vivo. However, the tracking and monitoring of the hydrogel status in vivo still face great challenges and need to be elucidated in detail.
Conclusion
In summary, a near infrared fluorescent zinc phthalocyanine labeled alginate conjugated PEG was successfully prepared as a non-invasive monitor of the in vivo process of the alginate hydrogel. With the guidance of fluorescence imaging, the in vivo status of the hydrogel and the drug delivery can be reflected simultaneously in situ. The zinc phthalocyanine incorporated alginate hydrogel exhibits near infrared fluorescence ability for in vivo tracking, suggesting its potential as a visible implant or drug carrier.Acknowledgements
This work was supported by the National Natural Science Foundation of China (No. 31200732, 81601595), the Natural Science Foundation of Tianjin, China (No. 14JCYBJC17400, 16JCYBJC27800) and the Program for Innovative Research Team in Peking Union Medical College.References
- S. J. Bidarra, C. C. Barrias and P. L. Granja, Acta Biomater., 2014, 10, 1646–1662 CrossRef PubMed.
- T. K. Giri, D. Thakur, A. Alexander, A. Ajaz, H. Badwaik and D. K. Tripathi, Curr. Drug Delivery, 2012, 9, 539–555 CrossRef.
- S. N. Pawar and K. J. Edgar, Biomaterials, 2012, 33, 3279–3305 CrossRef PubMed.
- R. S. Stilhano, J. L. Madrigal, K. Wong, P. A. Williams, P. K. Martin, F. S. Yamaguchi, V. Y. Samoto, S. W. Han and E. A. Silva, J. Controlled Release, 2016, 237, 42–49 CrossRef CAS PubMed.
- T. C. Tseng, L. Tao, F. Y. Hsieh, Y. Wei, I. M. Chiu and S. H. Hsu, Adv. Mater., 2015, 27, 3518–3524 CrossRef CAS PubMed.
- T. Miao, K. S. Rao, J. L. Spees and R. A. Oldinski, J. Controlled Release, 2014, 192, 57–66 CrossRef CAS PubMed.
- M. Davidovich-Pinhas and H. Bianco-Peled, Acta Biomater., 2011, 7, 625–633 CrossRef CAS PubMed.
- O. Jeon, J. E. Samorezov and E. Alsberg, Acta Biomater., 2014, 10, 47–55 CrossRef CAS PubMed.
- K. M. Gattas-Asfura, C. A. Fraker and C. L. Stabler, J. Biomed. Mater. Res., Part A, 2011, 99, 47–57 CrossRef PubMed.
- A. A. Appel, M. A. Anastasio, J. C. Larson and E. M. Brey, Biomaterials, 2013, 34, 6615–6630 CrossRef CAS PubMed.
- X. Dong, C. Wei, T. Liu, F. Lv and Z. Qian, ACS Appl. Mater. Interfaces, 2016, 8, 5104–5113 CAS.
- T. Etrych, H. Lucas, O. Janouskova, P. Chytil, T. Mueller and K. Mader, J. Controlled Release, 2016, 226, 168–181 CrossRef CAS PubMed.
- H. Zhou, C. Hernandez, M. Goss, A. Gawlik and A. A. Exner, Curr. Drug Targets, 2015, 16, 672–682 CrossRef CAS PubMed.
- F. Leblond, S. C. Davis, P. A. Valdes and B. W. Pogue, J. Photochem. Photobiol., B, 2010, 98, 77–94 CrossRef CAS PubMed.
- J. Rao, A. Dragulescu-Andrasi and H. Yao, Curr. Opin. Biotechnol., 2007, 18, 17–25 CrossRef CAS PubMed.
- S. K. Piper, C. Habermehl, C. H. Schmitz, W. M. Kuebler, H. Obrig, J. Steinbrink and J. Mehnert, PLoS One, 2013, 8, e83749 Search PubMed.
- S. Hoffmann, L. Vystrcilova, K. Ulbrich, T. Etrych, H. Caysa, T. Mueller and K. Mader, Biomacromolecules, 2012, 13, 652–663 CrossRef CAS PubMed.
- L. Zhou and W. S. El-Deiry, J. Nucl. Med., 2009, 50, 1563–1566 CrossRef PubMed.
- S. C. Ghosh and A. Azhdarinia, Curr. Med. Chem., 2015, 22, 3390–3404 CrossRef CAS PubMed.
- E. M. Sevick-Muraca, Annu. Rev. Med., 2012, 63, 217–231 CrossRef CAS PubMed.
- L. Yuan, L. Gui, Y. Wang, Q. Zhang, L. Zhou and S. Wei, Spectrochim. Acta, Part A, 2016, 158, 1–8 CrossRef CAS PubMed.
- L. Legnani and B. Morandi, Angew. Chem., 2016, 55, 2248–2251 CrossRef CAS PubMed.
- S. Acherar, L. Colombeau, C. Frochot and R. Vanderesse, Curr. Med. Chem., 2015, 22, 3217–3254 CrossRef CAS PubMed.
- Z. Iqbal, J. Chen, Z. Chen and M. Huang, Curr. Drug Metab., 2015, 16, 816–832 CrossRef CAS PubMed.
- O. Taratula, C. Schumann, M. A. Naleway, A. J. Pang, K. J. Chon and O. Taratula, Mol. Pharm., 2013, 10, 3946–3958 CrossRef CAS PubMed.
- F. Lv, X. He, L. Wu and T. Liu, Bioorg. Med. Chem. Lett., 2013, 23, 1878–1882 CrossRef CAS PubMed.
- F. Lv, Y. Li, B. Cao and T. Liu, J. Mater. Sci.: Mater. Med., 2013, 24, 811–819 CrossRef CAS PubMed.
- F. Lv, B. Cao, Y. Cui and T. Liu, Molecules, 2012, 17, 6348–6361 CrossRef CAS PubMed.
- Y. Luo, X. Cai, H. Li, Y. Lin and D. Du, ACS Appl. Mater. Interfaces, 2016, 8, 4048–4055 CAS.
- M. Tian, X. Chen, Z. Gu, H. Li, L. Ma, X. Qi, H. Tan and C. You, Carbohydr. Polym., 2016, 144, 522–530 CrossRef CAS PubMed.
- T. Miao, S. L. Fenn, P. N. Charron and R. A. Oldinski, Biomacromolecules, 2015, 16, 3740–3750 CrossRef CAS PubMed.
- S. A. Hilderbrand and R. Weissleder, Curr. Opin. Chem. Biol., 2010, 14, 71–79 CrossRef CAS PubMed.
- Y. Zhang, F. Rossi, S. Papa, M. B. Violatto, P. Bigini, M. Sorbona, F. Redaelli, P. Veglianese, J. Hilborn and D. A. Ossipov, Acta Biomater., 2016, 30, 188–198 CrossRef CAS PubMed.
- N. Artzi, N. Oliva, C. Puron, S. Shitreet, S. Artzi, A. bon Ramos, A. Groothuis, G. Sahagian and E. R. Edelman, Nat. Mater., 2011, 10, 704–709 CrossRef CAS PubMed.
- C. Witt, K. Mader and T. Kissel, Biomaterials, 2000, 21, 931–938 CrossRef CAS PubMed.
- J. P. Bruggeman, B. J. de Bruin, C. J. Bettinger and R. Langer, Biomaterials, 2008, 29, 4726–4735 CrossRef CAS PubMed.
- C. C. M. Park and S. Song, Polym. Degrad. Stab., 2010, 65, 935–944 CrossRef.
Footnote |
| † These authors contributed equally to this work and should be considered co-first authors. |
| This journal is © The Royal Society of Chemistry 2017 |

