 Open Access Article
Synthesis of ultraluminescent gold core–shell nanoparticles as nanoimaging platforms for biosensing applications based on metal-enhanced fluorescence
D. Gonteroc,
A. V. Vegliaa,
A. G. Bracamonte *ab and
D. Boudreau
 b
b
aInstituto de Investigaciones en Fisicoquímica de Córdoba (INFIQC), Departamento de Química Orgánica, Facultad de Ciencias Químicas, Universidad Nacional de Córdoba, Ciudad Universitaria, 5000 Córdoba, Argentina. E-mail: gbracamonte@fcq.unc.edu.ar
bDepartement de chimie and Centre d'optique, photonique et laser (COPL), Université Laval, Québec (QC), G1V 0A6, Canada
cLaboratorio de Análisis Clínicos y Bacteriológicos, Clínica de la Familia II, Río Tercero, 5850, Córdoba, Argentina
First published on 6th February 2017
Abstract
Core–shell nanoparticles are versatile nanostructures that can be used as luminescent biosensing platforms in many nanotechnological developments. Ultraluminescent fluorescent gold core–shell nanoparticles based on Metal-Enhanced Fluorescence (MEF) were synthesized. The nanoparticles obtained were formed by 40.0 nm cores and variable silica spacer lengths. Silica spacer lengths from 6.0 to 25.0 nm were obtained. The plasmon maximal wavelength of the core–shell nanoparticles was shifted to a longer wavelength from a gold nanoparticle plasmon centered at 537.0 nm to 545.0 nm and 548 nm from 6.0 nm to 20.0 nm spacer length, respectively. The effect of the gold core on emission was evaluated by determination of Metal Enhanced Fluorescence enhancement factors (MEFEF), applying the sodium cyanide method for core leaching. We observed maximal MEFEF = 8.1 and 7.2 for 6.0 and 14.0 nm, respectively, and a significant decrease at longer silica spacer lengths. From nanoimaging by confocal fluorescence microscopy it was possible to detect ultraluminescent gold core–shell nanoparticle aggregates and obtain an MEFEF that can rise to 40. These parameters and properties were discussed from the point of view of fluorescent platform applications. Moreover in order to show the potential application of these nanoparticles in biodetection and nanomedicine, Escherichia coli bacteria were labelled with ultraluminescent nanoparticles. Bright and clear bacteria images were obtained by laser fluorescence microscopy. Based on these results, future applications for individual bacterial detection will be developed.
1. Introduction
Core–shell nanoparticles are versatile nanostructures that can be applied to many nanotechnological developments.1 In this research field many cores were used to be covered with polymeric shells that can be easily modified giving tuned properties.These multifunctional nanoparticles can be attached to silica surfaces forming part of the metasurfaces as quantum and optical circuits2 involved in energy transfer processes and transductions of emission fluorescent signals for nanodevices3 and lab-on-chip applications.4
The nanostructures composed of a metallic core and a silica shell allow the design of stable ultraluminescent platforms by modifying the silica layer with a fluorophore for a specific complementary plasmonic core in order to get optimal enhancements. The ultraluminescent properties are based on a plasmonic effect named Metal-Enhanced Fluorescence (MEF).
The MEF effect depends on the distance of the fluorophore from the metallic surface since the electromagnetic field intensity decays exponentially (1/r3), greatly affecting fluorophore excitation.5,6 Hence, in order to evaluate this parameter, many studies were developed using polymeric spacers as silica.7 In these nanoarchitectures, the fluorophore is covalently bonded and the concentration can be controlled for maximal enhancement. These studies into surfaces8 and colloidal dispersions9 based on nanoarchitecture design and application are now in progress.
In nanosensor developments, many studies were performed specially with silver core chemically modified with different silica spacer lengths due to the strong plasmonic properties.10 But, as far as we know, there are needs in nanosensor and nanoimaging developments with gold core–silica shell nanostructures based on MEF due to their wide plasmonic properties given by synthetic versatility and especially for biocompatibility.11
The parameters that should be controlled for optimal enhancement involve plasmonic complementarity of the nanoparticle with the fluorophore, distance and position of the dipolar momentum of the fluorophore from the metallic surface, concentration of the fluorophore, and aggregation state. Each of these parameters should be studied.
From these developments, applications on fluorescent platforms at a given wavelength emission or multi-wavelengths are required in Förster Resonance Energy Transfer (FRET) for biosensing. Moreover multifunctional nanoparticles in colloidal dispersion are also important for detection and tracking of biomolecules and biological structures such as virus and bacterias, based on analysis of nanoimages.
The impact of these concepts and research developments are shown on applications in clinical chemistry, as in determinations of biomolecules in blood samples. A fluorescent method developed by Zhang N. et al. (2008) based fluorescent sensing, using a FRET control strategy,12 on a novel assembly of gold nanoparticles grafted with monothiolated βCD for cholesterol determinations. Boudreau D. et al. (2013) developed a plasmon-enhanced energy transfer from a conjugated polymer to fluorescent core–shell nanoparticles13 applied to unamplified DNA detection by cytometry in flux system coupled with laser confocal fluorescence microscopy.14
Future developments of integrated silicon photonics15 for lab-on-chip16 applications and microfluidics can be carried out on the basis of these concepts.
The goal of this work was to develop ultraluminescent gold core–shell nanoparticles with Rhodamine B as emitter nuclei. In order achieve that, we synthesized a gold core covered with different lengths of silica spacers to study the MEF effect dependence on plasmon wavelength, intensity, and fluorophore-metallic surface distance in order to be applied as nanoimaging platforms for biosensing.
2. Experimental
2.1 Apparatus
UV-vis and spectrofluorimetric determinations were carried out in a Varian UV-50 Carry 50 Conc. and a Cary-Eclipse, respectively. Lifetime measurements were done with a PicoQuant, Fluo Time 2000.OLYMPUS Confocal Laser Scanning, FV1000, FLUOVIEW was used for fluorescence microscopy images.
Transmission electron microscopy (TEM) images were taken using a TEM JEM-1230, JEOL, with an operating voltage of 200 kV.
An ultrasonic bath (Branson 2510) was used for the solubilisation and dispersion of the reagents and colloidal dispersions respectively. The centrifugation was done using Eppendorf Centrifuge 5804 (rpm range 7500–8000 rpm).
Data analysis was performed with Origin (Scientific Graph system) version 8.
2.2 Reagents
Water was obtained using a Millipore apparatus. RhB (99% purity, Sigma-Aldrich), hydrogen tetrachloroaurate, HAuCl4·3H2O (99%, Sigma-Aldrich), citrate sodium tribasic dehydrate (99%, ACS reagent), TEOS tetraethyl orthosilicate (98%, Sigma-Aldrich), ethanol (Sintorgan, HPLC grade), 3-(aminopropyl)triethoxysilane, APS (98%, Sigma-Aldrich), N-hydroxi-succinimide (NHS) and N-(3-dimethylaminopropyl)-N′-ethylcarbodiimide hydrochloride (EDC) (98%, Sigma-Aldrich) were used; and sodium cyanide (95%, Sigma-Aldrich).2.3 General procedure
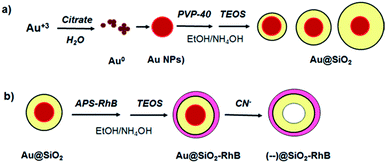
Gold nanoparticles were synthesized by the classical Turkevich method of citrate reduction of HAuCl4 and were afterward stabilized with PVP 40. The resulting nanoparticles were then redispersed in anhydrous ethanol (mother solution, [Au NPs] = 3.88 × 10¹⁰ NPs per mL, diameter 41.5 nm). This nanoparticle diameter was chosen in order to get an optimal nanoparticle plasmon band to interact with the fluorophore.After that the surface of the nanoparticles was modified with variable silica spacer lengths obtained by the classical Störber method.17 For a typical synthesis of gold core–shell nanoparticles (Au@SiO2), variable μL volumes of TEOS 10% (at pH = 8–9 by addition of NH4OH) were added to 4 mL of gold PVP-stabilized nanoparticles with vigorous agitation. Then it was covalently bonded to RhB with APS by NHS/EDC activation in order to afford RhB–APS conjugated. For RhB linking over the silica surface, from this solution, increasing variable volumes of RhB–APS were added to 1 mL of Au@SiO2 with continuous stirring reaction time was 20 min and immediately after a second thin silica shell was added via a solution of TEOS 2.5%. The reaction was let to react 24 h.
For MEFEF, core less silica nanoparticles ((--)@SiO2–RhB) were obtained by using the sodium cyanide leakage method18 (Vortexing of samples was applied overnight in the presence of sodium cyanide).
At each step of the synthesis the nanoparticles were centrifuged and redispersed in anhydrous ethanol. Centrifugation was done between (7400–8000) rpm depending on sample. Lower centrifugation speed was applied for (--)@SiO2–RhB and Au@SiO2–RhB in order to avoid RhB leakage (see synthesis steps of Au@SiO2–RhB in Scheme 1).
In order to quantify the RhB incorporated into the silica, the supernatant was collected from each sample after the centrifugation step of the reaction with APS–RhB. The RhB was liberated from the silica spacer with a high-speed centrifugation. And from a calibration curve with APS–RhB the concentration of RhB covalently bonded to the silica shell was estimated (mean concentration values were calculated from 3 different synthesis batches).
Fluorescence emission spectra were measured with an excitation wavelength equal to the maximum absorption wavelength of gold nanoparticles.
For emission and excitation fluorescence spectra, the excitation and emission bandwidths were set at 5 and 10 nm respectively. The PMT gain was medium. All the measurements were made at (25.0 ± 0.1) °C, with the temperature of the cell compartment controlled with a Haake K10 circulator with continuous stirring.
The lifetime measurements of Au@SiO2–RhB, Au@SiO2 and RhB free were performed in ethanol. In all the measurements, low concentrations (approximately 3.88 × 10⁸ NPs per mL that corresponds to the concentrated colloidal dispersion, or a dilution factor of 100 of the initial gold mother solution) of gold nanoparticles were used.
For bacteria–nanoparticle interaction, a dispersion of bacteria prepared from the colonies obtained from the culture growth media was prepared. Growth rates and bacterial concentrations were determined by measuring optical density (OD) at 600 nm each 30 min (OD of 0.1 corresponds to a concentration of 108 cells per mL). From a concentrated dispersion of bacteria in aqueous media, dilutions were prepared to observe, on the bright-field confocal microscope, from individual bacteria to micro-aggregates of bacteria. For bacterial fluorescent labelling, the dispersions prepared were in contact with ultraluminescent Au@SiO2–RhB nanoparticles from 0.9 to 5 × 10⁸ NPs per mL for 1 h. After that samples were observed by fluorescence microscopy with a minimal volume, adding 1 drop (50 μL) over microscope glass slide (covered after addition with a cover-glass).
3. Results and discussion
3.1 Synthesis of gold core–shell nanoparticles
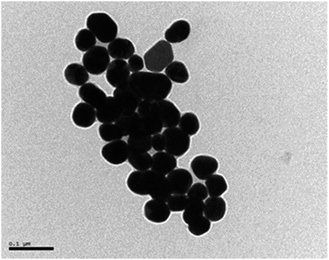 | ||
| Fig. 1 TEM of gold nanoparticles synthesized by the classical Turkevich method of citrate reduction of HAuCl4. Monodisperse spherical gold nanoparticles of 41.5 nm diameter were obtained. | ||
The plasmon absorption band was centered at 539 nm for the gold citrate stabilized nanoparticle (41.5 nm gold diameter).
Applying the Störber method, silica spacer lengths of 6, 14, 20 and 25 nm were obtained (TEM images shown in Fig. 2).
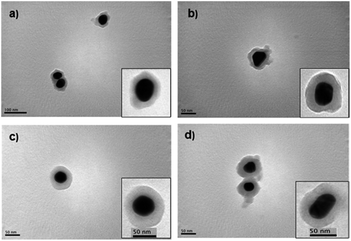 | ||
| Fig. 2 TEM images of core–shell nanoparticles, Au@SiO2, synthesized by the Störber method with different silica spacer lengths (a) 6 nm, (b) 14 nm, (c) 20 nm, (d) 25 nm. | ||
Comparable results were obtained by DLS spectroscopy (see Table 1).
| Method | Structure | Length (nm)a | |||
|---|---|---|---|---|---|
| S1 | S2 | S3 | S4 | ||
| TEM | Au@SiO2b | 52 | 70 | 80 | 85 |
| (–SiO2–)c | 6 | 15 | 20 | 23 | |
| DLS | Au@SiO2b | 60 | 64 | 80 | 84 |
| (–SiO2–)c | 10 | 12 | 20 | 22 | |
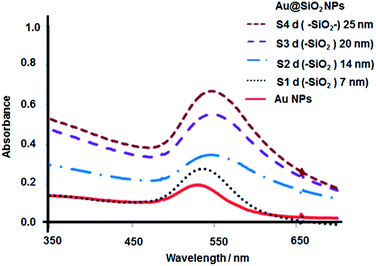
The plasmon maximal wavelength of the core–shell nanoparticles was shifted to longer wavelengths showing a dependence with the silica spacer length. The maximal absorption wavelength was 545.0 nm for 6 nm, 547.0 for 14 and 20 nm, and 548.0 nm for 25 nm spacer lengths, respectively (UV absorption spectra shown in Fig. 3). This effect is attributed to a quantum confinement on the metallic nanoparticle surface that affects the oscillation of electron frequencies in the presence of a dielectric shell with an effective permittivity.19 Au@SiO2 nanoparticles were more dispersible in aqueous and ethanol media compared with gold citrate and PVP stabilized nanoparticles.
3.2 Synthesis of fluorescent gold core–shell nanoparticles
3.3 Effect of silica spacer lengths on fluorescence emission of Rhodamine B
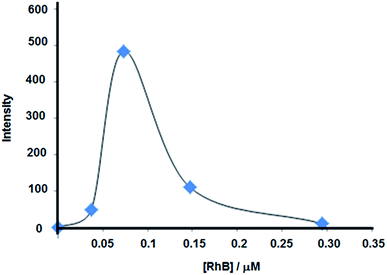
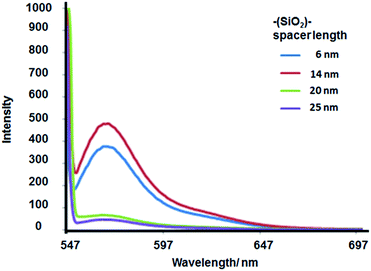
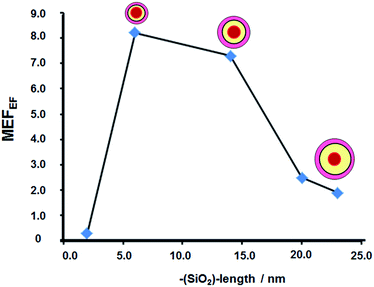
Different silica spacer lengths were synthesized by the Störber method as shown in Fig. 2 and Table 1. Increases in fluorescence emission were observed at 6 and 14 nm, while at 20 and 25 nm silica spacer lengths, we found a fluorescence emission decrease (see Fig. 5). These results correlate with theoretical studies where the electromagnetic field was calculated and where a maximum local field factor between 2–10 nm silica spacers was estimated.22 Moreover from experimental data obtained with Sulforhodamine B dye electrostatically incorporated into a Langmuir–Blodgett with layers of octadecylamine deposited on glass, a 10 nm length was obtained for optimal fluorescence enhancement based on MEF.23 Hence, the experimental correlation was shown between the local electromagnetic intensity in the near field of the gold core with the fluorescence emission enhancement. So, maximal intensities were measured at shorter silica spacer lengths and lower concentrations of fluorophores. However, the lower intensity was obtained with the higher concentration of fluorophore due to homo energy transfer quenching.3.4 Effect of gold core on fluorescence emission
In order to evaluate the effect of the core, it was obtained core-less nanoparticles ((--)@SiO2–RhB) by the sodium cyanide method. After leakage of the gold core, the plasmon decreased to zero, accompanied by a drastic diminution in fluorescence emission for silica spacer lengths 6–7 nm and 14 nm (see Fig. 6), that in presence of the core it was measured the higher emission signals (see Fig. 5).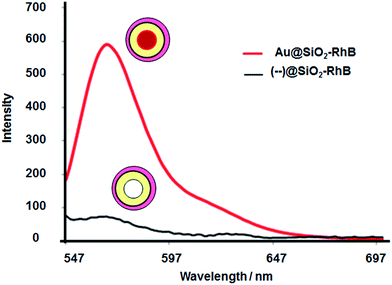 | ||
| Fig. 6 Effect of gold core on RhB emission fluorescence for Au@SiO2–RhB nanoparticles with silica spacer length = 6–7 nm and [RhB] = 0.073 μM. | ||
Aggregates of core-less nanoparticles were observed by TEM (see Fig. 7).
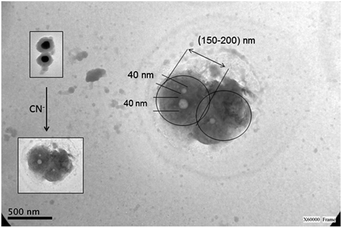 | ||
| Fig. 7 TEM images of core-less nanoparticles, (--)@SiO2–RhB, synthesized by the Störber method with silica spacer lengths of 14 nm. | ||
3.5 Measurements of fluorescence lifetime decays
In order to understand the photophysics of RhB close to the surface of gold nanoparticles, and their interaction with plasmonic properties, it was measured the fluorescence lifetime decays of Au@SiO2–RhB, (--)@SiO2–RhB and RhB free in the colloidal dispersion (see Fig. 8).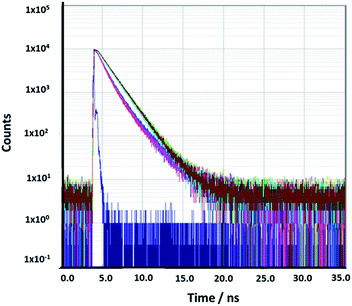 | ||
| Fig. 8 Rhodamine lifetime decays: Rhodamine B free in buffer (brown line) in the presence of Au@SiO2RhB with (–SiO2–) spacer length, 14.0 nm (pink line) and core-less nanoparticles (turquoise line). | ||
The lifetime value obtained for RhB in buffer was 1.6 ns, in agreement with the results reported previously (1.6 ns)24 and (1.7 ns).25
The lifetime value averages for the best luminescent Au@SiO2–RhB nanoparticles obtained were 65.0%, lower than those for RhB free in the colloidal dispersion; yet for (--)@SiO2–RhB core less nanoparticles, values were similar to those for RhB free in solution (see Table 2).
| Samplea | τ1 (ns)b | A1%b | τ2 (ns)b | A2%b | C2c | τav (ns)d |
|---|---|---|---|---|---|---|
| RhB | 1.589 (0.009) | 100 | — | — | 1.019 | 1.589 |
| Au@SiO2RhB | 0.893 (0.012) | 96.0 | 2.452 (0.057) | 4.0 | 1.831 | 0.954 |
| Core-less (-)@SiO2RhB | 1.102 (0.012) | 95.0 | 2.201 (0.051) | 5.0 | 1.69 | 1.157 |
This fluorescence-lifetime decay shortening is explained rest on MEF effect by a higher occupation of the upper excited levels based on higher excitation intensity. No differences were found between the samples with silica spacer lengths between 6–14 nm, and similar MEF enhancement factors were obtained. However, for the longer silica spacer lengths, no decrease was observed in the average lifetime fluorescence decay. For silver core–shell nanoparticles synthesized by Viger et al. 2009, differences of lifetime value averages of around 0.25 ns between spacer thickness of 7 (0.159 ns) and 13 nm (0.388 ns) were measured; yet the optimal MEF enhancement factor was obtained at a similar spacer length distance to that obtained for Au@SiO2–RhB (7 nm). Thus, Au@SiO2–RhB showed fluorescent emission enhancement accompanied with a decrease in the average of lifetime values characteristic of MEF.
3.6 Determination of metal enhanced fluorescence enhancement factor
The MEF enhancement factors were determined by a digestion of the gold core using the sodium cyanide method; therefore fluorescent core-less silica nanoparticles were obtained. From the fluorescence ratios of Au@SiO2–RhB and (--)@SiO2–RhB, the MEF enhancement factor was obtained.26The MEF enhancement factors (Fig. 9) showed distance dependence, with maximum value of 8.1 being at 6–7 nm and 7.2 for 12–14 nm silica spacer length. At longer distances a sharp diminution was observed. Both effects can be attributed to the interaction of the electromagnetic field in the near field of the gold surface nanoparticle and the RhB. At the right distance for an optimal interaction, an increase in absorption was found at the absorption wavelength of the fluorophore and emission enhancement.27
3.7 Nanoimaging by confocal fluorescence microscopy
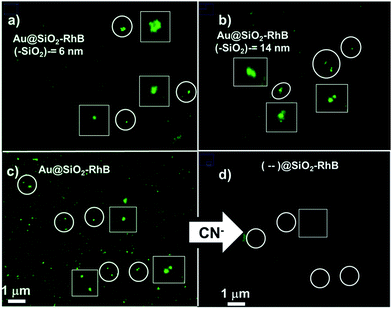
The most fluorescent nanoparticles were analyzed by fluorescence microscopy and clear, bright luminescent nanoparticles and nanoaggregates were observed. The intensities measured were higher for Au@SiO2–RhB with 14 nm silica spacer lengths than for 6–7 nm silica spacer lengths (see Fig. 10a and b), it being the same tendency as that observed by spectrofluorometry with colloidal dispersion. And from analysis of luminescence intensities from nanoaggregates images it was observed dimmers 4 times, and trimmers 2 times higher compared with individual nanoparticles. These increases are explained by an enhanced electromagnetic field generated by inter-nanoparticles plasmon coupling in the near field that affects the excited state of the fluorophore in the far field.28The MEF enhancement factor rises 3–4 times more than the values determined in colloidal dispersion. However, by fluorescent microscopy, the fluorescent core-less nanoparticles were collapsed and it was difficult to identify individual nanoparticles, while by spectrofluorometry of the colloidal dispersion, the ratios of fluorescence emission (Au@SiO2–RhB/(--)@SiO2–RhB) were determined using the mean of the whole system. But in all cases of fluorescence microscopy, the MEF enhancement factor was higher than 20; and it can rise to 40 showing by this manner clearly the ultraluminescent properties based on MEF (see Fig. 10c and d). These nanoarchitectures can be applied to surface modifications, as deposition of nanoparticles over glass slides for biotechnological applications.29 There are many examples of SIF (silver island film) depositions and MEF, although not so many with gold nanoparticles.
3.8 Bacteria biosensing
The brightest ultraluminescent nanoparticles were deposed on Escherichia coli bacteria in order be applied for microorganism biosensing. An intermediate bacteria concentration (×107 bacteria per mL) was let it to interact with a concentrated nanoparticle dispersion with continuous shaking. By this manner it was obtained a covered bacteria surface with the ultraluminescent nanoparticles. It was observed by laser fluorescence microscopy bright, clear and well defined bacteria images; and two distributions of luminescent nanoparticle intensities. The first one, with the higher intensity value as well it was measured on the bacteria labelled, and the second one with weaker intensity (Fig. 11). From the image analysis it was observed that in the conditions assayed the luminescence intensity of individual nanoparticles was not affected when they were deposed on the bacteria surface (Fig. 11a). By this manner ultraluminescent bacteria labelled were obtained.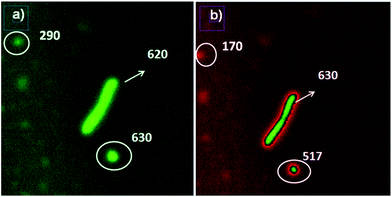 | ||
| Fig. 11 Laser fluorescence microscopy images of ultraluminescent bacteria labelled with Au@SiO2–RhB, silica spacer 14 nm: (a) edited by green colour; and (b) edited by red green colour. | ||
4. Conclusions
Stable ultraluminescent core–shell nanoparticles were synthesized controlling their luminescent properties by varying the presence of gold core, silica spacer length and concentration of the fluorophore. The maximal fluorescence emission intensity measured was obtained between distances 12–14 nm; however the MEF enhancement factor was obtained at 6–7 nm due to an optimal concentration value of the RhB incorporated. For 6–7 nm it was 8.1, and for 12–14 nm it was 7.2, accompanied with a 65% decrease in lifetime decay values compared with the RhB free; that it is characteristic of MEF.At longer silica spacer lengths, a significant decrease in fluorescence emissions and MEF enhancement factor were determined. The values of MEF enhancement factor raised to 30–40 by fluorescence microscopy. This value was affected by the conservation of the core-less nanostructure, but in all cases it was higher than 20 times and ultraluminescent hot spots of nanoaggregates were detected.
Thus, this type of fluorescent gold core–shell nanoparticles could be applied as luminescent platforms in nanosensor design for detection of molecular and biological structure based on nanoimaging. In order to evaluate the application; Escherichia coli bacteria was labelled with ultraluminescent nanoparticles and it was obtained bright and clear bacteria images by laser fluorescence microscopy. Based on these results future applications in individual bacterial detection will be developed.
Acknowledgements
We would like to acknowledge the different grants and funds which have allowed us to accomplish this work. We would also like to thank SECyT (Secretary of Science and Technology) from the National University of Cordoba (UNC), Argentina, for awarding us the first Grant for Young Researchers. We also thank Professor Denis Boudreau from Département de Chimie and Centre d'Optique, Photonique et Laser, Québec, Canada, for collaborative research work in progress. Moreover, thanks for the Artwork design to H. E. Gonzalez, student of Bachelor in chemistry from UNC.Notes and references
- J. L. West and N. J. Halas, Annu. Rev. Biomed. Eng., 2003, 5, 285–292 CrossRef CAS PubMed.
- W. Chen, M. Tymchenko, P. Gopalan, X. Ye, Y. Wu, M. Zhang, C. B. Murray, A. Alu and C. R. Kagan, Nano Lett., 2015, 15, 5254–5260 CrossRef CAS PubMed.
- M. Ohtsu, K. Kobayashi, T. Kawazoe, S. Sangu and T. Yatsui, IEEE J. Sel. Top. Quantum Electron., 2002, 8, 839–862 CrossRef CAS.
- G. Reithmaier, M. Kaniber, F. Flassig, S. Lichtmannecker, K. Müller, A. Andrejew, J. Vučković, R. Gross and J. J. Finley, Nano Lett., 2015, 15, 5208–5213 CrossRef CAS PubMed.
- J. R. Lackowicz, Anal. Biochem., 2005, 337, 171–194 CrossRef PubMed.
- J. Asselin, P. Legros, A. Grégoire and D. Boudreau, Plasmonics, 2016, 1, 1–8 Search PubMed.
- M. Lessard-Viger, M. Rioux, L. Rainville and D. Boudreau, Nano Lett., 2008, 9, 3066–30718 CrossRef PubMed.
- K. Ray, M. H. Chowdhury, H. Szmacinski and J. R. Lakowicz, J. Phys. Chem. C, 2008, 46, 17957–17963 Search PubMed.
- M. Lessard-Viger, D. Brouard and D. Boudreau, J. Phys. Chem. C, 2011, 115, 2974–2981 Search PubMed.
- K. Aslan, M. Wu, J. R. Lakowicz and C. D. Geddes, J. Am. Chem. Soc., 2007, 129, 1524–1525 CrossRef CAS PubMed.
- A. J. Mieszawska, W. J. M. Mulder, Z. A. Fayad and D. P. Cormode, Mol. Pharmaceutics, 2013, 10, 831–847 CrossRef CAS PubMed.
- N. Zhang, Y. Liu, L. Tong, K. Xu, L. Zhuo and B. Tang, Analyst, 2008, 133, 1176–1181 RSC.
- M. Lessard-Viger, D. Brouard and D. Boudreau, J. Phys. Chem. C, 2011, 115, 2974–2981 Search PubMed.
- D. Brouard, O. Ratelle, A. Guillermo Bracamonte, M. St-Louis and D. Boudreau, Anal. Methods, 2013, 5, 6896–6899 RSC.
- S. Khasminskayal, F. Pyatkov, K. Słowik, S. Ferrari, O. Kahl, V. Kovalyuk, P. Rath, A. Vetter, F. Hennrich, M. M. Kappes, G. Goltsman, A. Korneev, C. Rockstuhl, R. Krupke and W. H. P. Pernice, Nat. Photonics, 2016, 178, 1–7 Search PubMed.
- A. L. Washburn and R. C. Bailey, Analyst, 2011, 136, 227–236 RSC.
- C. Graf, D. L. J. Vossen, A. Imhof and A. van Blaaderen, Langmuir, 2003, 19, 6693–6700 CrossRef CAS.
- D. Paramelle, A. Sadovoy, S. Gorelik, P. Free, J. Hobley and D. G. Fernig, Analyst, 2014, 139, 4855–4864 RSC.
- K. Lance Kelly, E. Coronado, L. Lin Zhao and G. C. Schatz, J. Phys. Chem. B, 2003, 107, 668–677 CrossRef.
- M. C. Marchi, S. A. Bilmes and G. M. Bilmes, J. Colloid Interface Sci., 1999, 218, 112–117 CrossRef CAS PubMed.
- C. D. Geddes, Metal enhanced fluorescence, Wiley, 2010 Search PubMed.
- J. Zhu, K. Zhu and L.-Q. Huang, Phys. Lett. A, 2008, 372, 3283–3288 CrossRef CAS.
- K. Ray, R. Badugu and J. R. Lakowicz, J. Phys. Chem. C, 2007, 111, 7091–7097 CAS.
- M. J. Snare, F. E. Treloar, K. P. Ghiggino and P. J. Thistlethwaite, J. Photochem., 1982, 18, 335–346 CrossRef CAS.
- F. Lopez, P. Ruiz Ojeda and I. Lopez Arbeloa, J. Lumin., 1989, 44, 105–112 CrossRef.
- M. Lessard-Viger, M. Rioux, L. Rainville and D. Boudreau, Nano Lett., 2009, 9, 3066–3071 CrossRef CAS PubMed.
- K. Aslan and C. D. Geddes, Chem. Soc. Rev., 2009, 38, 2556–2564 RSC.
- R. Luchowski, N. Calandera, T. Shtoykod, E. Apicellaa, J. Borejdoa, Z. Gryczynskia and I. Gryczynskia, J. Nanophotonics, 2010, 4, 1–24 CrossRef PubMed.
- K. Aslan, I. Gryczynski, J. Malicka, E. Matveeva, J. R. Lakowicz and C. D. Geddes, Curr. Opin. Biotechnol., 2005, 16, 55–62 CrossRef CAS PubMed.
| This journal is © The Royal Society of Chemistry 2017 |

