 Open Access Article
Selective fluorescent turn-off sensing of Pd2+ ion: applications as paper strips, polystyrene films, and in cell imaging†
Pramod Kumar,
Vijay Kumar and
Rajeev Gupta *
*
Department of Chemistry, University of Delhi, Delhi 110007, India. E-mail: rgupta@chemistry.du.ac.in; Web: http://people.du.ac.in/˜rgupta/ Tel: +91-11-27666646
First published on 23rd January 2017
Abstract
Pyridine-2,6-dicarboxamide based scaffolds with appended naphthyl groups act as fluorescent probes for the selective detection of Pd2+ ions in aqueous medium. Collective studies comprising Job's plots, Benesi–Hildebrand fittings, Stern–Volmer plots and detection limits illustrate the notable sensing abilities of such probes for the Pd2+ ion. These probes further demonstrate potential applications as paper-strip sensors, as polystyrene film-based sensors, and in cell imaging.
Introduction
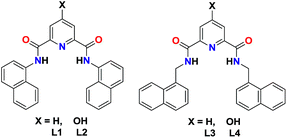
The development of sensitive yet selective fluorescent diagnostics for heavy and late transition metal ions is of immense interest due to the profuse use of such metals in various industrial and commercial applications.1,2 For example, palladium plays an important role in the production of dental and medical devices, jewelry, automobiles and as indispensable catalysts in numerous organic reactions.3,4 There always exists the possibility of an environmental hazard if the metal is not fully recovered and is released into the surroundings.5,6 Such a situation poses a significant threat to flora and fauna including humans.5,6 It is well established that palladium binds to thiol-containing amino acids and protein side chains.7 As a result, palladium raises significant health concerns due to its ability to perturb various cellular processes even when present in trace concentrations.7b It is therefore highly desirable to develop simple yet effective methods to detect residual palladium contamination.7b,8There are several analytical techniques for the detection of Pd2+ ion;9 however, fluorescent-based sensing has received great attention due to its high sensitivity and convenience to operate in biological samples.10 On the basis of coordination preference of Pd2+ ion, chelate-based fluorescent sensors11–13 as well as chemical reaction based sensors14,15 have been designed for its detection. Pyridine-2,6-dicarboxamide based scaffolds have been extensively used for coordinating assorted metal ions.16 We believe that the presence of a chelating cavity endows such scaffolds towards metal binding.16 However, if such a chelating cavity could also incorporate a suitable fluorophore; then such scaffolds may offer significant sensing possibilities.17 In this work, we present pyridine-2,6-dicarboxamide based fluorescent probes, L1–L4, offering a chelating cavity while also incorporating naphthyl groups as the fluorophores (Scheme 1). Such fluorescent probes display selective binding towards Pd2+ ion in aqueous medium. We also illustrate the applications of such probes in simple cost-effective paper-strip and polystyrene film based sensing as well as in cell imaging.
Results and discussion
Synthesis and characterization of probes
Fluorescent probes, L1–L4, were synthesized by the coupling of either pyridine-2,6-dicarboxylic acid or 4-hydroxy-pyridine-2,6-dicarboxylic acid with either 1-aminonaphthalene or 1-aminomethylene naphthalene. FTIR spectra of probes L1–L4 show N–H stretches between 3300 to 3385 cm−1 (Fig. S1–S4†). Interestingly, probe L4 also displayed O–H signal at 3640 cm−1. The proton NMR spectrum of L1 and L3 displayed only one signal for N–H group at 11.42 and 9.92 ppm, respectively. In contrast, probe L2 showed two signals at 11.34 and 11.63 ppm for two different N–H groups whereas L4 exhibited two resonances at 9.84 and 11.49 ppm assigned to O–H and N–H groups, respectively (Fig. S5–S12†). Both FTIR and 1H NMR spectra of probes L2 and L4 suggest the occurrence of their tautomeric forms. In the UV-Vis spectrum recorded in DMF, probes L1 and L2 display absorption maxima at ca. 295 nm whereas L3 and L4 exhibited λmax at ca. 280 nm (Fig. S13a†).Detection of Pd2+ ion
Fluorescent spectral studies on probes L1–L4 in presence of several metal ion were performed in HEPES buffer containing 1% DMF (10 mM, pH = 7.2). Probes L1 and L2 showed emission at 455 and 460 nm respectively after excitation at 310 nm. On the other hand, probes L3 and L4 exhibited prominent emission at 395 and 406 nm respectively after being excited at 290 nm (Fig. S13b†). Although placement of OH group at the para position of pyridine ring resulted in red-shift of the emission band but considerably reduced the emission intensity (Fig. S13b†). Under the identical conditions, fluorescence quantum yields of probes L1–L4 were measured using 2-aminopyridine as a reference (ΦS = 0.6).18 The quantum yields of probes L1–L4 were found to be 0.0044, 0.0026, 0.0083 and 0.0068, respectively. A comparison suggests that the introduction of OH group at the para position of pyridine ring has reduced the fluorescence quantum yield of probes L2 and L4 when compared to L1 and L3, respectively.Addition of five equivalents of various metal ion, such as Na+, Ca2+, Cr3+, Fe2+, Fe3+, Mn2+, Co2+, Ni2+, Cu2+, Zn2+, Ag+, Cd2+, Hg2+, Pb2+, Pt2+, Au3+, and Al3+ did not significantly perturb the emission intensity of probes L1–L4. However, presence of Pd2+ ion quenches the emission intensity to great extent (Fig. 1 and S14 and S15†). A comparison of four probes, L1–L4, illustrates that L3 and L4 not only exhibited remarkable emission but also much larger quenching as compared to probes L1 and L2 (Fig. S16†). Hence, probes L3 and L4 were selected for the further studies.
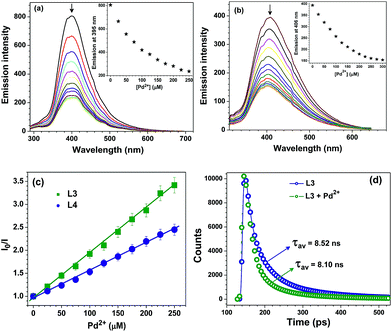
The change in fluorescence intensity of probes L3 and L4 were investigated by the incremental addition of Pd2+ ion which resulted in quantitative quenching (Fig. 2a and b). The quenching efficiency can be conveniently interpreted by calculating the Stern–Volmer constants (KSV).19 The Stern–Volmer plots provided KSV values of 4.48 × 10⁴ and 2.89 × 10⁴ M−1 for probes L3 and L4, respectively (Fig. 2c). Further, both fluorescent probes L3 and L4 showed noteworthy detection limits of 0.78 and 0.93 μM respectively for Pd2+ ion (Fig. S17†). Both KSV values as well as detection limits indicate that the probe L3 caused maximum quenching as compared to probe L4. Notably, Pd2+ detection limits of probes L3 and L4 are much better than its threshold limit of 47.0–94.0 μM in drugs and chemicals recommended by WHO.7b,11a Importantly, advanced analytical methods, such as atomic absorption spectrometry, inductively coupled plasma optical emission spectrometry, inductively coupled plasma mass spectrometry, and X-ray fluorescence spectroscopy, used for the quantification of palladium require sophisticated instrumentation, complicated sample preparation, rigorous experimental conditions, and well-trained individuals while the present method relies on a simple fluorescence technique.9 Time-resolved fluorescence studies explained the excited state behavior of probe L3 in the absence and presence of Pd2+ ion in buffer solution (Fig. 2d).20 The decay profile of probe L3 exhibited a tri-exponential decay with average lifetime of τav = 8.52 ns. With the addition of 5 equivalents of Pd2+ ion, the average lifetime of probe L3 showed a decrease (τav = 8.10 ns). Such a fact suggests complexation of Pd(II) ion with probe L3 which agrees well with other studies (vide infra).
Selectivity studies for Pd2+ ion
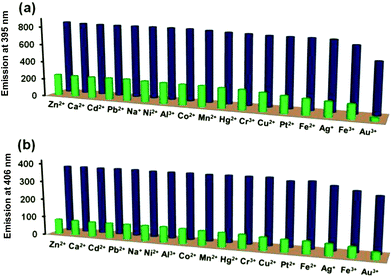
It is desirable for a good chemosensor to show fast response and high sensitivity in addition to high degree of selectivity. To evaluate the interference from other metal ions in the detection of Pd2+ ion, competitive binding studies were investigated in presence of following metal ions: Na+, Ca2+, Cr3+, Fe2+, Fe3+, Mn2+, Co2+, Ni2+, Cu2+, Zn2+, Ag+, Cd2+, Hg2+, Pb2+, Pt2+, Au3+, and Al3+. For such competitive binding studies, matching concentrations of Pd2+ ion and other metal ions were tested. Fig. 3 nicely illustrates that no other metal ion effectively intervened with the Pd2+ ion detection suggesting that both probes L3 and L4 function as the selective sensors for the detection of Pd2+ ion even in presence of other potential metal ions. We also investigated the change in emission intensity of probes L3 and L4 in presence of different palladium salts such as PdCl2, Pd(CH3COO)2, Pd(NO3)2 and K2PdCl4 (Fig. S18†). Notably, all four palladium salts showed a very similar quenching in the emission intensity of probes L3 and L4, thus suggesting no prominent role of the associated anion.Binding stoichiometry for Pd2+ ion
The binding stoichiometry and association constants for naphthyl-methylene based probes L3 and L4 were investigated from Job's plots21 as well as Benesi–Hildebrand plots22 using fluorescence measurement. Using Job's method of continuous variation of mole fraction, a stoichiometry of 1![[thin space (1/6-em)]](https://www.rsc.org/images/entities/char_2009.gif) :
:![[thin space (1/6-em)]](https://www.rsc.org/images/entities/char_2009.gif) 1 was observed for Pd2+ ion with probes L3 and L4 (Fig. S19†).17 The binding stoichiometry was further investigated by the Benesi–Hildebrand fitting which additionally supported a 1
1 was observed for Pd2+ ion with probes L3 and L4 (Fig. S19†).17 The binding stoichiometry was further investigated by the Benesi–Hildebrand fitting which additionally supported a 1![[thin space (1/6-em)]](https://www.rsc.org/images/entities/char_2009.gif) :
:![[thin space (1/6-em)]](https://www.rsc.org/images/entities/char_2009.gif) 1 stoichiometry.17 The binding constants, Kb, computed for Pd2+ ion were 7.68 × 10³ M−1 and 2.92 × 10³ M−1 for L3 and L4 respectively using the Benesi–Hildebrand method (Fig. S20†). Both Job's plot and Benesi–Hildebrand method inferred a 1
1 stoichiometry.17 The binding constants, Kb, computed for Pd2+ ion were 7.68 × 10³ M−1 and 2.92 × 10³ M−1 for L3 and L4 respectively using the Benesi–Hildebrand method (Fig. S20†). Both Job's plot and Benesi–Hildebrand method inferred a 1![[thin space (1/6-em)]](https://www.rsc.org/images/entities/char_2009.gif) :
:![[thin space (1/6-em)]](https://www.rsc.org/images/entities/char_2009.gif) 1 stoichiometry and formation of [Pd–L3] and [Pd–L4] complexes of Pd2+ ion with probes L3 and L4, respectively. The formation of [Pd–L3] and [Pd–L4] was further investigated by the UV-Vis spectral titrations. The change in absorption spectra by the addition of Pd2+ ion suggested the interaction of Pd2+ ion with probes L3 and L4 (Fig. S21†). These studies further supported the emission spectral titrations.
1 stoichiometry and formation of [Pd–L3] and [Pd–L4] complexes of Pd2+ ion with probes L3 and L4, respectively. The formation of [Pd–L3] and [Pd–L4] was further investigated by the UV-Vis spectral titrations. The change in absorption spectra by the addition of Pd2+ ion suggested the interaction of Pd2+ ion with probes L3 and L4 (Fig. S21†). These studies further supported the emission spectral titrations.
Isolation of complex 1
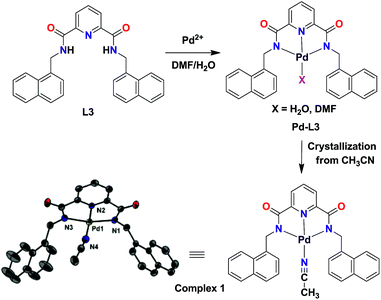
To gain a conclusive insight, we attempted to isolate the product from the reaction between Pd2+ ion and L3 as this probe provided the best detection results. A white product was isolated when probe L3 was treated with Pd(CH3COO)2 in DMF/H2O. Subsequent recrystallization from MeCN afforded a crystalline product, namely complex 1. FTIR spectrum of 1 showed the disappearance of N–H peaks and red-shifted Oamide bands; both inferring coordination of Pd(II) ion by the deprotonated form of probe L3 (Fig. S22†).23 Further, C![[triple bond, length as m-dash]](https://www.rsc.org/images/entities/char_e002.gif) N stretches for the coordinated CH3CN were clearly visible between 2325–2298 cm−1. 1H NMR spectrum of 1 further confirmed the disappearance of N–H signals whereas coordinated CH3CN was noted at 2.04 ppm (Fig. S23†). Complex 1 was crystallographically characterized and the molecular structure is shown in Fig. 4. The Pd(II) ion adopts a distorted square-planar geometry coordinated within the N3 pincer cavity created by a Npyridine and two Namide atoms.24 The fourth coordination is provided by an acetonitrile molecule. As anticipated, complex 1 is fluorescence inactive in solution (Fig. S24†) as well as in the solid state.
N stretches for the coordinated CH3CN were clearly visible between 2325–2298 cm−1. 1H NMR spectrum of 1 further confirmed the disappearance of N–H signals whereas coordinated CH3CN was noted at 2.04 ppm (Fig. S23†). Complex 1 was crystallographically characterized and the molecular structure is shown in Fig. 4. The Pd(II) ion adopts a distorted square-planar geometry coordinated within the N3 pincer cavity created by a Npyridine and two Namide atoms.24 The fourth coordination is provided by an acetonitrile molecule. As anticipated, complex 1 is fluorescence inactive in solution (Fig. S24†) as well as in the solid state.
Fabrication of filter paper strips and polystyrene films
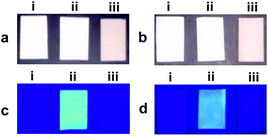
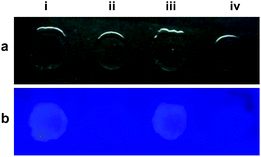
Despite notable work on sensing of palladium, straight-forward and cost-effective detection methods still remain a challenge.12f,25 Such an approach will be beneficial for an effective detection under various experimental conditions. In this context, we attempted to fabricate filter paper test strips containing probes L3 and L4 due to their promising emission properties. The filter paper strips were coated with probes by immersing them in HEPES buffer solutions of L3 and L4 (containing 1% DMF, 10 mM, pH = 7.2) followed by drying in air. Such test strips were used directly by dipping them into an aqueous solution of any Pd(II) salt. As can be seen from Fig. 5, both probes were quite effective in detecting Pd2+ ion from the aqueous solutions.We also fabricated peelable polystyrene films by doping probes L3 and L4 during their synthesis.17a Such films were used for the detection of Pd2+ ion from the aqueous medium as illustrated in Fig. 6. Notably, these polystyrene films provided options to fabricate cheap yet mouldable options for sensing Pd2+ ion from the aqueous medium.
Cytotoxicity and cell imaging
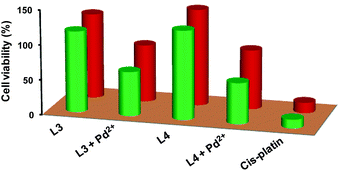
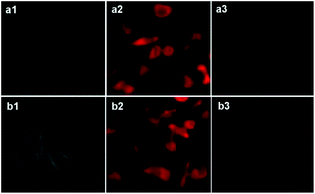
The Pd2+ ion is toxic to living organism; therefore, its detection inside a cell would be an important factor to ascertain the efficiency of probes L3 and L4. However, before going to cell imaging, cytotoxicity activities of probes L3 and L4 in presence/absence of Pd2+ ion for HEK-293 and L929 cell lines were investigated using MTT assay.26 In vitro cytotoxicity against HEK-293 and L929 cells in terms of IC50 values is presented in Fig. 7 and compared with the anti-cancer drug cis-platin. The results exhibit that probes L3 and L4 are very less cytotoxic in absence of Pd2+ ion. Although, presence of Pd2+ ion somewhat increases the cytotoxicity against both cell lines; the probe-Pd combinations are still quite safe than that of cis-platin. These experiments also suggest that both probes L3 and L4 are able to penetrate the cell wall without causing any damage to the cells.The cell-imaging experiments were performed to ascertain whether probes L3 and L4 are able to detect Pd2+ ion in living cells. Thus, when L929 cells were incubated with probes L3 or L4 (50 μM) at 37 °C for 90 min, these cells showed an intense fluorescence (Fig. 8, panels a2 and b2). After being treated with Pd2+ ion (250 μM) for 90 min at 37 °C; these cells showed negligible fluorescence (Fig. 8, panels a3 and b3). These experiments assert that both probes L3 and L4 are able to detect Pd2+ ion in the biological samples.
Conclusions
In conclusion, a series of pincer cavity based probes (L1–L4) has been developed for the selective detection of Pd2+ ion. Fluorescence quenching, Stern–Volmer plots and detection limits advocated strong sensing abilities of probes L3 and L4 for Pd2+ ion. The Pd2+ ion was found to bind with probes L3 and L4 by forming a 1![[thin space (1/6-em)]](https://www.rsc.org/images/entities/char_2009.gif) :
:![[thin space (1/6-em)]](https://www.rsc.org/images/entities/char_2009.gif) 1 complex, a fact proved by the crystal structure of [L3–Pd] complex. Filter paper test strips and polystyrene based films validated the cost-effective detection methods for Pd2+ ion. Probes L3 and L4 were also utilized for the fluorescence based cell imaging and the results were supplemented with cell viability studies. This report illustrates a simple strategy of developing pincer-cavity based selective probes for palladium ion and may find application in tracking palladium as well as other toxic metals ions in industrial affluent and living organism.
1 complex, a fact proved by the crystal structure of [L3–Pd] complex. Filter paper test strips and polystyrene based films validated the cost-effective detection methods for Pd2+ ion. Probes L3 and L4 were also utilized for the fluorescence based cell imaging and the results were supplemented with cell viability studies. This report illustrates a simple strategy of developing pincer-cavity based selective probes for palladium ion and may find application in tracking palladium as well as other toxic metals ions in industrial affluent and living organism.
Experimental section
Materials
The analytical grade chemicals and metal salts were used as received without further purifications. High quality HPLC grade solvents were used for the UV-Vis and fluorescence spectral measurements. The probes L1 and L3 are reported in literature but have been synthesized using different synthetic methods.27 However, in the present manuscript; all four probes L1–L4 have been synthesized in high yield using a common procedure. HEK-293 (human embryonic kidney cells 293) and L929 cells (murine cells) were obtained from the National Center for Cell Science (NCCS), Pune, India. MTT (3-(4,5-dimethyl-2-thiazolyl)-2,5-diphenyltetrazolium bromide) and cell culture grade DMSO were obtained from the Himedia (Mumbai, India). Injectable cisplatin was obtained from the Ranbaxy (Mumbai, India).Physical measurements
Elemental analysis data were obtained from the Elementar Analysen Systeme GmbH Vario EL-III instrument. The 1H and 13C NMR spectra were recorded with a JEOL 400 MHz NMR instrument. FTIR spectra were recorded using a Perkin-Elmer Spectrum-Two spectrometer having Zn–Se ATR. The absorption spectra were measured with a Perkin-Elmer Lambda-25 spectrophotometer. Fluorescence spectral studies were performed with a Cary Eclipse fluorescence spectrophotometer. ESI-MS mass spectra were obtained with Agilent Q-TOF LC-MS mass spectrometer. Time-resolved fluorescence spectra were recorded using a picosecond fluorimeter from Horiba Jobin Yvon (FluoroHub).Synthesis of probes and complexes
![[thin space (1/6-em)]](https://www.rsc.org/images/entities/char_2009.gif) 760). 1H NMR spectrum (400 MHz, DMSO-d6): δ = 11.42 (s, 1H), 8.42 (d, J = 7.60 Hz, 2H), 8.72 (t, J = 7.20 Hz, 1H), 8.08 (d, J = 8.0 Hz, 2H), 7.97 (d, J = 8.0 Hz, 2H), 7.88 (d, J = 8.0 Hz, 2H), 7.67 (d, J = 6.80 Hz, 2H), 7.60–7.52 (m, 6H). 13C NMR spectrum (100 MHz, DMSO-d6): 163.19, 149.30, 140.65, 134.28, 133.57, 129.89, 128.69, 127.27, 126.83, 126.16, 125.85, 124.90, 123.87, 115.74.
760). 1H NMR spectrum (400 MHz, DMSO-d6): δ = 11.42 (s, 1H), 8.42 (d, J = 7.60 Hz, 2H), 8.72 (t, J = 7.20 Hz, 1H), 8.08 (d, J = 8.0 Hz, 2H), 7.97 (d, J = 8.0 Hz, 2H), 7.88 (d, J = 8.0 Hz, 2H), 7.67 (d, J = 6.80 Hz, 2H), 7.60–7.52 (m, 6H). 13C NMR spectrum (100 MHz, DMSO-d6): 163.19, 149.30, 140.65, 134.28, 133.57, 129.89, 128.69, 127.27, 126.83, 126.16, 125.85, 124.90, 123.87, 115.74.![[thin space (1/6-em)]](https://www.rsc.org/images/entities/char_2009.gif) 940). Mass spectrum (ESI+, MeOH, m/z): calc. 433.1426 for L2; found 434.1502 for L2 + H+. 1H NMR spectrum (400 MHz, DMSO-d6): δ = 11.63 (s, 1H), 11.34 (s, 2H), 8.06 (d, J = 8.01 Hz, 2H), 7.96 (d, J = 7.60 Hz, 2H), 7.87 (d, J = 8.03 Hz, 2H), 7.75 (s, 2H), 7.66 (d, J = 6.81 Hz, 2H), 7.60–7.52 (m, 6H). 13C NMR spectrum (100 MHz, DMSO-d6): 167.5, 163.2, 151.3, 134.2, 133.6, 129.8, 128.6, 127.1, 126.8, 126.7, 126.1, 124.7, 123.8, 112.8.
940). Mass spectrum (ESI+, MeOH, m/z): calc. 433.1426 for L2; found 434.1502 for L2 + H+. 1H NMR spectrum (400 MHz, DMSO-d6): δ = 11.63 (s, 1H), 11.34 (s, 2H), 8.06 (d, J = 8.01 Hz, 2H), 7.96 (d, J = 7.60 Hz, 2H), 7.87 (d, J = 8.03 Hz, 2H), 7.75 (s, 2H), 7.66 (d, J = 6.81 Hz, 2H), 7.60–7.52 (m, 6H). 13C NMR spectrum (100 MHz, DMSO-d6): 167.5, 163.2, 151.3, 134.2, 133.6, 129.8, 128.6, 127.1, 126.8, 126.7, 126.1, 124.7, 123.8, 112.8.![[thin space (1/6-em)]](https://www.rsc.org/images/entities/char_2009.gif) 150). Mass spectrum (ESI+, MeOH, m/z): calc. 445.1790 for L3; found 446.1866 for L3 + H+. 1H NMR spectrum (400 MHz, DMSO-d6): δ = 9.92 (t, J = 5.60 Hz, 2H), 8.26 (d, J = 8.02 Hz, 2H), 8.20–8.15 (m, 3H), 7.91 (t, J = 5.22 Hz, 2H), 7.80 (d, J = 4.40 Hz, 2H), 7.50 (t, J = 4.42 Hz, 4H), 7.42 (d, J = 6.42 Hz, 4H), 5.03 (d, J = 6.02 Hz, 4H). 13C NMR spectrum (100 MHz, DMSO-d6): 163.90, 149.20, 140.22, 134.77, 133.77, 131.12, 129.12, 128.00, 126.85, 126.39, 125.97, 125.22, 124.90, 123.75, 115.74, 40.77.
150). Mass spectrum (ESI+, MeOH, m/z): calc. 445.1790 for L3; found 446.1866 for L3 + H+. 1H NMR spectrum (400 MHz, DMSO-d6): δ = 9.92 (t, J = 5.60 Hz, 2H), 8.26 (d, J = 8.02 Hz, 2H), 8.20–8.15 (m, 3H), 7.91 (t, J = 5.22 Hz, 2H), 7.80 (d, J = 4.40 Hz, 2H), 7.50 (t, J = 4.42 Hz, 4H), 7.42 (d, J = 6.42 Hz, 4H), 5.03 (d, J = 6.02 Hz, 4H). 13C NMR spectrum (100 MHz, DMSO-d6): 163.90, 149.20, 140.22, 134.77, 133.77, 131.12, 129.12, 128.00, 126.85, 126.39, 125.97, 125.22, 124.90, 123.75, 115.74, 40.77.![[double bond, length as m-dash]](https://www.rsc.org/images/entities/char_e001.gif) O), 1528, 1336. UV/Vis spectrum (DMF, ε, M−1 cm−1): λmax 280 (18
O), 1528, 1336. UV/Vis spectrum (DMF, ε, M−1 cm−1): λmax 280 (18![[thin space (1/6-em)]](https://www.rsc.org/images/entities/char_2009.gif) 350). Mass spectrum (ESI+, MeOH, m/z): calc. 461.1739 for L4; found 462.1828 for L4 + H+. 1H NMR spectrum (400 MHz, DMSO-d6): δ = 11.49 (s, 1H), δ = 9.84 (t, J = 6.02 Hz, 2H), 8.16 (d, J = 6.82 Hz, 2H), 7.90 (d, J = 8.81 Hz, 2H), 7.80 (d, J = 7.63 Hz, 2H), 7.61 (s, 2H), 7.50 (t, J = 4.48 Hz, 4H), 7.44–7.39 (m, 4H), 5.00 (d, J = 5.60 Hz, 4H). 13C NMR spectrum (100 MHz, DMSO-d6): 167.25, 163.98, 151.22, 134.84, 133.77, 131.13, 129.11, 127.97, 126.84, 126.38, 125.97, 124.91, 123.75, 112.26, 40.76.
350). Mass spectrum (ESI+, MeOH, m/z): calc. 461.1739 for L4; found 462.1828 for L4 + H+. 1H NMR spectrum (400 MHz, DMSO-d6): δ = 11.49 (s, 1H), δ = 9.84 (t, J = 6.02 Hz, 2H), 8.16 (d, J = 6.82 Hz, 2H), 7.90 (d, J = 8.81 Hz, 2H), 7.80 (d, J = 7.63 Hz, 2H), 7.61 (s, 2H), 7.50 (t, J = 4.48 Hz, 4H), 7.44–7.39 (m, 4H), 5.00 (d, J = 5.60 Hz, 4H). 13C NMR spectrum (100 MHz, DMSO-d6): 167.25, 163.98, 151.22, 134.84, 133.77, 131.13, 129.11, 127.97, 126.84, 126.38, 125.97, 124.91, 123.75, 112.26, 40.76.![[thin space (1/6-em)]](https://www.rsc.org/images/entities/char_2009.gif) :
:![[thin space (1/6-em)]](https://www.rsc.org/images/entities/char_2009.gif) 1 v/v, 5 mL) and a solution of Pd(CH3COO)2 (0.050 g, 0.224 mmol) in 2 mL H2O was added drop-wise. The reaction mixture was stirred for 2 h under ambient conditions. The solvent was evaporated under the reduced pressure to obtain a pale yellow solid. Yellow crystalline product was obtained within a day by the slow evaporation of an acetonitrile solution of the crude product. Yield: 0.108 g (82%). Anal. calc. for C31H24N4O2Pd: C, 63.00; H, 4.09; N, 9.48. Found: C, 63.06; H, 4.12; N, 9.53. FTIR spectrum (Zn–Se ATR, cm−1): 2325, 2298 (C
1 v/v, 5 mL) and a solution of Pd(CH3COO)2 (0.050 g, 0.224 mmol) in 2 mL H2O was added drop-wise. The reaction mixture was stirred for 2 h under ambient conditions. The solvent was evaporated under the reduced pressure to obtain a pale yellow solid. Yellow crystalline product was obtained within a day by the slow evaporation of an acetonitrile solution of the crude product. Yield: 0.108 g (82%). Anal. calc. for C31H24N4O2Pd: C, 63.00; H, 4.09; N, 9.48. Found: C, 63.06; H, 4.12; N, 9.53. FTIR spectrum (Zn–Se ATR, cm−1): 2325, 2298 (C![[triple bond, length as m-dash]](https://www.rsc.org/images/entities/char_e002.gif) NCH3CN), 1601 (C
NCH3CN), 1601 (C![[double bond, length as m-dash]](https://www.rsc.org/images/entities/char_e001.gif) O), 1374. 1H NMR spectrum (400 MHz, DMSO-d6): δ = 8.23 (t, J = 6.88 Hz, 1H), 8.09 (d, J = 6.87 Hz, 2H), 7.90 (d, J = 7.64 Hz, 2H), 7.77–7.71 (m, 6H), 7.55–7.45 (m, 6H), 4.74 (s, 4H), 2.04 (s, 3H).
O), 1374. 1H NMR spectrum (400 MHz, DMSO-d6): δ = 8.23 (t, J = 6.88 Hz, 1H), 8.09 (d, J = 6.87 Hz, 2H), 7.90 (d, J = 7.64 Hz, 2H), 7.77–7.71 (m, 6H), 7.55–7.45 (m, 6H), 4.74 (s, 4H), 2.04 (s, 3H).General methods and determination of constants
All stock solutions (10 mM) of metal ions Na+, Ca2+, Cr3+, Fe2+, Fe3+, Mn2+, Co2+, Ni2+, Cu2+, Zn2+, Ag+, Cd2+, Hg2+, Pb2+, Pd2+, Pt2+, Au3+, and Al3+ were prepared in H2O or DMF according to their solubility. All UV-Vis and fluorescence spectra were recorded with a cuvette of 1.0 cm path length at room temperature (25 ± 1 °C).The fluorescence quantum yields (Φ) for fluorescent probes L1–L4 were calculated using the eqn (1) using 2-aminopyridine as a standard (ΦS = 0.6) in 0.1 N H2SO4.18
| ΦX = ΦS(IX/IS)(AX/AS)(ηX2/ηS2) | (1) |
The Stern–Volmer constants (KSV) were evaluated by a plot between I0/I and [Pd2+] using Stern–Volmer eqn (2).19
| I0/I = 1 + KSV[Pd2+] | (2) |
The detection limit for the detection of Pd2+ ion was calculated using the eqn (3).28
| Detection limit: 3σ/k | (3) |
The binding stoichiometry of Pd2+ ion with probes L3 and L4 was determined by the Job's plot using mole fraction.21 The binding constant (Kb) was determined by the Benesi–Hildebrand eqn (4) by plotting 1/(I − I0) against 1/[Pd2+].22
| 1/(I − I0) = 1/{Kb(I0 − Imin)[Pd2+]} + 1/(I0 − Imin) | (4) |
Fabrication of filter paper strips
Strips of Whatman filter paper were dipped in a solution of probes L3 or L4 in HEPES buffer solution containing 1% DMF (10 mM, pH = 7.2) and were air-dried to prepare the test strips. Test strips coated with either L3 or L4 were dipped for a few seconds directly into the aqueous solution of palladium acetate. Such paper strips were then investigated under the visible and ultraviolet light.Fabrication of polystyrene films
A mixture of styrene (0.5 mL) containing α,α′-azoisobutyronitrile (AIBN; 1 mg) and probes L3 or L4 in methanol (0.5 mL) was heated on water bath at 80 °C for 30 min. Subsequently, a few drops of hot clear solution were poured over a glass slide and the resultant glass slide was air dried to produce a film of polystyrene. Such films were peeled off from the glass slide and were used for detecting Pd(II) ion by directing dipping in an aqueous solution of Pd(CH3COO)2. These polystyrene films were then photographed under the visible and ultraviolet light.In vitro cytotoxicity assay
The cytotoxicity potentials of probes L3 and L4, in absence and presence of Pd2+ ion, were evaluated by the MTT (3-(4,5-dimethylthiazol-2-yl)-2,5-diphenyltetrazolium bromide) assay using L929 and HEK-293 cell line.26 These cells (1 × 10⁴) were seeded on 96-well plates in growth medium and incubated for 24 h at 37 °C in CO2 incubator. Serial concentrations of probes L3 and L4 and Pd(II) salt ranging from 0.05–200 μM in DMSO were added to the wells and such well were incubated for next 24 h.29 MTT labelling mixture (5 mg mL−1) was added to the cells after discarding the medium, and incubated for 2 h at 37 °C. MTT and media were removed and 100 μL of pure DMSO was added to each well plate to dissolve the formazon crystals. The result of MTT assay was expressed in percentage of inhibition and values were determined on Fluostar optima (BMG Labtech, Germany) microplate reader at 570 nm. All experiments were independently repeated three times.Fluorescence cell imaging
In vitro cell imaging with probes L3 and L4, in absence and presence of Pd2+ ion, were analyzed with murine cells L929. The L929 cells were cultured in DMEM growth medium (supplemented with 1% streptomycin as antibiotic) and incubated at 37 °C in CO2 incubator. Cells were seeded (1.0 × 10⁵ cells per well) in six well plate and incubated at 37 °C for 12 h. Probe L3 and L4 (50 μM) were added to these cells in phosphate buffer saline (PBS) and incubated for 90 min.30 In an additional set of experiments, cells were incubated with the same probes L3 and L4 (50 μM) however in presence of Pd2+ ion (1 mM). After 90 min incubation, cells were washed with PBS to remove the traces of probe L3 and L4. As a final point, the cells were fixed with 4% paraformaldehyde solution and images were acquired using the Upright Microscope (Axio Imager 2.2, Carl Zeiss, Germany).X-ray crystallography
Single crystals suitable for the X-ray diffraction studies were grown by the slow evaporation of an acetonitrile solution of [Pd–L3] complex. The intensity data were collected at 298 K with an Oxford XCalibur CCD diffractometer equipped with a graphite monochromated Mo-Kα radiation (λ = 0.71073 Å).31 Data reduction was performed with the CrysAllisPro program (Oxford Diffraction ver. 171.34.40).31 The structure was solved using the direct methods using SHELXS-97 (ref. 32) and refined on F2 using all data by full matrix least-squares procedures with SHELXL-97 within the OLEX-2 suite.33 The hydrogen atoms were placed at the calculated positions and included in the last cycles of the refinement. All calculations were done using the WinGX software package.34 Crystallographic data collection and structure solution parameters are summarized in Table 1. CCDC-1455263 contains the supplementary crystallographic data for this paper.†| a R1 = ∑||Fo| − |Fc||/∑|Fo|; wR2 = {∑[w(|Fo|2 − |Fc|2)2]/∑[wFo4]}1/2. | |
|---|---|
| Empirical formula | C31H24N4O2Pd |
| Formula weight | 590.94 |
| T (K) | 293(2) |
| System | Monoclinic |
| Space group | P21/c |
| a (Å) | 16.3379(4) |
| b (Å) | 10.9218(3) |
| c (Å) | 15.1158(4) |
| α (°) | 90.00 |
| β (°) | 106.795(3) |
| γ (°) | 90.00 |
| V (Å3) | 2582.20(12) |
| Z | 4 |
| ρcalc (mg m−3) | 1.520 |
| F (000) | 1200 |
| Goodness-of-fit (GOF) on F2 | 0.980 |
| Final R indices [I > 2σ(I)] | R1 = 0.0442, wR2 = 0.0818 |
| R indices (all data)a | R1 = 0.0692, wR2 = 0.0909 |
| CCDC no. | 1455263 |
Acknowledgements
PK thanks UGC, New Delhi for the award of Dr D. S. Kothari Postdoctoral fellowship. RG acknowledges the Council of Scientific and Industrial Research (CSIR), New Delhi and the University of Delhi for the financial support. Authors thank the CIF-USIC at this university for the instrumental facilities including crystallographic data collection.Notes and references
- (a) K. P. Carter, A. M. Young and A. E. Palmer, Chem. Rev., 2014, 114, 4564 CrossRef CAS PubMed; (b) J. Chan, S. C. Dodani and C. J. Chang, Nature, 2012, 4, 973 CAS; (c) X. L. Zhang, Y. Xiao and X. H. Qian, Angew. Chem., Int. Ed., 2008, 47, 8025 CrossRef CAS PubMed.
- (a) E. W. Miller, Q. He and C. J. Chang, Nat. Protoc., 2008, 3, 777 CrossRef CAS PubMed; (b) X. Peng, J. Du, J. Fan, J. Wang, Y. Wu, J. Zhao, S. Sun and T. Xu, J. Am. Chem. Soc., 2007, 129, 1500 CrossRef CAS PubMed.
- (a) T. Iwasawa, M. Tokunaga, Y. Obora and Y. Tsuji, J. Am. Chem. Soc., 2004, 126, 6554 CrossRef CAS PubMed; (b) M. Lafrance and K. Fagnou, J. Am. Chem. Soc., 2006, 128, 16496 CrossRef CAS PubMed; (c) H. Li, J. Fan and X. Peng, Chem. Soc. Rev., 2013, 42, 7943 RSC; (d) L. D. Prockop and R. I. Chichkova, J. Neurol. Sci., 2007, 262, 122 CrossRef CAS PubMed.
- (a) X.-F. Wu, H. Neumann and M. Beller, Chem. Soc. Rev., 2011, 40, 4986 RSC; (b) R. Jana, T. P. Pathak and M. S. Sigman, Chem. Rev., 2011, 111, 1417 CrossRef CAS PubMed; (c) E. M. Beccalli, G. Broggini, M. Martinelli and S. Sottocornola, Chem. Rev., 2007, 107, 5318 CrossRef CAS PubMed.
- (a) T. Z. Liu, S. D. Lee and R. S. Bhatnagar, Toxicol. Lett., 1979, 4, 469 CrossRef CAS; (b) J. C. Wataha and C. T. Hanks, J. Oral Rehabil., 1996, 23, 309 CrossRef CAS PubMed.
- C. E. Garrett and K. Prasad, Adv. Synth. Catal., 2004, 346, 889 CrossRef CAS.
- (a) J. Kielhorn, C. Melber, D. Keller and I. Mangelsdorf, Int. J. Hyg. Environ. Health, 2002, 205, 417 CrossRef CAS PubMed; (b) International Programme on Chemical Safety, Palladium; Environmental Health Criteria Series 226, World Health Organization, Geneva, 2002 Search PubMed.
- (a) T. Z. Liu, T. F. Lin, D. T. Y. Chiu, K.-J. Tsai and A. Stern, Free Radical Biol. Med., 1997, 23, 155 CrossRef CAS; (b) M. D. Shultz, J. P. Lassid, M. G. Gooch, B. R. Evans and J. Woodward, Biochem. Biophys. Res. Commun., 1995, 209, 1046 CrossRef CAS PubMed.
- (a) K. van Meel, A. Smekens, M. Behets, P. Kazandjian and R. van Grieken, Anal. Chem., 2007, 79, 6383 CrossRef CAS PubMed; (b) C. Locatelli, D. Melucci and G. Torsi, Anal. Bioanal. Chem., 2005, 382, 1567 CrossRef CAS PubMed.
- X. Chen, T. Pradhan, F. Wang, J. S. Kim and J. Yoon, Chem. Rev., 2011, 112, 1910 CrossRef PubMed.
- (a) S. Cai, Y. Lu, S. He, F. Wei, L. Zhao and X. Zeng, Chem. Commun., 2013, 49, 822 RSC; (b) L. Duan, Y. Xu and X. Qian, Chem. Commun., 2008, 6339 RSC; (c) T. Schwarze, W. Mickler, C. Dosche, R. Flehr, T. Klamroth, H.-G. Lohmannsroben, P. Saalfrank and H.-J. Holdt, Chem.–Eur. J., 2010, 16, 1819 CrossRef CAS PubMed; (d) M. Santra, S.-K. Ko, I. Shin and K. H. Ahn, Chem. Commun., 2010, 46, 3964 RSC; (e) J. R. Matthews, F. Goldoni, H. Kooijman, A. L. Spek, A. P. H. J. Schenning and E. W. Meijer, Macromol. Rapid Commun., 2007, 28, 1809 CrossRef CAS.
- (a) M. Wang, Y. Yuan, H. Wang and Z. Qin, Analyst, 2016, 141, 832 RSC; (b) B. Liu, W. Chen, D. Liu, T. Wang, C. Pan, D. Liu, L. Wang and R. Bai, Sens. Actuators, B, 2016, 237, 899 CrossRef CAS; (c) W. Liu, J. Jiang, C. Chen, X. Tang, J. Shi, P. Zhang, K. Zhang, Z. Li, W. Dou, L. Yang and W. Liu, Inorg. Chem., 2014, 53, 12590 CrossRef CAS PubMed; (d) M. P. Tracey, D. Pham and K. Koide, Chem. Soc. Rev., 2015, 44, 4769 RSC; (e) I. S. Turan, O. Yilmaz, B. Karatas and E. U. Akkaya, RSC Adv., 2015, 5, 34535 RSC; (f) M. Wang, X. Liu, H. Lu, H. Wang and Z. Qin, ACS Appl. Mater. Interfaces, 2015, 7, 1284 CrossRef CAS PubMed; (g) M. Arca, C. Caltagirone, G. De Filippo, M. Formica, V. Fusi, L. Giorgi, V. Lippolis, L. Prodi, E. Rampazzo, M. A. Scorciapino, M. Sgarzi and N. Zaccheroni, Chem. Commun., 2014, 50, 15259 RSC.
- (a) H. Cui, H. Chen, Y. Pan and W. Lin, Sens. Actuators, B, 2015, 219, 232 CrossRef CAS; (b) H. Li, J. Fan and X. J. Peng, Chem. Soc. Rev., 2013, 42, 7943 RSC; (c) B. Qiao, S. Sun, N. Jiang, S. Zhang and X. Peng, Dalton Trans., 2014, 4626 RSC; (d) H. Li, J. Fan, J. Du, K. Guo, S. Sun and X. Liu, Chem. Commun., 2010, 46, 1079 RSC; (e) B. Liu, H. Wang, T. S. Wang, Y. Bao, F. Du, J. Tian, Q. Li and R. Bai, Chem. Commun., 2012, 48, 2867 RSC; (f) B. Liu, Y. Bao, F. Du, H. Wang, J. Tian and R. Bai, Chem. Commun., 2011, 47, 1731 RSC.
- (a) E. Pershagen, J. Nordholm and K. E. Borbas, J. Am. Chem. Soc., 2012, 134, 9832 CrossRef CAS PubMed; (b) Q. Wu and E. V. Anslyn, J. Am. Chem. Soc., 2004, 126, 14682 CrossRef CAS PubMed; (c) W. Chen, B. D. Wright and Y. Pang, Chem. Commun., 2012, 48, 3824 RSC; (d) R. Balamurugan, C.-C. Chien, K.-M. Wu, Y.-H. Chiu and J.-H. Liu, Analyst, 2013, 138, 1564 RSC; (e) H. Chen, W. Lin and L. Yuan, Org. Biomol. Chem., 2013, 11, 1938 RSC; (f) L. Zhou, Q. Wang, X.-B. Zhang and W. Tan, Anal. Chem., 2015, 87, 4503 CrossRef CAS PubMed; (g) S. Sun, B. Qiao, N. Jiang, J. Wang, S. Zhang and X. Peng, Org. Lett., 2014, 16, 1132 CrossRef CAS PubMed.
- (a) X. Wang, Z. Guo, S. Zhu, H. Tian and W. Zhu, Chem. Commun., 2014, 50, 13525 RSC; (b) A. L. Garner, F. Song and K. Koide, J. Am. Chem. Soc., 2009, 131, 5163 CrossRef CAS PubMed; (c) F. Song, A. L. Garner and K. Koide, J. Am. Chem. Soc., 2007, 129, 12354 CrossRef CAS PubMed; (d) Q. Huang, Y. Zhou, Q. Zhang, E. Wang, Y. Min, H. Qiao, J. Zhang and T. Ma, Sens. Actuators, B, 2015, 208, 22 CrossRef CAS; (e) M. S. Baker and S. T. Phillips, J. Am. Chem. Soc., 2011, 133, 5170 CrossRef CAS PubMed; (f) J. T. Weiss, J. C. Dawson, K. G. Macleod, W. Rybski, C. Fraser, C. Torres-Sanchez, E. E. Patton, M. Bradley, N. O. Carragher and A. Unciti-Broceta, Nat. Commun., 2014, 5, 3277 Search PubMed.
- (a) A. Rajput and R. Mukherjee, Coord. Chem. Rev., 2013, 257, 350 CrossRef CAS; (b) T. C. Harrop and P. K. Mascharak, Acc. Chem. Res., 2004, 37, 253 CrossRef CAS PubMed; (c) P. Kumar and R. Gupta, Dalton Trans., 2016, 18769 RSC.
- (a) D. Bansal and R. Gupta, Dalton Trans., 2016, 502 RSC; (b) D. Bansal, G. Kumar, G. Hundal and R. Gupta, Dalton Trans., 2014, 14865 RSC; (c) P. Kumar, V. Kumar and R. Gupta, RSC Adv., 2015, 5, 97874 RSC.
- R. Rusakowicz and A. C. Testa, J. Phys. Chem., 1968, 72, 2680 CrossRef CAS.
- P. Pringsheim, Florescence and Phosphorescence, Interscience Publishing Co., New York, 1949, p. 333 Search PubMed.
- A. Ganguly, B. K. Paul, S. Ghosh, S. Kar and N. Guchhait, Analyst, 2013, 138, 6532 RSC.
- A. Senthilvelan, I. Ho, K. Chang, G. Lee, Y. Liu and W. Chung, Chem.–Eur. J., 2009, 15, 6152 CrossRef CAS PubMed.
- H. A. Benesi and J. H. Hildebrand, J. Am. Chem. Soc., 1949, 71, 2703 CrossRef CAS.
- (a) Y. Furusho, T. Matsuyama, T. Takata, T. Moriuchi and T. Hirao, Tetrahedron Lett., 2004, 45, 9593 CrossRef CAS; (b) Q.-Q. Wang, R. A. Begum, V. W. Day and K. Bowman-James, Inorg. Chem., 2012, 51, 760 CrossRef CAS PubMed.
- (a) J. Zhang, X. Xu, Y. Yuan, C. Yang and X. Yang, ACS Appl. Mater. Interfaces, 2011, 3, 2928 CrossRef CAS PubMed; (b) Q.-Q. Wang, R. A. Begum, V. W. Day and K. Bowman-James, J. Am. Chem. Soc., 2013, 135, 17193 CrossRef CAS PubMed.
- R. Zhang, M. Gao, S. Bai and B. Liu, J. Mater. Chem. B, 2015, 3, 1590 RSC.
- T. Mosmann, J. Immunol. Methods, 1983, 65, 55 CrossRef CAS PubMed.
- (a) K. Ghosh, S. Kumar, R. Kumar and U. P. Singh, J. Organomet. Chem., 2014, 750, 169 CrossRef CAS; (b) A. N. Dwyer, M. C. Grossel and P. N. Horton, Supramol. Chem., 2004, 16, 405 CrossRef CAS.
- C. Liang, W. Bu, C. Li, G. Men, M. Deng, Y. Jiangyao, H. Sun and S. Jiang, Dalton Trans., 2015, 1827 Search PubMed.
- C.-C. Xu, J.-J. Wu, C.-H. Yao, B.-Y. Yu and J.-H. Liu, Eur. J. Med. Chem., 2016, 123, 763 CrossRef CAS PubMed.
- (a) M. Santra, S.-K. Ko, I. Shin and K. H. Ahn, Chem. Commun., 2010, 46, 3964 RSC; (b) X. Feng, T. Zhang, J.-T. Liu, J.-Y. Miao and B.-X. Zhao, Chem. Commun., 2016, 52, 3131 RSC.
- CrysAlisPro, v. 1.171.33.49b, Oxford Diffraction Ltd., 2009 Search PubMed.
- G. M. Sheldrick, Acta Crystallogr., Sect. A: Found. Crystallogr., 2008, 64, 112 CrossRef CAS PubMed.
- O. V. Dolomanov, A. J. Blake, N. R. Champness and M. Schroder, J. Appl. Crystallogr., 2003, 36, 1283 CrossRef CAS.
- L. J. Farrugia, WinGX, v. 1.70, An Integrated System of Windows Programs for the Solution, Refinement and Analysis of Single- Crystal X-ray Diffraction Data, Department of Chemistry, University of Glasgow, 2003 Search PubMed.
Footnote |
| † Electronic supplementary information (ESI) available: Figures for NMR, FTIR, mass, absorption, and emission spectra, binding constants, detection limit, optical images. CCDC 1455263. For ESI and crystallographic data in CIF or other electronic format see DOI: 10.1039/c6ra27565f |
| This journal is © The Royal Society of Chemistry 2017 |

