 Open Access Article
Creative Commons Attribution 3.0 Unported Licence
Theoretical investigation of CO catalytic oxidation by a Fe–PtSe2 monolayer
Pengbo Lyu ,
Junjie He
 and
Petr Nachtigall
 *
*
Department of Physical and Macromolecular Chemistry, Faculty of Science, Charles University in Prague, 128 43 Prague 2, Czech Republic. E-mail: petr.nachtigall@natur.cuni.cz
First published on 3rd April 2017
Abstract
CO oxidation under mild conditions is investigated computationally for the catalysts based on a single transition metal (Sc–Zn) embedded at the Se vacancy of a PtSe2 monolayer. The iron-embedded Fe–PtSe2 monolayer is identified as the most suitable catalyst among the investigated systems. Both, Langmuir–Hinshelwood (LH) and Eley–Rideal (ER) reaction paths were considered for the CO oxidation by adsorbed O2 molecules and by adsorbed O atoms. The CO oxidation by O atoms bound to Fe–PtSe2 proceeds via the ER mechanism in a single reaction step with a small activation barrier (21 kJ mol−1). Both LH and ER reaction mechanisms can take place for CO oxidation by adsorbed O2 molecules. Whereas the barrier for the rate-determining step of the LH reaction path (72 kJ mol−1) is higher than that for the ER path (53 kJ mol−1), the kinetics analysis shows that both processes have comparable rate constants at 300 K. Langmuir–Hinshelwood mechanism becomes dominant at a lower temperature. Results reported here indicate that the Fe–PtSe2 catalyst can efficiently catalyze CO oxidation under mild conditions.
1. Introduction
An efficient CO oxidation is considered as the most practical process for CO removal, in particular in fuel cells where CO is the catalytic poison.1,2 The practical importance of the CO oxidation has triggered the search for suitable catalysts with high activity. A high catalytic activity of gold nanoparticles (NP) on an oxide support in CO oxidation by molecular oxygen has been reported already in 1987 by Haruta et al.3,4 and this catalyst still serves as a benchmark catalyst for other catalysts tested for CO oxidation. It is generally accepted that CO binds on Au NPs while O2 adsorbs on Au NPs only at temperatures below 170 K and several models were proposed for the O2 activation at higher temperatures.5 A number of other catalysts were tested for the CO oxidation reaction, including Pt-group metals, however, they are an order of magnitude less active than Au NPs.6 This lower activity is assigned to strong interaction of CO with metals that prevents O2 from being adsorbed and activated. A promising way to improve the catalytic activity of Pt-group metals is the reduction of NP size to sub-nano or even to single atoms. It is apparent that in addition to low reaction barriers an efficient CO oxidation catalyst should have sufficiently strong interaction not only with CO but also with O2. Better catalytic performance has been shown for particles with reduced size; a particle size reduction leads to increased number of available surface sites and other advantages such as exposed unsaturated metal centers,7 quantum size effects8 and metal–support interactions.9,10 Sub-nanometer metal clusters have been reported to further improve the catalytic performance.11,12 The single-atom catalysts (SAC),13–15 where the single metal atom anchored on metal surface, metal oxide,16,17 graphene18,19 or ion-exchanged metals in porous materials, represents the catalytically active site, were also considered for CO oxidation under mild conditions. Nanoparticles have lower energy barriers than single crystal metal surfaces; e.g., supported Au nanoparticles exhibit lower energy barriers (35–39 kJ mol−1)20 than stepped Au surfaces.21 A single Au atom on FeOx (ref. 22) also exhibits high activity, similar to that reported for small Au (2–3 nm) nanoparticles while there is a very small Au loading (0.03 wt%) in Au1/FeOx catalyst. These experimental findings agree well with the theoretical investigation that reports barrier of only 0.31 eV (30 kJ mol−1) for single Au atoms supported on graphene.23 Therefore, SACs are considered as suitable catalysts for CO oxidation.Among SACs, catalysts based on the single metal atom embedded in two-dimensional atomically thin materials have drawn significant attention.24 Graphene was considered as a potential support for metal atoms; several graphene-supported transition-metal (TM) atoms were theoretically predicted to show a high catalytic activity, including Au,23 Fe,25 Cu,26 Pt,27 Zn28 and Mo29 atoms with energy barriers ranging from 30 to 58 kJ mol−1. Note that stable structures of single Pt, Co, or In atoms,30 as well as Fe dimers,31 on graphene have been experimentally observed. Other 2D materials, such as the single-layer transition-metal dichalcogenides (TMDs) (MX2, M is group 4–10 transition metal and X = S, Se, Te) were also considered as possible matrixes for single atom metal catalysts. The MoS2 monolayer consists of three atomic layers with S atoms terminating both upper and lower surfaces; consequently, there are no dangling bonds on Mo atoms and material is catalytically inactive.32–34 However, S vacancies on MoS2 surfaces can accommodate various transition metal atoms, thus, the material becomes catalytically active.35,36 The activity of these materials for the CO oxidation catalysis was already investigated theoretically: Fe atoms at the S vacancy on MoS2 (denoted Fe–MoS2) showed activation barrier of 49 kJ mol−135 and Cu4 clusters at the S vacancy were predicted to be even more active (energy barrier of 36 kJ mol−1).36 It is clear that the transition metal (TM) embedded in vacancies of otherwise inactive TMD layered materials are legitimate candidates for efficient catalysis of CO oxidation. A single-crystal monolayer platinum diselenide (PtSe2), a new type of single-layer TMDs, has been recently prepared experimentally using the direct selenization of Pt(111) surface.37 Potential applications in optoelectronics, photocatalysis and for valleytronic devices were proposed. Monolayer PtSe2 consists of three atomic Se–Pt–Se layers similar to MoS2 and it could be also a promising substrate for the single metal atom catalysts. As for the metal embedded MoS2, the S vacancy could be formed by the low energy argon sputtering38 or electron irradiation;39 subsequent metal vapor deposition leads to the metal atom embedding on MoS2 surfaces. The same procedure can be also proposed for the preparation of TM–PtSe2 catalysts. The structure and properties of transition metals-embedded PtSe2 systems are reported herein based on the density functional theory (DFT) investigation. A potential of these materials as a catalyst for CO oxidation is the main target of our investigation. First, the TM embedded PtSe2 (TM = Sc–Zn) materials were computationally screened to select the most promising catalyst for CO oxidation. Second, CO oxidation reactions over the Fe embedded PtSe2 surface were explored, considering both Eley–Rideal (ER) and Langmuir–Hinshelwood (LH) mechanisms.
2. Computational methods
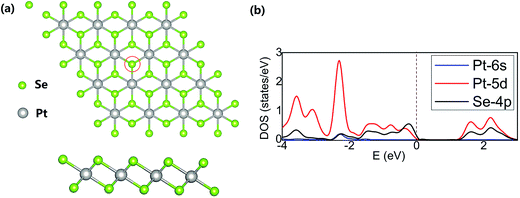
Calculations were performed at the density functional theory (DFT) level with the projected augmented wave (PAW) approximation as implemented in Vienna ab initio simulation package (VASP 5.3.3).40–42 The generalized gradient approximation (GGA) using the Perdew–Burke–Ernzerhof (PBE) exchange–correlation functional and a 500 eV cutoff for the plane-wave basis set were adopted. The Brillouin zone was sampled with the Monkhorst–Pack43 special k-point mesh on 3 × 3 × 1 grid. Geometry optimizations were performed with a convergence threshold of 10−5 eV for a total energy and 0.01 eV Å−1 for the force. All atoms were allowed to relax during the geometry optimizations while the optimized lattice constant was kept fixed. Transition states on the reaction path were located with the climbing image nudged elastic band method (CI-NEB)44 and the dimer algorithm45 as implemented in Transition State Tools for VASP (VTST).46 Vibrational frequencies were calculated for stationary points along the reaction path to identify the character of individual stationary points. Activation barriers of elementary reaction steps were recalculated with the hybrid PBE0 exchange correlation functional.47,48The PtSe2 layer was represented by the 4 × 4 supercell (Fig. 1a) and the interlayer distance of 15 Å was adopted to avoid the artificial interlayer interactions within the periodic model. The structure of the PtSe2 and localized densities of states (LDOS) projected on Pt(5d), Pt(6s) and Se(4p) orbitals are shown in Fig. 1; a position of the Se atom to be replaced by the TM atom is also shown. The calculated lattice constant of PtSe2 monolayer (3.75 Å) is in good agreement with the experimentally observed value (3.7 Å).37
The binding energy of TM atom in the Se vacancy is defined as:
| Eb(TM) = Etot(TM–PtSe2) − E(VSe/PtSe2) − E(TM), | (1) |
| Eads(molecule) = E(molecule/TM–PtSe2) − E(TM–PtSe2) − E(molecule), | (2) |
Rate constants to be used in kinetic analysis were calculated using the following formula:
 | (3) |
3. Results and discussions
3.1. Screening the catalytic potential of TM–PtSe2 (TM = Sc–Zn)
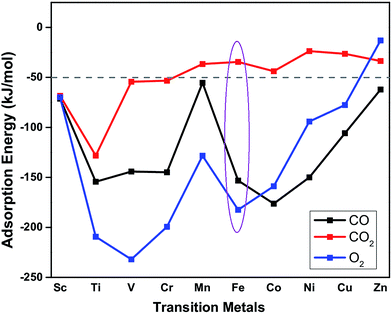
The suitability of TM embedded in PtSe2 monolayer (TM–PtSe2) for the catalytic oxidation of CO under mild conditions was first screened with respect to the criteria stated for the suitable catalytic system previously:50 (i) the total activation energy of CO oxidation should not be higher than about 1 eV (96 kJ mol−1). (ii) A preferential O2 adsorption on the catalyst. (iii) The CO2 adsorption energy should not exceed −50 kJ mol−1. Interaction energies of 3d transition metals with the Se vacancy in PtSe2 and corresponding geometrical parameters are reported in Table 1. The strong interaction (binding energies between −523 and −258 kJ mol−1) was found for TM from Sc to Fe while weaker interaction was found for late TM (Co through Zn). Adsorption energies of CO, O2, and CO2 on the TM–PtSe2 surface (Fig. 2) can be used for an assessment of the catalytic suitability for the CO oxidation under mild conditions. The TM–PtSe2 catalysts based on the late transition metals is not suitable since the CO interaction with the catalyst is stronger than the O2 interaction (criteria (ii) is not met). A strong interaction of CO2 with the catalyst has been found for early transition metals Sc–Cr, thus, corresponding catalysts do not meet criteria (iii). Therefore, two suitable candidates for the CO oxidation under mild conditions are Mn–PtSe2 and Fe–PtSe2. The absolute value of CO adsorption energy on Mn–PtSe2 is rather low compared to a typical energy barrier for CO oxidation (50–67 kJ mol−1),25,51 therefore, CO may desorb before the oxidation takes place. It follows that the Fe–PtSe2 material appears to be the most promising candidate for the catalysis of CO oxidation and it is investigated in detail below.| TM | Sc | Ti | V | Cr | Mn | Fe | Co | Ni | Cu | Zn |
|---|---|---|---|---|---|---|---|---|---|---|
| a Energies in kJ mol−1. Distance between Pt and TM atoms r(TM–Pt) and distance of TM atom from the Se layer (D, negative sign means TM atom is below Se) reported in Å. | ||||||||||
| Eb | −390 | −337 | −310 | −461 | −523 | −258 | −107 | −46 | 9 | −25 |
| r(TM–Pt) | 2.49 | 2.40 | 2.37 | 2.51 | 2.46 | 2.43 | 2.43 | 2.43 | 2.50 | 2.50 |
| D | −0.19 | −0.34 | −0.41 | −0.11 | −0.17 | −0.24 | −0.21 | −0.16 | −0.08 | −0.16 |
3.2. Geometry, electronic structure and stability of Fe–PtSe2
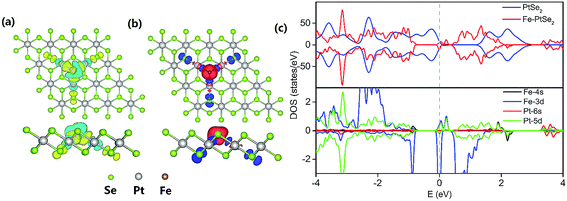
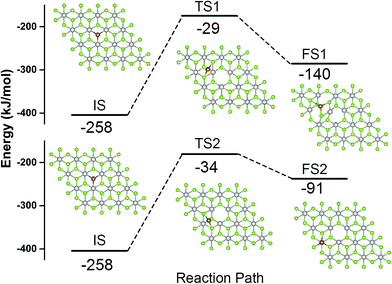
The Fe atom located at the Se vacancy is bonded to 3 Pt atoms with the Fe–Pt bond length of 2.43 Å (Table 1), which is shorter than the Pt–Se bond 2.53 Å. Consequently, Fe is slightly below the Se plane. The Bader charge analysis52 shows electron density of +0.76 |e| on the embedded Fe atom; the charge on Pt atom adjacent to the Se vacancy is 0.16, 0.10, and −0.06 |e| for pristine PtSe2 monolayer, a monolayer with single Se atom vacancy and for PtSe2 monolayer with vacancy occupied by Fe, respectively. The charge density difference between PtSe2 with Se vacancy and Fe–PtSe2 is depicted in Fig. 3a. Spin densities also shown in Fig. 3 are mainly located on the Fe atom (2.889 μB) and the three next-nearest neighbor Se atoms (−0.091 μB for each). The spin-polarized DOS of PtSe2 and Fe–PtSe2 shown in Fig. 3c indicate that conduction and valence bands differ significantly around the Fermi level. The band structure around the Fermi level is mainly attributed to Fe(3d) and Pt(5d) orbitals.The stability of the Fe atom bound at the Se vacancy with respect to Fe adsorbed on the Se surface has been also investigated. The adsorption of Fe atom on the Se surface in the vicinity of the Se vacancy can take place either on the center of the Se–Pt–Se hexagonal ring (Fig. 4, FS1) or on the top of Pt (Fig. 4, FS2). Corresponding adsorption energies (−140 and −91 kJ mol−1, respectively) are both significantly smaller compared to adsorption at the Se vacancy (−258 kJ mol−1). Energy barriers for the Fe atom migration from the Se vacancy to Se–Pt–Se hexagonal and to Pt top sites are 230 and 224 kJ mol−1, respectively. All these results indicate that Fe atoms are preferentially located at the Se vacancies and both thermodynamic and kinetic characteristics are not in favor of a Fe atom migration on the surface and formation of Fe clusters.
3.3. Adsorption of O2 and CO on Fe–PtSe2
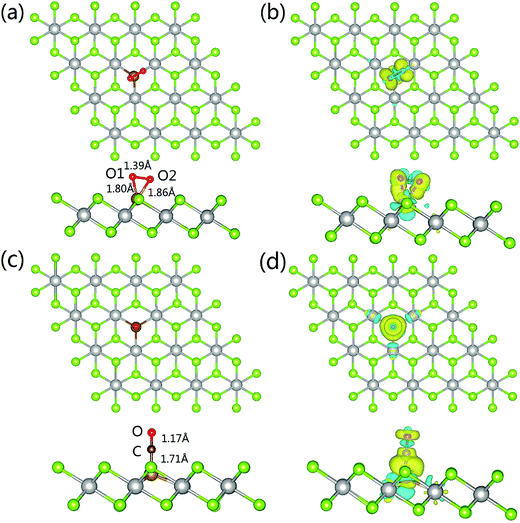
The most energetically favored adsorption complex of O2 on Fe–PtSe2 is a side-on configuration with the adsorption energy −156 kJ mol−1 at the PBE level of theory (Fig. 5a). The dispersion contribution accounts for additional −26 kJ mol−1. The projection of oxygen bond in the basal plane almost coincides with one of the three Fe–Pt bonds, and the distances between Fe–O1 and Fe–O2 are 1.80 Å and 1.86 Å, respectively. The bond length of O1–O2 is elongated from 1.21 Å (gas phase value) to 1.39 Å. The Bader charge analysis shows 0.77 |e| transfer from Fe–PtSe2 to O2. This electron density shift comes mainly from the adsorbent HOMO, localized Fe(3d) orbitals, to LUMO O(2π*) orbitals, explaining the significant elongation of the O–O bond. The charge density differences are shown in Fig. 5b. The adsorption of O2 also partially reduces the magnetic moment of embedded Fe from −2.889 to −2.263 μB. All these results show that O2 can be effectively activated when adsorbed on Fe–PtSe2.As for the adsorption of CO on Fe–PtSe2, the most stable configuration is a C end-on configuration as shown in Fig. 5c. The Fe–C distance is 1.71 Å and the C–O bond length changes from 1.14 Å (the gas phase value) to 1.17 Å, showing just a moderate activation of CO. The charge transfer from the substrate to CO is calculated to be 0.40 |e| and the charge density difference depicted in Fig. 5d shows the charge accumulation on the Fe–C bond. Furthermore, the Bader charge analysis shows only 0.08 |e| transfer to O, while 0.32 |e| transfers to C. The adsorption of CO reduces the magnetic moment of Fe–PtSe2 to 0. The calculated CO adsorption energy is −125 kJ mol−1, and the dispersion corrected value is −153 kJ mol−1. The changes in geometry of the Fe/PtSe2 due to the adsorption of CO and O2 and during the course of the reaction are also shown in Table 4 where Pt–Fe and Se–Fe distances are also reported. Note that adsorption of O2 as well as the structure of some reaction intermediates results in the symmetry lowering; therefore two values for individual Pt–Fe and Se–Fe distances are reported in those cases.
3.4. CO oxidation catalyzed by Fe–PtSe2
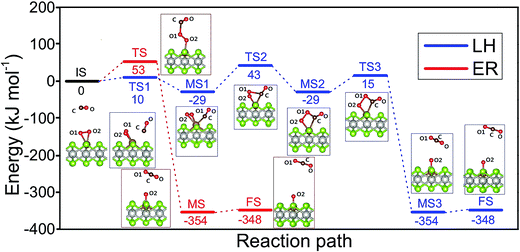
Two well-known mechanisms for CO oxidation, Eley-Rideal (ER) and Langmuir–Hinshelwood (LH) mechanisms25,27 are both investigated. If the adsorbed O2 is attacked by the CO molecule from the gas phase directly (CO does not equilibrate on the surface), the reaction proceeds via ER mechanism. Otherwise, the reaction starts by the co-adsorption of CO and O2 molecules and it is followed by the formation of a peroxo-type intermediate state and completed by desorption of CO2 (LH mechanism). The activation energy barriers were calculated at the PBE0 level (single point energy calculations at structures optimized at the PBE level).As shown above the Fe site of Fe–PtSe2 is preferentially occupied by O2. The weakly interacting adsorption complex of CO on O2/Fe–PtSe2 is taken as the initial structure for both reaction pathways (denoted IS in Fig. 6) and its energy is taken as a reference. The ER mechanism proceeds in a single reaction step (red path in Fig. 6); it starts directly with the formation of TS structure (barrier of 53 kJ mol−1) that leads to the CO2 molecule weakly adsorbed on O/Fe–PtSe2 (structure denoted MS). The reaction is completed by desorption of adsorbed CO2 molecule to the gas phase which is a 6 kJ mol−1 endothermic step (not accounting for dispersion).
The LH mechanism (blue path in Fig. 6) starts with the formation of adsorption complex where both O2 and CO molecules are bound to a single Fe atom (MS1 complex).53 This process proceeds via the transition state TS1 with the energy barrier of 10 kJ mol−1 and it is 29 kJ mol−1 exothermic, indicating that co-adsorption of O2 and CO on single Fe atom can take place. The reaction further proceeds in two elementary steps: a peroxo-type intermediate MS2 (isoenergetic with MS1) is formed via a transition state TS2 with an activation barrier of 72 kJ mol−1; this is a rate-determining step in LH mechanism. The peroxo-type intermediate then decomposes to CO2 weakly bound to the surface and O adatom with the energy barrier of 40 kJ mol−1. Thus formed MS3 structure of CO2 interacting with the O/Fe–PtSe2 site is identical with MS structure found for ER mechanism.
The catalytic cycle is completed by the reaction of O adatom (O/Fe–PtSe2) with another CO molecule (Fig. 7). The energy of weakly interaction CO adsorption complex (IS in Fig. 7) is again taken as reference energy. CO2 is formed in a single exothermic (−237 kJ mol−1) reaction step with the activation barrier of 21 kJ mol−1. Adsorbed CO2 thus formed can readily desorb from the surface. Thus the reaction of CO with O adatom (O/Fe–PtSe2) proceeds via ER mechanism and it has significantly smaller activation barrier than the reaction of CO with adsorbed O2 (O2/Fe–PtSe2). Relevant geometrical parameters are listed in Table 2.
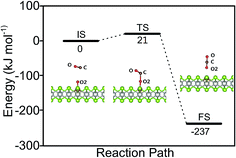 | ||
| Fig. 7 Configurations of IS, TS and FS and energy profile along the MEP for CO reacting with O/Fe–PtSe2. | ||
| Distance | d(O1–O2) | d(C–O1) | d(C–O2) | d(C–Fe) | d(Pt–Fe) | d(Se–Fe) | |
|---|---|---|---|---|---|---|---|
| a All distances reported in Å. | |||||||
| Fe–PtSe2 | — | — | — | — | 2.43 | 3.21 | |
| O2 ads | 1.39 | — | — | — | 2.47, 2.63 | 3.30, 3.43 | |
| CO ads | — | — | — | 1.71 | 2.37 | 3.06 | |
| ER | IS | 1.39 | 3.50 | 3.54 | 5.14 | 2.46, 2.63 | 3.30, 3.43 |
| TS | 1.40 | 1.74 | 2.65 | 4.29 | 2.47 | 3.29 | |
| MS | 3.13 | 1.18 | 2.88 | 4.43 | 2.41 | 3.16 | |
| FS | 5.10 | 1.18 | 4.96 | 6.50 | 2.42 | 3.17 | |
| LH | IS | 1.39 | 3.50 | 3.54 | 5.14 | 2.46, 2.63 | 3.30, 3.43 |
| TS1 | 1.38 | 2.63 | 2.58 | 2.32 | 2.54, 2.75 | 3.40, 3.58 | |
| MS1 | 1.34 | 2.67 | 2.68 | 1.92 | 2.62 | 3.47 | |
| TS2 | 1.43 | 1.82 | 2.43 | 1.98 | 2.50, 2.57 | 3.26, 3.36 | |
| MS2 | 1.51 | 1.35 | 2.17 | 2.05 | 2.48 | 3.28 | |
| TS3 | 1.67 | 1.32 | 2.19 | 2.07 | 2.49, 2.57 | 3.25, 3.37 | |
| MS3 | 3.13 | 1.18 | 2.88 | 4.43 | 2.41 | 3.16 | |
| FS | 5.10 | 1.18 | 4.96 | 6.50 | 2.42 | 3.17 | |
| ER O/Fe–PtSe2 | IS | — | — | 3.08 | 4.66 | 2.42 | 3.17 |
| TS | — | — | 1.71 | 3.39 | 2.44 | 3.23 | |
| FS | — | — | 1.18 | 3.41 | 2.47 | 3.27 | |
Our calculations show that CO oxidation catalyzed by Fe–PtSe2 proceeds via a peroxo-type intermediate (Fig. 6). The CO oxidation over single Fe atom on the graphene has been proposed to go through a carbonate-like intermediate with an energy barrier of 0.57 eV.25 Rather similar observation has been reported for CO oxidation by single Pt atom;19 for a Pt atom on the pristine graphene and for the Pt atom embedded in graphene single-atom vacancy reaction paths via carbonate-like and peroxo-type intermediates were found.27 It is apparent that the CO oxidation mechanism depends on the electronic structure of transition metal atoms that, in turn, depends on the type of metal–support interactions.
Overall reaction rate is thus determined by the reaction of CO with adsorbed O2 molecule described above. While the ER mechanism consists of single reaction step (ΔE≠ = 53 kJ mol−1), the LH mechanism requires three reaction steps characterized with barriers ΔE≠ = 10, 72, and 44 kJ mol−1 for TS1, TS2, and TS3, respectively. To understand which of the mechanisms prevails, the reaction rates were calculated for both ER and LH paths using eqn (3) for rate constants. CO in the gas phase and O2 adsorbed on the Fe sites were taken as reactants for both process.
 | (4) |
 | (5) |
| [CO2]ER = kER·pCO [(O2)ads], | (6) |
 | (7) |
Rate constants calculated using eqn (3) for T = 300 K (Table 3) give ratio kER/kLH = 1.1, leading to the conclusion that both reaction paths are possible for this catalyst. Rate constants ratios calculated for 250 K and 350 K are 0.5 and 1.9, respectively, indicating that LH mechanism will be more favored at lower temperatures.
| Rate constants (s−1) | T = 250 K | T = 300 K | T = 350 K |
|---|---|---|---|
| kER | 1.9 × 101 | 4.3 × 10² | 4.1 × 10³ |
| k−ER | 3.1 × 10−71 | 1.8 × 10−57 | 1.2 × 10−47 |
| k1 | 1.6 × 10⁹ | 1.4 × 10⁹ | 1.3 × 10⁹ |
| k−1 | 5.8 × 10⁵ | 1.5 × 10⁷ | 1.4 × 10⁸ |
| k2 | 1.4 × 10⁻² | 4.2 × 100 | 2.5 × 10² |
| k−2 | 3.9 × 10⁻² | 9.4 × 100 | 4.9 × 10² |
| k3 | 4.6 × 10³ | 2.3 × 10⁵ | 3.8 × 10⁶ |
| k−3 | 7.4 × 10−66 | 4.1 × 10−53 | 5.2 × 10−44 |
| kLH | 4.0 × 101 | 3.9 × 10² | 2.3 × 10³ |
Results reported above show that the catalytic oxidation of CO proceeds readily on Fe–PtSe2 under mild conditions.54 Activation barriers are comparable to those reported in the literature for other SAC systems based on 2D layered materials (Table 4). Results reported in Table 4 are based on DFT calculations employing either local or semi-local exchange–correlation functionals. However, our results show that there is a qualitative difference between the results obtained with semi-local and hybrid functionals: changing the level of theory from PBE to PBE0 results in an increase of the activation barrier for rate determining step along LH path from 45 to 72 kJ mol−1 and in a decrease of activation barrier for ER path from 63 to 53 kJ mol−1. In addition, the analysis of the preferable reaction path based only on activation barriers can be misleading; even if the ER barrier is 20 kJ mol−1 lower than activation barrier on LH path, calculated rate constants are comparable for both reaction paths. The rate constants were reported for some catalysts, e.g., supported Au nanoparticles,55,56 they were not reported for SAC-type catalysts summarized in Table 4. It is therefore difficult to discuss the catalytic activity of particular catalysts reported in Table 4 without knowledge of rate constants. The lowest activation barrier reported so far for mild CO oxidation by SAC 2D systems are 30 and 45 kJ mol−1 found at the PBE level for Au–graphene23 and Au–BN,57 respectively; this is similar as found herein (at the same level of theory) for Fe–PtSe2. Note that activation barriers reported here for the Fe–PtSe2 catalyst are lower than those reported previously for Pt(111).58 The effect of dispersion on the stability of individual reaction intermediates was also investigated (using the D3 dispersion correction scheme). Calculated dispersion corrections are relatively constant for all stationary states on both reaction paths investigated herein, thus, the relative energies of individual intermediates are not affected by dispersion. Relative energies of TS1 and TS3 become about 15 kJ mol−1 with respect to other TS's and reaction intermediates.
| System | Mechanism | ΔE≠ | Methods | Reference |
|---|---|---|---|---|
| a Energies in kJ mol−1. | ||||
| Au–graphene | LH | 30 | PBE + DND | 23 |
| Fe–graphene | ER | 56 | PW91 + DND | 25 |
| Cu–graphene | LH | 52 | PWC + DNP | 26 |
| Fe–MoS2 | LH | 49 | PBE + PAW, 450 eV | 35 |
| CoPc | LH | 63 | PWC + DNP | 50 |
| Au–BN | ER | 45 | PBE + PAW, 400 eV | 57 |
| Co–BN | ER | 50 | PBE + PAW, 400 eV | 59 |
| Fe–PtSe2 | LH | 45 | PBE + PAW, 500 eV | Present work |
| LH | 72 | PBE0 + PAW, 500 eV | Present work | |
| ER | 63 | PBE + PAW, 500 eV | Present work | |
| ER | 53 | PBE0 + PAW, 500 eV | Present work | |
A good catalytic performance of the Fe–PtSe2 catalyst for the CO oxidation can be attributed to highly localized Fe(3d) states around Fermi level60 resulting from the Fe–support interaction (Fig. 3c). A relatively strong interaction of O2 with these Fe(3d) orbitals leads to weakening of the O–O bond and consequently it results in a low activation barrier found for CO oxidation (Fig. 6). It has been shown both experimentally and theoretically that iron oxide clusters can catalyze CO oxidation.61 A good performance of quasicubic α-Fe2O3 nanoparticles in CO oxidation has been reported as well.62 Our results show that the coordinatively unsaturated single Fe atom can efficiently catalyze CO oxidation, similarly as shown previously for other systems.63 The rate limiting step in CO oxidation is the O2 adsorption and activation for various catalysts, e.g., Pt-group metals. Tang et al. have reported that Pt atom located on pristine graphene favors the CO adsorption, however, for the Pt atom embedded in the graphene single vacancy, the adsorption of O2 is favored.27 It has been attributed to the electron density transfer from platinum to graphene and corresponding build-up of positive charge on Pt. Similarly in the case of Fe–PtSe2 catalyst, Fe atom becomes +0.76 |e| positively charged when embedded in Se vacancy. Consequently, the adsorption of O2 is favored over the adsorption of CO.
4. Summary
Transition metal-embedded PtSe2 2D materials were computationally screened to select the most promising catalyst for CO oxidation, considering all 3d transition metals (Sc–Zn). Considering the criteria stated for the suitable catalytic system previously,50 Fe–PtSe2 emerged as the most suitable candidate for CO oxidation. The electronic structure, structural stability and reaction mechanisms were investigated in detail for this catalyst. The Fe atom embedded in the Se vacancy of PtSe2 was found to be sufficiently stable to avoid a metal-cluster formation. The catalytic performance of Fe–PtSe2 was investigated using the PBE functional for structure optimizations and a hybrid PBE0 exchange–correlation functional for single point energy calculations. The reaction paths of CO oxidation by O2 adsorbed on Fe–PtSe2 were investigated for both LH and ER mechanisms. The barrier for rate-determining step of LH reaction path is higher than that for ER path (71 and 53 kJ mol−1, respectively). Nevertheless, the kinetics analysis shows that both processes have comparable rate constants at 300 K. Langmuir–Hinshelwood mechanism becomes dominant at a lower temperature. The CO oxidation by the O atom adsorbed on Fe–PtSe2 proceeds via ER mechanism in a single reaction step with only small activation energy of 21 kJ mol−1. Results reported here indicate that the Fe–PtSe2 catalyst can efficiently catalyze CO oxidation under mild conditions. Therefore, the iron-embedded Fe–PtSe2 system is a potential catalyst for CO oxidation.Acknowledgements
This work was funded by the Czech Science Foundation Grant No. P106/12/G015 (Centre of Excellence) and by OP VVV “Excellent Research Teams”, project No. CZ.02.1.01/0.0/0.0/15_003/0000417 – CUCAM.References
- A. Hornes, A. B. Hungria, P. Bera, A. L. Camara, M. Fernandez-Garcia, A. Martinez-Arias, L. Barrio, M. Estrella, G. Zhou, J. J. Fonseca, J. C. Hanson and J. A. Rodriguez, J. Am. Chem. Soc., 2010, 132, 34–35 CrossRef CAS PubMed.
- S. Royer and D. Duprez, ChemCatChem, 2011, 3, 24–65 CrossRef CAS.
- M. Haruta, T. Kobayashi, H. Sano and N. Yamada, Chem. Lett., 1987, 405–408 CrossRef CAS.
- M. Haruta, N. Yamada, T. Kobayahsi and S. Iijima, J. Catal., 1989, 115, 301–309 CrossRef CAS.
- D. Widmann and R. J. Behm, Acc. Chem. Res., 2014, 47, 740–749 CrossRef CAS PubMed.
- J. Lin, X. Wang and T. Zhang, Chin. J. Catal., 2016, 37, 1805–1813 CrossRef CAS.
- N. Lopez, T. V. W. Janssens, B. S. Clausen, Y. Xu, M. Mavrikakis, T. Bligaard and J. K. Nørskov, J. Catal., 2004, 223, 232–235 CrossRef CAS.
- J. Li, X. Li, H.-J. Zhai and L.-S. Wang, Science, 2003, 299, 864–867 CrossRef CAS PubMed.
- C. T. Campbell, Nat. Chem., 2012, 4, 597–598 CrossRef CAS PubMed.
- H. Tang, J. Wei, F. Liu, B. Qiao, X. Pan, L. Li, J. Liu, J. Wang and T. Zhang, J. Am. Chem. Soc., 2016, 138, 56–59 CrossRef CAS PubMed.
- A. A. Herzing, C. J. Kiely, A. F. Carley, P. Landon and G. J. Hutchings, Science, 2008, 321, 1331–1335 CrossRef CAS PubMed.
- F. Li, H. Shu, C. Hu, Z. Shi, X. Liu, P. Liang and X. Chen, ACS Appl. Mater. Interfaces, 2015, 7, 27405–27413 CAS.
- B. Qiao, A. Wang, X. Yang, L. F. Allard, Z. Jiang, Y. Cui, J. Liu, J. Li and T. Zhang, Nat. Chem., 2011, 3, 634–641 CrossRef CAS PubMed.
- X.-F. Yang, A. Wang, B. Qiao, J. Li, J. Liu and T. Zhang, Acc. Chem. Res., 2013, 46, 1740–1748 CrossRef CAS PubMed.
- J. Liu, ACS Catal., 2017, 7, 34–59 CrossRef CAS.
- J.-X. Liang, X.-F. Yang, A. Wang, T. Zhang and J. Li, Catal. Sci. Technol., 2016, 6, 6886–6892 CAS.
- B. Qiao, J. Liu, Y.-G. Wang, Q. Lin, X. Liu, A. Wang, J. Li, T. Zhang and J. Liu, ACS Catal., 2015, 5, 6249–6254 CrossRef CAS.
- X. Liu, Y. Yang, M. Chu, T. Duan, C. Meng and Y. Han, Catal. Sci. Technol., 2016, 6, 1632 CAS.
- X. Liu, Y. Sui, T. Duan, C. Meng and Y. Han, Catal. Sci. Technol., 2015, 5, 1658–1667 CAS.
- N. Remediakis, N. Lopez and J. K. Nørskov, Angew. Chem., Int. Ed., 2005, 44, 1824–1826 CrossRef PubMed.
- Z. P. Liu, P. Hu and A. Alavi, J. Am. Chem. Soc., 2002, 124, 14770–14779 CrossRef CAS PubMed.
- B. Qiao, J.-X. Liang, A. Wang, C.-Q. Xu, J. Li, T. Zhang and J. Liu, Nano Res., 2015, 8, 2913–2924 CrossRef CAS.
- Y.-H. Lu, M. Zhou, C. Zhang and Y.-P. Feng, J. Phys. Chem. C, 2009, 113, 20156–20160 CAS.
- Z. Lu, P. Lv, Y. Liang, D. Ma, Y. Zhang, W. Zhang, X. Yang and Z. Yang, Phys. Chem. Chem. Phys., 2016, 18, 21865–21870 RSC.
- Y. Li, Z. Zhou, G. Yu, W. Chen and Z. Chen, J. Phys. Chem. C, 2010, 114, 6250–6254 CAS.
- E. H. Song, Z. Wen and Q. Jiang, J. Phys. Chem. C, 2011, 115, 3678–3683 CAS.
- Y. Tang, Z. Yang and X. Dai, Phys. Chem. Chem. Phys., 2012, 14, 16566–16572 RSC.
- Y. Tang, X. Dai, Z. Yang, Z. Liu, L. Pan, D. Ma and Z. Lu, Carbon, 2014, 71, 139–149 CrossRef CAS.
- Y. Tang, L. Pan, W. Chen, C. Li, Z. Shen and X. Dai, Appl. Phys. A, 2015, 119, 475–485 CrossRef CAS.
- H. Wang, Q. Wang, Y. Cheng, K. Li, Y. Yao, Q. Zhang, C. Dong, P. Wang, U. Schwingenschlögl, W. Yang and X. X. Zhang, Nano Lett., 2012, 12, 141–144 CrossRef CAS PubMed.
- Z. He, K. He, A. W. Robertson, A. I. Kirkland, D. Kim, J. Ihm, E. Yoon, G.-D. Lee and J. H. Warner, Nano Lett., 2014, 14, 3766–3772 CrossRef CAS PubMed.
- T. Wang, D. Gao, J. Zhuo, Z. Zhu, P. Papakonstantinou, Y. Li and M. Li, Chem.–Eur. J., 2013, 19, 11939–11948 CrossRef CAS PubMed.
- Z. Chen, J. He, P. Zhou, J. Na and L. Z. Sun, Comput. Mater. Sci., 2015, 110, 102–108 CrossRef CAS.
- Y. Zhou, Q. Su, Z. Wang, H. Deng and X. Zu, Phys. Chem. Chem. Phys., 2013, 15, 18464–18470 RSC.
- D. Ma, Y. Tang, G. Yang, J. Zeng, C. He and Z. Lu, Appl. Surf. Sci., 2015, 328, 71–77 CrossRef CAS.
- Z. W. Chen, J. M. Yan, W. T. Zheng and Q. Jiang, Sci. Rep., 2015, 5, 11230 CrossRef CAS PubMed.
- Y. Wang, L. Li, W. Yao, S. Song, J. T. Sun, J. Pan, X. Ren, C. Li, E. Okunishi, Y.-Q. Wang, E. Wang, Y. Shao, Y. Y. Zhang, H. Yang, E. F. Schwier, H. Iwasawa, K. Shimada, M. Taniguchi, Z. Cheng, S. Zhou, S. Du, S. J. Pennycook, S. T. Pantelides and H.-J. Gao, Nano Lett., 2015, 15, 4013–4018 CrossRef CAS PubMed.
- Q. Ma, P. M. Odenthal, J. Mann, D. Le, C. S. Wang, Y. Zhu, T. Chen, D. Sun, K. Yamaguchi, T. Tran, M. Wurch, J. L. McKinley, J. Wyrick, K. M. Magnone, T. F. Heinz, T. S. Rahman, R. Kawakami and L. Bartels, J. Phys.: Condens. Matter, 2013, 25, 252201 CrossRef PubMed.
- H.-P. Komsa, J. Kotakoski, S. Kurasch, O. Lehtinen, U. Kaiser and A. V. Krasheninnikov, Phys. Rev. Lett., 2012, 109, 035503 CrossRef PubMed.
- P. E. Blöchl, Phys. Rev. B: Condens. Matter Mater. Phys., 1994, 50, 17953–17979 CrossRef.
- G. Kresse and J. Furthmüller, Comput. Mater. Sci., 1996, 6, 15–50 CrossRef CAS.
- G. Kresse and D. Joubert, Phys. Rev. B: Condens. Matter Mater. Phys., 1999, 59, 1758–1775 CrossRef CAS.
- H. J. Monkhorst and J. D. Pack, Phys. Rev. B: Solid State, 1976, 13, 5188–5192 CrossRef.
- G. Henkelman, B. P. Uberuaga and H. Jónsson, J. Chem. Phys., 2000, 113, 9901–9904 CrossRef CAS.
- J. Kästner and P. Sherwood, J. Chem. Phys., 2008, 128, 014106 CrossRef PubMed.
- G. Henkelman, “Vasp TST tools”, can be found in http://theory.cm.utexas.edu/vtsttools/ Search PubMed.
- J. Perdew, M. Ernzerhof and K. Burke, J. Chem. Phys., 1996, 105, 9982 CrossRef CAS.
- C. Adamo and V. Barone, J. Chem. Phys., 1999, 110, 6158 CrossRef CAS.
- S. Grimme, J. Antony, S. Ehrlich and H. Krieg, J. Chem. Phys., 2010, 132, 154104 CrossRef PubMed.
- Q. Deng, L. Zhao, X. Gao, M. Zhang, Y. Luo and Y. Zhao, Small, 2013, 9, 3506–3513 CrossRef CAS PubMed.
- F. Li, J. Zhao and Z. Chen, J. Phys. Chem. C, 2012, 116, 2507 CAS.
- G. Henkelman, A. Arnaldsson and H. Jónsson, Comput. Mater. Sci., 2006, 36, 354–360 CrossRef.
- C. Schiwek, J. Meiners, M. Förster, C. Würtele, M. Diefenbach, M. C. Holthausen and S. Schneider, Angew. Chem., 2015, 127, 15486–15490 CrossRef.
- K. H. Warnick, B. Wang, D. E. Cliffel, D. W. Wright, R. F. Haglund and S. T. Pantelides, Nano Lett., 2013, 13, 798–802 CrossRef CAS PubMed.
- Y. Kim, H. M. Lee and G. Henkelman, J. Am. Chem. Soc., 2012, 134, 1560–1570 CrossRef PubMed.
- S. Kwon, K. Shin, K. Bang, H. Y. Kim and H. M. Lee, Phys. Chem. Chem. Phys., 2016, 18, 13232–13238 RSC.
- P. Zhao, Y. Su, Y. Zhang, S. J. Li and G. Chen, Chem. Phys. Lett., 2011, 515, 159–162 CrossRef CAS.
- C. Dupont, Y. Jugnet and D. Loffreda, J. Am. Chem. Soc., 2006, 128, 9129–9136 CrossRef CAS PubMed.
- S. Lin, X. Ye, R. S. Johnson and H. Guo, J. Phys. Chem. C, 2013, 117, 17319–17326 CAS.
- B. Hammer and J. K. Norskov, in Advances in Catalysis, Academic Press Inc, San Diego, 2000, pp. 71–129 Search PubMed.
- W. Xue, Z. C. Wang, S. G. He, Y. Xie and E. R. Bernstein, J. Am. Chem. Soc., 2008, 130, 15879 CrossRef CAS PubMed.
- Y. Zheng, T. Cheng, Y. Wang, F. Bao, L. Zhou, X. Wei, Y. Zhang and Q. Zheng, J. Phys. Chem. B, 2006, 110, 3093–3097 CrossRef CAS PubMed.
- D. Deng, X. Chen, L. Yu, X. Wu, Q. Liu, Y. Liu and X. Bao, et al., Sci. Adv., 2015, 1, e1500462 Search PubMed.
| This journal is © The Royal Society of Chemistry 2017 |

