
 Open Access Article
 This Open Access Article is licensed under a
 Creative Commons Attribution 3.0 Unported Licence
An investigation of chitosan and its derivatives on red blood cell agglutination†
Xuan Zhou,
Xinshuo Zhang,
Jianjun Zhou * and
Lin Li*
* and
Lin Li*
Beijing Key Laboratory of Energy Conversion and Storage Materials, College of Chemistry, Beijing Normal University, Beijing 100875, China. E-mail: pla_zjj@bnu.edu.cn
First published on 21st February 2017
Abstract
6-Deoxy-6-(2-aminoethyl) amino chitosan (CS-AEA) and aminoethyl modified CS-AEA (CS-AEA-AEM) were synthesized and characterized using FTIR, NMR and elemental analysis. The results showed that the expected CS derivatives were obtained, and the amine group content increased successively in CS, CS-AEA and CS-AEA-AEM. The red blood cell (RBC) agglutination behaviors in solutions of CS and its derivatives were studied using optical microscopy (OM) and ultraviolet-visible (UV-Vis) spectrophotometry. The results demonstrated that the agglutination of RBCs became more evident upon decreasing the pH value and increasing the concentration. Although CS-AEA-AEM had the highest content of amine groups, CS-AEA exhibited the best agglutination performance under the pH and concentration range studied. Potentiometric titration and ionization degree calculations showed that the agglutination behavior of RBCs was determined by the number of protonated amines in CS or its derivatives. Hemocompatibility tests showed that the hemolysis of CS derivatives increased after modification, and the CS derivatives could be classified as a slightly hemolytic material. We have sucessfully developed a CS derivative (CS-AEA) with very good RBC agglutination performance under neutral conditions.
1 Introduction
Chitosan (CS) is a linear polymer derived from the N-deacetylation of chitin extracted from crustacean shells. It is composed of β-(1-4)-linked D-glucosamine and N-acetyl-D-glucosamine units. CS is a semi-crystalline polysaccharide and normally does not dissolve in aqueous solutions above pH 7.0. However, in dilute acids, the free amino groups in the D-glucosamine repeating unit can be protonated. Then, this polysaccharide becomes a polyelectrolyte, and solubilization occurs due to electrostatic repulsion.1,2 As a type of natural biopolymer, CS has been widely utilized in areas including drug delivery, tissue engineering, cosmetics and food industries3–9 due to its superior biocompatibility, biodegradability, low toxicity, and antimicrobial activity.10–17It is widely reported that CS is an effective hemostatic agent because of its unique properties, which can accelerate wound healing in several clinical cases.18–20 Whole blood rapidly forms a coagulum once treated with a CS acetic acid solution.21,22 The hemostatic properties of CS in solution are possibly due to its interaction with RBCs, which are linked together to establish a cellular clot or hemostatic plug.23,24 In addition to a chitosan solution, several chitosan-based dressings have been produced such as films,25,26 porous sponges27,28 and lyophilized bandages.29–31 As the main component of these dressings, chitosan salts can improve the hemostatic efficacy by enriching the RBCs. Other CS devices in the solid state like celox powder have also been used for hemostasis.32,33 It is important to mention that such powder needs to be poured onto haemorrhaging wounds and then covered with pressure dressings when used. No matter what form of CS exists in, the haemostatic mechanism of CS involves the agglutination of RBCs independent of the classical coagulation cascade.34,35 Briefly, glucosamine on CS is positively charged, which attracts the negatively-charged RBCs to agglutinate and therefore, promote clotting.
When glucosamine on CS is positively charged, acidic conditions should be provided. The acidic conditions will irritate the wound when CS is used as hemostatic material. Hence, in this manuscript, we would like to develop a CS derivative with very good RBCs agglutination performance under neutral conditions by synthesizing CS derivatives with different quantities of amino groups. Since the quantity of amino groups on CS is the key factor for its hemostatic properties, the effect of the amino group content on RBCs agglutination was also investigated at the same time.
2 Experimental
2.1 Materials
CS (deacetylation degree 80% and viscosity average molecular weight (![[M with combining macron]](https://www.rsc.org/images/entities/i_char_004d_0304.gif) v) = 904 kDa) was purchased from Nantong Xingcheng Biological Industrial Limited Co., China. Dialysis tubing (Viskase) with a molecular weight cut-off of 3.5 kDa was used to purify the different chitosan derivatives. 2-Aminoethyl chloride hydrochloride with a purity of 98.0% was purchased from J&K Scientific Ltd. Triphenylphosphine with purity higher than 99% was purchased from Aladdin Industrial Corporation. Hydrazine hydrate was obtained at chemical pure reagent grade and other chemicals were analytical grade reagents.
v) = 904 kDa) was purchased from Nantong Xingcheng Biological Industrial Limited Co., China. Dialysis tubing (Viskase) with a molecular weight cut-off of 3.5 kDa was used to purify the different chitosan derivatives. 2-Aminoethyl chloride hydrochloride with a purity of 98.0% was purchased from J&K Scientific Ltd. Triphenylphosphine with purity higher than 99% was purchased from Aladdin Industrial Corporation. Hydrazine hydrate was obtained at chemical pure reagent grade and other chemicals were analytical grade reagents.
Rabbit whole blood anticoagulated with 3.8% (w/v) sodium citrate was obtained from Guangzhou Ruite Biotechnology Co., LTD.
Phosphate buffered saline (PBS) at pH 7.4 was prepared with NaCl, 0.2 M disodium hydrogen phosphate and 0.2 M sodium dihydrogen phosphate in a 250 mL volumetric flask. The volume ratio of 0.2 M disodium hydrogen phosphate and 0.2 M sodium dihydrogen phosphate was 81![[thin space (1/6-em)]](https://www.rsc.org/images/entities/char_2009.gif) :19. The concentration of NaCl and sodium phosphate was 0.125 M and 0.01 M, respectively. For PBS at pH 8.4, the volume ratio of 0.2 M disodium hydrogen phosphate and 0.2 M sodium dihydrogen phosphate was 49:1.
:19. The concentration of NaCl and sodium phosphate was 0.125 M and 0.01 M, respectively. For PBS at pH 8.4, the volume ratio of 0.2 M disodium hydrogen phosphate and 0.2 M sodium dihydrogen phosphate was 49:1.
2.2 Synthesis
The target compounds were synthesized according to Scheme 1.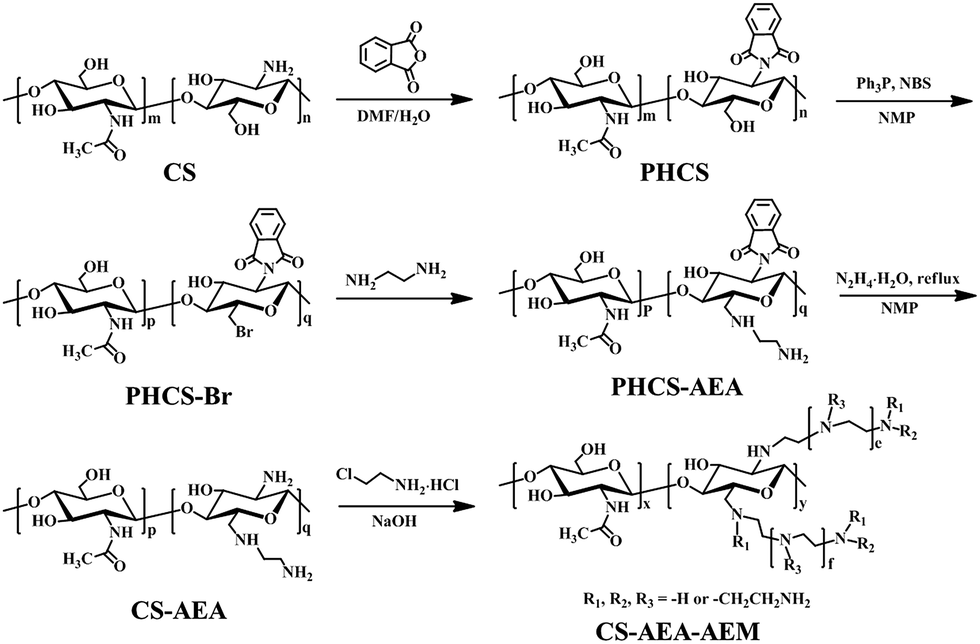 | ||
| Scheme 1 The procedures used to synthesize CS-AEA and CS-AEA-AEM. | ||
v = 222 kDa).v = 163 kDa).2.3 Characterization
The composition variation of CS and its derivatives during synthesis were confirmed using FTIR (Nicolet AVATAR 360), 1H NMR and 13C NMR (Bruker AVANCE III, 500 MHz) spectroscopy and elemental analysis (Vario EL). Samples for FTIR were prepared as potassium bromide disks after being dried under a lamp for 30 min. NMR samples were dissolved in 1% DCl/D2O (v/v) or DMSO and the chemical shifts reported in ppm.CS and its derivatives were titrated according to some previous reports.37–39 Separately, samples (50 mg) were dissolved in 25 mL HCl solution (0.100 N) and purged by bubbling with N2 for 10 min. During titration, nitrogen atmosphere was maintained over the sample, which was thermostated at 24 °C. Under continuous stirring, a 0.100 N NaOH solution was added dropwise and the pH values were recorded every 5 min using a Mettler Toledo FE20 Precision pH/mV meter.
2.4 Hemostatic performance
CS and its derivatives in solutions of various concentration were obtained by dissolving in 1% (v/v) aqueous acetic acid. To evaluate the agglutination of RBCs in solutions of CS and its derivatives, a suspension of RBCs was first prepared. Anticoagulated rabbit blood was centrifuged at 400g for 10 min, and the supernatant was carefully removed and discarded. RBCs were washed three times with PBS (pH 7.4) at 4 °C and finally re-suspended in PBS to obtain an RBCs suspension at 5% (v/v) hematocrit.To evaluate the RBCs agglutination behavior, in vitro studies were performed by incubating the RBCs in CS and its derivatives solution at 37 °C for 30 min. Three pH values (7.4, 7.0, 6.4) were adjusted by saline and PBS (pH 8.4) and the specific composition of the sample solution is shown in Table 1. At the end of the incubation, 20 μL of the solution was sampled and observed using optical microscopy (OM) (Olympus BX53) in phase-contrast mode and UV-Vis spectra (PerkinElmer Lambda 750) with absorbance at 540 nm.
| Sample | pH 8.4 PBS (mL) | Saline (mL) | Acetic acid 1% (μL) | Ba (μL) | RBCs (μL) |
|---|---|---|---|---|---|
| a B: B1, B2 and B3 are solutions of CS, CS-AEA and CS-AEA-AEM, respectively. CS and its derivatives in solution at various concentrations (0.5, 0.8, 1.0, 2.0, 3.0, 4.0 and 5.0 mg mL−1) have been prepared. | |||||
| Control-1 | 2.9 | — | 50 | — | 50 |
| B1 (7.4) | 2.9 | — | — | 50 | 50 |
| B2 (7.4) | 2.9 | — | — | 50 | 50 |
| B3 (7.4) | 2.9 | — | — | 50 | 50 |
| Control-2 | 1.9 | 1 | 50 | — | 50 |
| B1 (7.0) | 1.9 | 1 | — | 50 | 50 |
| B2 (7.0) | 1.9 | 1 | — | 50 | 50 |
| B3 (7.0) | 1.9 | 1 | — | 50 | 50 |
| Control-3 | 0.9 | 2 | 50 | — | 50 |
| B1 (6.4) | 0.9 | 2 | — | 50 | 50 |
| B2 (6.4) | 0.9 | 2 | — | 50 | 50 |
| B3 (6.4) | 0.9 | 2 | — | 50 | 50 |
2.5 Hemolysis
The hemolysis of CS, CS-AEA, and CS-AEA-AEM was estimated by measuring the haemoglobin released from the RBCs. Samples were prepared according to Table 1 and incubated at 37 °C for 3 h. Then, the mixtures were centrifuged at 1000g for 5 min. The absorbance of the supernatant was determined at 540 nm using a UV-Vis spectrophotometer. Distilled water and saline were used as the positive control and negative control, respectively. The hemolysis was calculated using the following equation:| Hemolysis (%) = (Ds − Dn)/(DP − Dn) × 100 |
3 Results and discussion
3.1 Synthesis and characterization of chitosan derivatives
During the synthesis, the composition was monitored using FTIR spectroscopy. The FTIR spectra of CS, PHCS, CS-AEA and CS-AEA-AEM are shown in Fig. 1. CS showed a broad absorption band in the range of 3200–3500 cm−1, corresponding to –OH and –NH stretching vibrations; the bands at about 1659 cm−1 and 1592 cm−1 correspond to the C![[double bond, length as m-dash]](https://www.rsc.org/images/entities/char_e001.gif) O stretching vibrations of the acetyl group (amine I) and N–H bending vibrations (amine II) of the residual N-acetyl groups, respectively. The skeletal vibration of pyranose in CS (C–O–H) was located at 1156, 1074, 1030 and 991 cm−1.40,41 After phthaloylation of CS, the FTIR spectrum of PHCS showed two bands at 1778 and 1712 cm−1, corresponding to the CO of the imide, which are the characteristic absorption bands of phthaloyl groups.42,43 A strong absorption band at 720 cm−1 was also found, which was responsible for the C–H bending vibration of phenyl ring. These characteristic bands indicated the successful introduction of the phthaloyl group onto CS. CS-AEA showed an intensified band at around 1641 cm−1, which can be assigned to the transmutation vibration of –NH2.44 The appearance of the band at 1641 cm−1 indicated that large quantities of –NH2 groups had been grafted onto CS. In addition, the disappearance of the characteristic peaks of the phthaloyl group and phenyl ring showed that the N-phthaloyl groups had been removed during the deprotection reaction. Evidence from the FTIR spectra indicated that ethylenediamine had been successfully grafted onto CS to form CS-AEA.
O stretching vibrations of the acetyl group (amine I) and N–H bending vibrations (amine II) of the residual N-acetyl groups, respectively. The skeletal vibration of pyranose in CS (C–O–H) was located at 1156, 1074, 1030 and 991 cm−1.40,41 After phthaloylation of CS, the FTIR spectrum of PHCS showed two bands at 1778 and 1712 cm−1, corresponding to the CO of the imide, which are the characteristic absorption bands of phthaloyl groups.42,43 A strong absorption band at 720 cm−1 was also found, which was responsible for the C–H bending vibration of phenyl ring. These characteristic bands indicated the successful introduction of the phthaloyl group onto CS. CS-AEA showed an intensified band at around 1641 cm−1, which can be assigned to the transmutation vibration of –NH2.44 The appearance of the band at 1641 cm−1 indicated that large quantities of –NH2 groups had been grafted onto CS. In addition, the disappearance of the characteristic peaks of the phthaloyl group and phenyl ring showed that the N-phthaloyl groups had been removed during the deprotection reaction. Evidence from the FTIR spectra indicated that ethylenediamine had been successfully grafted onto CS to form CS-AEA.
 | ||
| Fig. 1 The FTIR spectra of (a) CS, (b) PHCS, (c) CS-AEA and (d) CS-AEA-AEM. | ||
For CS-AEA-AEM, in addition to the transmutation vibration band of –NH2 (1602 cm−1) and bending vibration band of –NH– (1503 cm−1), the scissor vibration band (1464 cm−1) and swing vibration (1409 cm−1) of –CH2 on –CH2–N– were also observed.44,45 Given the complex structure of the CS derivatives and the overlapping of the characteristic bands observed in the FTIR spectra, the structure was further analyzed using NMR spectroscopy.
The 1H NMR spectra of CS, PHCS, CS-AEA and CS-AEA-AEM are shown in Fig. 2. For CS, the peak at 4.76 ppm was assigned to H1, and the multiplets at 3.48–3.92 ppm were due to H2′, H3, H4, H5 and H6 of CS. The Ha peak corresponds to the three protons of the acetyl group. For PHCS, the characteristic chemical shift peaks derived from CS in PHCS increased due to the introduction of the N-phthaloyl groups, which are the electron withdrawing groups. The peaks at 7.3–8.1 ppm are due to proton signals of the aromatic phthalimido groups, which disappear from CS-AEA after de-protection. In the 1H NMR spectrum of CS-AEA, the peaks at 3.50 and 3.47 ppm were due to the proton signals of –CH2–NH–, while the peak at 3.36 ppm was due to the proton signal of –CH2–NH2. The signal at H2 was covered by the signal of the –CH2–NH2 groups. Given the similar local chemical environment in the 1H NMR spectrum of CS-AEA-AEM, the signals for the protons in the aminoethyl group and pyranoid ring were overlapped and appeared at 2.70–4.32 ppm. The peak at 3.46 ppm was identified as the signal of –CH2–NH–. The peak at 3.38 ppm was assigned to the proton signals of –CH2–NH2. The peak at 3.30 ppm was due to the signal of –CH2– connected with tertiary amines.
 | ||
| Fig. 2 The 1H NMR spectra of CS, PHCS, CS-AEA and CS-AEA-AEM in 1% (v/v) DCl/D2O and PHCS in DMSO at 25 °C. | ||
The 13C NMR spectra of CS, CS-AEA and CS-AEA-AEM are shown in Fig. S1 (ESI†). CS exhibits signals at 97.34, 76.27, 74.68, 69.91, 59.97 and 55.75 ppm, which were assigned to C-1, C-4, C-5, C-3, C-6, and C-2 in the pyranoid ring, respectively. The peaks at 176.58 and 20.41 ppm were assigned to C-7 and C-8 in the acetyl group, respectively. For CS-AEA, the peaks at 35.41 and 36.39 ppm correspond to –CH2–NH2, while the peaks at 44.94 and 48.21 ppm can be ascribed to the signals of –CH2–NH– marked in the corresponding structural formula. Different from CS-AEA, the peaks at 47.62–51.94 ppm show the existence of different –CH2– connected with the amines in the 13C NMR spectrum of CS-AEA-AEM.
The elemental composition of CS and its derivatives were obtained using an organic element analyzer and the results are shown in Table 2. The N/C ratio can be used as an indication of the amine group content in the polymers and was 17.69%, 34.31% and 38.60% in CS, CS-AEA and CS-AEA-AEM, respectively. It was clear that the amine group content increased successively, as expected.
| Name | N (%) | C (%) | H (%) | N/C (%) |
|---|---|---|---|---|
| CS | 7.49 | 42.34 | 7.18 | 17.69 |
| CS-AEA | 15.59 | 45.44 | 8.48 | 34.31 |
| CS-AEA-AEM | 13.41 | 34.74 | 7.88 | 38.60 |
3.2 OM study of RBCs agglutination
The interactions between RBCs and CS and its derivatives were evaluated using OM. To eliminate the effect of pH on RBCs agglutination, control samples without CS and its derivatives were prepared and no agglutination behavior was observed (Fig. S2, ESI†). In the control samples, RBCs did not agglutinate even after prolonged incubation. Therefore, without CS or its derivatives in the solution, changing the pH should have no influence on the agglutination of RBCs.The agglutination behavior of RBCs in CS, CS-AEA and CS-AEA-AEM solution at various pH values is shown in Fig. 3. At pH 7.4, no agglutination of RBCs was found in the CS solution (Fig. 3a), while evident agglutination of RBCs was observed in the CS-AEA and CS-AEA-AEM solutions (Fig. 3b and c). At pH 7.0, RBCs began to agglutinate in the CS solution, and a small amount of agglutination with three to five RBCs together was found (Fig. 3d). A larger RBCs cluster was found in the CS-AEA solution (Fig. 3e), while no significant improvement in RBCs agglutination was found in the CS-AEA-AEM solution (Fig. 3f). At pH 6.4, RBCs agglutination became more evident (Fig. 3g–i). Clusters were found in the CS solution, and very large agglutination clusters were formed in the CS-AEA solution. It could be found that for CS and its derivatives, the agglutination degree of RBCs increased with a decrease in the pH value.
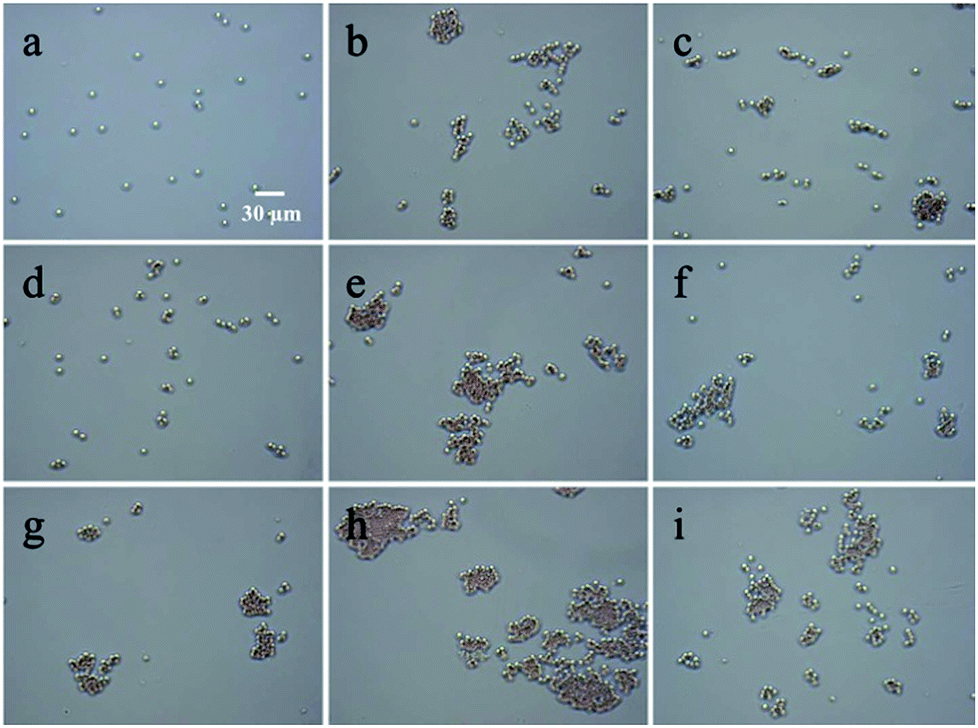 | ||
| Fig. 3 OM images of RBCs agglutination in solutions of CS and its derivatives at a concentration of 4 mg mL−1. At pH 7.4: (a) CS, (b) CS-AEA and (c) CS-AEA-AEM. At pH 7.0: (d) CS, (e) CS-AEA and (f) CS-AEA-AEM. At pH 6.4: (g) CS, (h) CS-AEA and (i) CS-AEA-AEM. | ||
The effect of concentration on RBCs agglutination was further investigated. As shown in Fig. 4, the agglutination of RBCs became evident as the concentration of CS and its derivatives was increased at pH 6.4. In the CS solution, when the concentration was 0.8 mg mL−1, RBCs were randomly dispersed in the solution and no agglutination was observed (Fig. 4a). As the concentration increased to 2.0 mg mL−1, loose agglutination was found occasionally (Fig. 4d). When the concentration was further increased to 5.0 mg mL−1, a large cluster of RBCs agglutination was observed (Fig. 4g). In the CS-AEA solution, agglutination was found even at 0.8 mg mL−1 (Fig. 4b). As the concentration increased, agglutination became more evident (Fig. 4e), and tight large clusters of RBCs were found as the concentration reached 5.0 mg mL−1 (Fig. 4h). In the CS-AEA-AEM solution, agglutination was also found at 0.8 mg mL−1 (Fig. 4c). An increase in the degree of agglutination was also found upon increasing the CS-AEA-AEM concentration (Fig. 4f and i). Similar phenomena can also be observed at pH = 7.0 and pH = 7.4 (Fig. S3 and S4, ESI†).
 | ||
| Fig. 4 OM images of RBCs agglutination in solutions of CS and its derivatives at pH 6.4. At 0.8 mg mL−1: (a) CS, (b) CS-AEA and (c) CS-AEA-AEM. At 2.0 mg mL−1: (d) CS, (e) CS-AEA and (f) CS-AEA-AEM. At 5.0 mg mL−1: (g) CS, (h) CS-AEA and (i) CS-AEA-AEM. | ||
The microscopy results indicated that CS and its derivatives can promote RBCs agglutination, which was affected by both the pH and concentration. A lower pH value and higher concentration of CS or its derivatives can enhance the RBCs agglutination behavior. When compared with CS and CS-AEA-AEM, CS-AEA showed the best performance of promoting RBCs agglutination.
3.3 Spectrophotometric study of RBCs agglutination
The effect of CS and its derivatives on RBCs agglutination was further quantitatively studied using a spectrophotometric method, which measured the decrease in absorbance at 540 nm due to RBCs agglutination.46 The results are shown in Fig. 5. The samples with no CS or its derivatives added were the control samples. It could be found that the control samples showed the maximum absorbance over all the pH values studied, which corresponds to no agglutination of RBCs in the solution. At pH = 7.4, the absorbance did not change with the CS concentration, which meant that no or very weak interactions existed between CS and RBCs in an alkalescent solution (Fig. 5a). The absorbance of CS-AEA and CS-AEA-AEM began to decrease as the concentration increased to more than 1 mg mL−1. The absorbance of CS-AEA decreased at a much more rapid rate than that of CS-AEA-AEM at a concentration ranging from 1 mg mL−1 to 5 mg mL−1. The absorbance reached 2.60 and 2.66 at a concentration of 5 mg mL−1 for CS-AEA and CS-AEA-AEM, respectively. The lower absorbance value indicated that more RBCs were agglutinated in the solution. At pH = 7.0, a similar trend was found for CS and its derivatives. The absorbance did not change in the CS solution and decreased in the CS-AEA and CS-AEA-AEM solutions (Fig. 5b). At pH = 6.4, the absorbance of CS and its derivatives showed the same changing trend, which significantly decreased upon increasing the concentration when the concentration was greater than 1 mg mL−1 (Fig. 5c). The absorbance values were 2.50, 2.33 and 2.47 for CS, CS-AEA and CS-AEA-AEM at a concentration of 5 mg mL−1, respectively. The evident decrease in absorbance at pH 6.4 indicated that CS can promote RBCs agglutination under acidic conditions and CS's ability to promote RBCs agglutination was almost the same as CS-AEA-AEM. For the same polymer, the absorbance decreased with pH. For example, the absorbance of CS-AEA was 2.60, 2.48 and 2.33 at pH 7.4, 7.0 and 6.4, respectively. The decrease in absorbance indicated that the degree of agglutination increased as the pH value decreased. At the three pH values studied, the absorbance of CS-AEA was always the smallest at the same concentration, which means that CS-AEA had the best capability of promoting RBCs agglutination irrespective of the pH value. The spectrophotometric results were in good agreement with the OM observations. Although the content of amine group increased in CS-AEA-AEM, the capability of promoting RBCs agglutination did not increase as expected. To investigate how the amine groups affect RBCs agglutination, a potentiometric titration was carried out and the degree of ionization for the amine groups in CS and its derivatives was also calculated.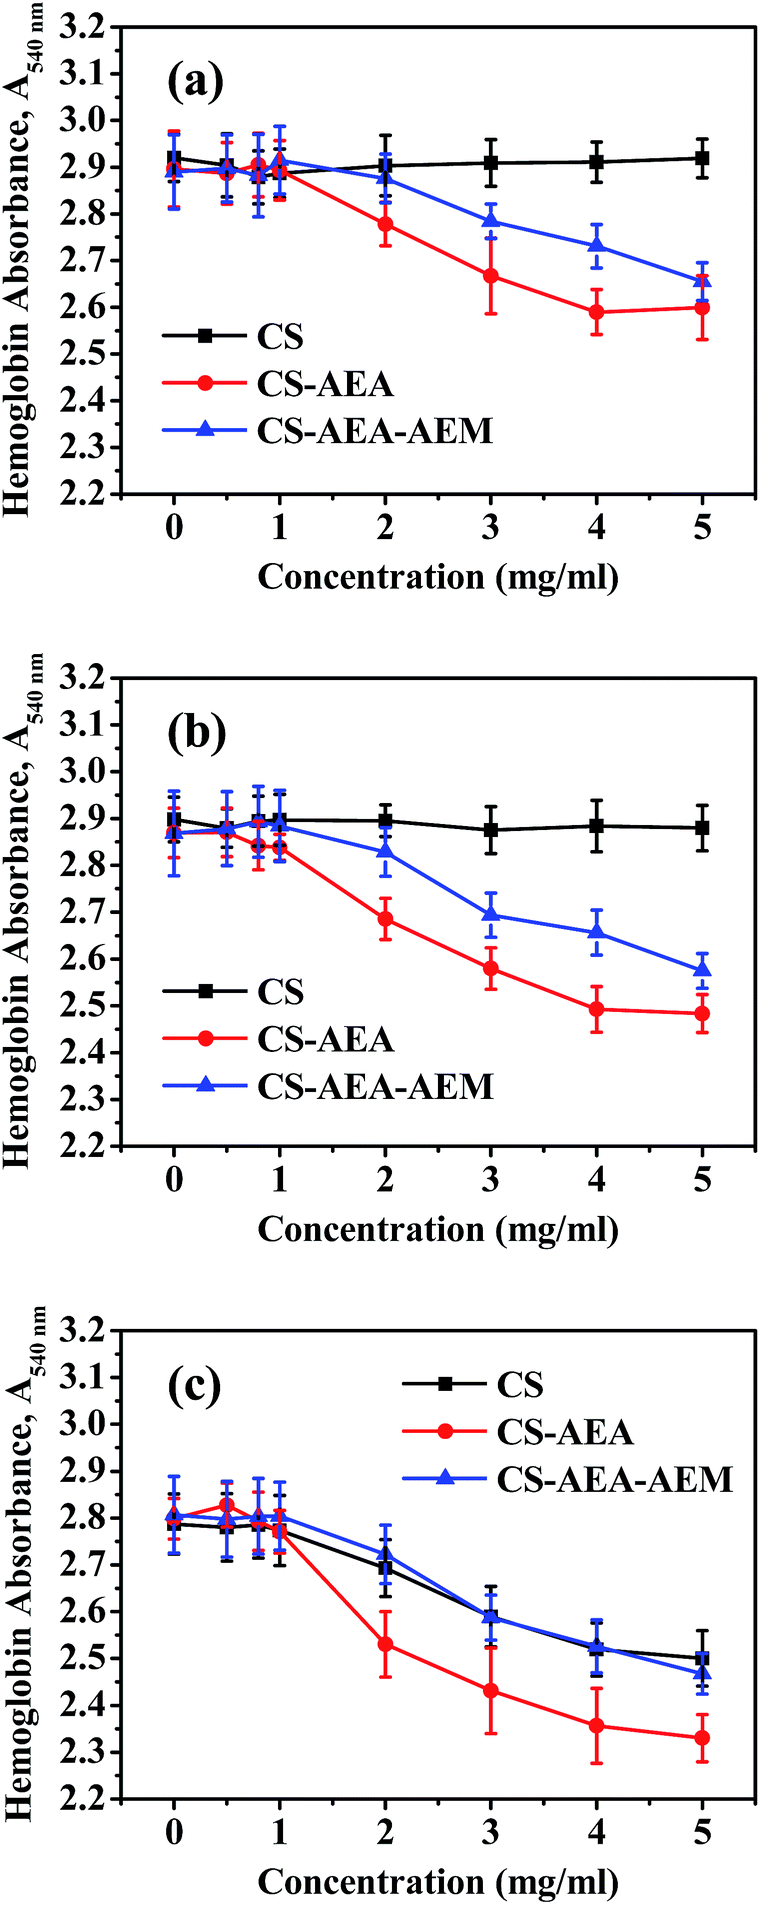 | ||
| Fig. 5 Spectrophotometric measurements of the aggregation of RBCs with CS, CS-AEA and CS-AEA-AEM at a specific pH: (a) pH = 7.4, (b) pH = 7.0 and (c) pH = 6.4. | ||
3.4 Potentiometric titration and the degree of ionization
Since different amines exhibit different basicity, a potentiometric titration was used to discriminate different types of amines in CS, CS-AEA and CS-AEA-AEM. The first order derivative curves of pH/V are shown in Fig. 6a. The first inflection point in the curve corresponds to the neutralization of the excessive HCl. CS showed two inflection points at pH 4.19 and 9.26 (VNaOH = 22.75 and 25.10 mL, respectively). The second inflection point at pH 9.26 originates from –NH2·HCl– neutralized by NaOH. CS-AEA showed three inflection points at pH 3.66, 7.69 and 10.25 (VNaOH = 21.90, 24.90 and 26.40 mL, respectively). The inflection points at pH 7.69 and 10.25 originated from –NH2·HCl– and –NH·HCl– neutralized by NaOH.47 CS-AEA-AEM also showed three main inflection points at pH 4.02, 7.48 and 10.41 (VNaOH = 24.05, 26.80 and 29.50 mL, respectively). In addition, the inflection points at pH 7.48 and 10.41 originated from –NH2·HCl– and –NH·HCl– neutralized by NaOH. The consumption volumes of NaOH for –NH2·HCl– and –NH·HCl– were 3.0 mL and 1.5 mL for CS-AEA and 2.75 mL and 2.70 mL for CS-AEA-AEM, respectively. From the potentiometric titration results, it could be calculated that the ratios of primary to secondary amine in CS-AEA and CS-AEA-AEM were around 2.00 and 1.02, respectively. The results indicated that ethylenediamine had been successfully grafted onto CS to obtain CS-AEA. Since the ratios of primary to secondary amine decreased from 2.00 in CS-AEA to 1.02 in CS-AEA-AEM, the increased amine groups in CS-AEA-AEM should be secondary amines. | ||
| Fig. 6 Potentiometric titration of solutions of CS and its derivatives using NaOH. (a) ΔpH/ΔV vs. VNaOH and (b) pH vs. degree of ionization. | ||
The degree of ionization (α) for the amines on CS and its derivatives was calculated according to the following equation:37,38

The results are shown in Fig. 6b. Under neutral or alkaline conditions, CS-AEA had the highest α, and the α values were in the order: αCS-AEA > αCS-AEA-AEM > αCS. This means that the amine groups on the CS derivatives were more easily protonated than those on CS under neutral or alkaline conditions. Although CS-AEA-AEM had the highest content of amine groups, the ratio of protonated amine groups was not the highest. As the acidity increased, the α value of CS increased very rapidly. When the pH value was lower than 5.8, CS showed the highest α value at the same pH. Our results demonstrate that the α value of the amines could be adjusted by changing the pH. At pH 7.4, the α values were 0.09, 0.33 and 0.49 for CS, CS-AEA-AEM and CS-AEA, respectively. It was found that CS-AEA had the largest α value, while the α value was very small in the CS solution. At pH 7.0, the α values were 0.19, 0.37 and 0.52 for CS, CS-AEA-AEM and CS-AEA, respectively. Although the α value of CS increased significantly, it was still at a very low value. At pH 6.4, the α values were 0.47, 0.44 and 0.60 for CS, CS-AEA-AEM and CS-AEA, respectively. The α value of CS reached 0.47, and a large number of positively charged amine groups could be expected. The agglutination behavior of RBCs was affected by α, which determined the number of protonated amine groups. The different α values in the solutions of CS and its derivatives should exert a diverse influence on RBCs agglutination under various pH conditions. In the CS solution, it was reasonable to observe RBCs agglutination at pH 6.4, while almost no agglutination was found at pH 7.0 and 7.4. At the same concentration, the higher α value led to more protonated amine groups in solution and then, more evident agglutination of RBCs, which was in accordance with our OM and spectrophotometric results.
3.5 Hemolysis
The hemocompatibility of the CS derivatives was evaluated, which is an important initial assessment of the toxic effect of biomaterials. As shown in Fig. 7, the hemolysis of CS, CS-AEA and CS-AEA-AEM increased with the decrease of pH value. They were 0.46%, 4.16% and 3.88%, respectively at pH 6.4. According to the ASTM standard F756, hemoglobin release of 0–2%, 2–5% or >5% of the total release is classified as non-hemolytic, slightly hemolytic or haemolytic, respectively. After modification, the hemolysis of the CS derivatives was in the range of 2–5%, which indicated that the CS derivatives were slightly hemolytic. Our results demonstrate that increasing the cationic amine group in CS increases haemoglobin release. | ||
| Fig. 7 Hemolysis of CS, CS-AEA and CS-AEA-AEM at a concentration of 5 mg mL−1. | ||
4 Conclusions
Two CS derivatives (CS-AEA and CS-AEA-AEM) have been designed and synthesized. FTIR and NMR spectroscopy verified that the expected CS derivatives were obtained. Elemental analysis showed that the amine group content increased successively, as expected. OM and UV-Vis spectrophotometry were used to study the RBCs agglutination behavior in solutions of CS and its derivatives. Similar results were obtained in which the agglutination of RBCs became more significant upon decreasing the pH and increasing the concentration. Although CS-AEA-AEM had the highest content of amine groups, CS-AEA exhibited the best agglutination performance over the pH and concentration range studied. The potentiometric titration results showed that the ratio of primary to secondary amines in CS-AEA and CS-AEA-AEM were around 2.00 and 1.02, respectively, which demonstrated that the increased amine groups were secondary amines. The results from calculating the degree of ionization showed that the degree of protonation of the amines can be adjusted by changing the pH, which increased with a decrease in the pH value. The degree of ionization for the amine groups can explain the RBCs agglutination behavior very well at various pH values. Although the amine group content affected RBCs agglutination, the most important factor was the degree of ionization for the amine groups in the solutions of CS or its derivatives. A higher α value leads to more protonated amine groups in solution and then, more agglutination of RBCs. CS-AEA showed a high α value under the neutral conditions, which means that CS-AEA was a very good hemostatic material without irritation to the wound. The hemocompatibility tests showed that the hemolysis of the CS derivatives increased after modification, and the CS derivatives were slightly hemolytic. Our results will be helpful for developing hemostatic material based on CS.Acknowledgements
This study was financially supported by the National Natural Science Foundation of China (Grant No. 21434003), the National High Technology Research and Development Program of China (863) (Grant No. 2015AA033801), the Fundamental Research Funds for the Central Universities, and the Program for Changjiang Scholars and Innovative Research Team in University and the National Science and Technology Major Project of the Ministry of China (Grant No. 2013ZX09J13110-11B).References
- M. Rinaudo, Polym. Int., 2008, 57, 397–430 CrossRef CAS.
- J. Carneiro, J. Tedim and M. G. S. Ferreira, Prog. Org. Coat., 2015, 89, 348–356 CrossRef CAS.
- M. de la Fuente, M. Ravina, P. Paolicelli, A. Sanchez, B. Seijo and M. J. Alonso, Adv. Drug Delivery Rev., 2010, 62, 100–117 CrossRef CAS PubMed.
- Z. Chen, L. Zhang, Y. Song, J. He, L. Wu, C. Zhao, Y. Xiao, W. Li, B. Cai and H. Cheng, Biomaterials, 2015, 52, 240–250 CrossRef CAS PubMed.
- L. W. Place, M. Sekyi, J. Taussig and M. J. Kipper, Macromol. Biosci., 2016, 16, 371–380 CrossRef CAS PubMed.
- K. T. Shalumon, K. H. Anulekha, K. P. Chennazhi, H. Tamura, S. V. Nair and R. Jayakumar, Int. J. Biol. Macromol., 2011, 48, 571–576 CrossRef CAS PubMed.
- S. M. Lee, K. H. Liu, Y. Y. Liu, Y. P. Chang, C. C. Lin and Y. S. Chen, Materials, 2013, 6, 1391–1402 CrossRef CAS.
- J. Dutta, S. Tripathi and P. K. Dutta, Food Sci. Technol. Int., 2012, 18, 3–34 CrossRef CAS PubMed.
- I. Hamed, F. Özogul and J. M. Regenstein, Trends Food Sci. Technol., 2016, 48, 40–50 CrossRef CAS.
- X. Ma, J. Ge, Y. Li, B. Guo and P. X. Ma, RSC Adv., 2014, 4, 13652–13661 RSC.
- A. Mellati, S. Dai, J. Bi, B. Jin and H. Zhang, RSC Adv., 2014, 4, 63951–63961 RSC.
- Z. K. Wang, Q. L. Hu and Y. X. Wang, Sci. China: Chem., 2011, 54, 380–384 CrossRef CAS.
- H. J. Lee and G. H. Kim, RSC Adv., 2012, 2, 7578–7587 RSC.
- T. Kean and M. Thanou, Adv. Drug Delivery Rev., 2010, 62, 3–11 CrossRef CAS PubMed.
- B. Liu, S. Shen, J. Luo, X. Wang and R. Sun, RSC Adv., 2013, 3, 9714–9722 RSC.
- Z. Jiang, H. Neetoo and H. Chen, J. Food Sci., 2011, 76, M22–M26 CrossRef CAS PubMed.
- A. M. Diez-Pascual and A. L. Diez-Vicente, RSC Adv., 2015, 5, 93095–93107 RSC.
- K. Hagisawa, A. Saito, M. Kinoshita, T. Fujie, N. Otani, S. Shono, Y. K. Park and S. Takeoka, J. Vasc. Surg., 2013, 1, 289–297 Search PubMed.
- K. Azuma, R. Izumi, T. Osaki, S. Ifuku, M. Morimoto, H. Saimoto, S. Minami and Y. Okamoto, J. Funct. Biomater., 2015, 6, 104–142 CrossRef CAS PubMed.
- T. Dai, M. Tanaka, Y. Y. Huang and M. R. Hamblin, Anti-infective Therapy, 2011, 9, 857–879 CrossRef CAS PubMed.
- C. Beaulieu and A. Blais, WO2009061409A1, 2009.
- W. G. Malette and H. J. Quigley, US4394373, 1981.
- L. W. Chan, C. H. Kim, X. Wang, S. H. Pun, N. J. White and T. H. Kim, Acta Biomater., 2016, 31, 178–185 CrossRef CAS PubMed.
- H. Hattori and M. Ishihara, Biomed. Mater., 2015, 10, 015014 CrossRef PubMed.
- A. El-Mekawy, S. Hudson, A. El-Baz, H. Hamza and K. El-Halafawy, J. Appl. Polym. Sci., 2010, 116, 3489–3496 CAS.
- S. Lee, I. Jung, S. Yu and J. P. Hong, Archives of Plastic Surgery, 2014, 41, 466–471 CrossRef PubMed.
- K. Kourelis and A. H. Shikani, Clin. Otolaryngol., 2012, 37, 309–313 CrossRef CAS PubMed.
- X. Huang, Y. Sun, J. Nie, W. Lu, L. Yang, Z. Zhang, H. Yin, Z. Wang and Q. Hu, Int. J. Biol. Macromol., 2015, 75, 322–329 CrossRef CAS PubMed.
- P. L. Kang, S. J. Chang, I. Manousakas, C. W. Lee, C. H. Yao, F. H. Lin and S. M. Kuo, Carbohydr. Polym., 2011, 85, 565–570 CrossRef CAS.
- M. A. Brown, M. R. Daya and J. A. Worley, J. Emerg. Med., 2009, 37, 1–7 CrossRef PubMed.
- M. Sanandam, A. Salunkhe, K. Shejale and D. Patil, Int. J. Adv. Biotechnol. Res., 2013, 4, 910–913 CAS.
- A. H. Smith, C. Laird, K. Porter and M. Bloch, Emerg. Med. J., 2013, 30, 784–789 CrossRef PubMed.
- J. Granville-Chapman, N. Jacobs and M. J. Midwinter, Injury, 2011, 42, 447–459 CrossRef CAS PubMed.
- S. B. Rao and C. P. Sharma, J. Biomed. Mater. Res., 1997, 34, 21–28 CrossRef CAS PubMed.
- P. R. Klokkevold, H. Fukayama, E. C. Sung and C. N. Bertolami, J. Oral Maxillofac. Surg., 1999, 57, 49–52 CrossRef CAS PubMed.
- J. Y. Je and S. K. Kim, Bioorg. Med. Chem., 2005, 13, 6551–6555 CrossRef CAS PubMed.
- E. F. Palermo, D. K. Lee, A. Ramamoorthy and K. Kuroda, J. Phys. Chem. B, 2011, 115, 366–375 CrossRef CAS PubMed.
- J. L. Thomas, H. You and D. A. Tirrell, J. Am. Chem. Soc., 1995, 117, 2949–2950 CrossRef CAS.
- A. Jintapattanakit, S. Mao, T. Kissel and V. B. Junyaprasert, Eur. J. Pharm. Biopharm., 2008, 70, 563–571 CrossRef CAS PubMed.
- C. Tapia, Z. Escobar, E. Costa, J. Sapag-Hagar, F. Valenzuela, C. Basualto, M. a. Nella Gai and M. Yazdani-Pedram, Eur. J. Pharm. Biopharm., 2004, 57, 65–75 CrossRef CAS PubMed.
- G. Ying, W. Xiong, H. Wang, Y. Sun and H. Liu, Carbohydr. Polym., 2011, 83, 1787–1796 CrossRef CAS.
- K. Kurita, H. Ikeda, Y. Yoshida, M. Shimojoh and M. Harata, Biomacromolecules, 2002, 3, 1–4 CrossRef CAS PubMed.
- S. I. Nishimura, O. Kohgo, K. Kurita and H. Kuzuhara, Macromolecules, 1991, 24, 4745–4748 CrossRef CAS.
- Y. Xie, X. Liu and Q. Chen, Carbohydr. Polym., 2007, 69, 142–147 CrossRef CAS.
- X. Meng, R. Xing, S. Liu, H. Yu, K. Li, Y. Qin and P. Li, Int. J. Biol. Macromol., 2012, 50, 918–924 CrossRef CAS PubMed.
- H. S. Thatte, S. E. Zagarins, M. Amiji and S. F. Khuri, J. Trauma, 2004, 57, S7–S12 CrossRef CAS PubMed.
- J. Armstrong and R. B. Barlow, Br. J. Pharmacol., 1976, 57, 501–516 CrossRef CAS PubMed.
Footnote |
| † Electronic supplementary information (ESI) available. See DOI: 10.1039/c6ra27417j |
| This journal is © The Royal Society of Chemistry 2017 |