 Open Access Article
Facile synthesis of biocompatible MoSe2 nanoparticles for efficient targeted photothermal therapy of human lung cancer†
Chunlei Zhong *,
Xin Zhao,
Lijiang Wang,
Yunxia Li and
Yingying Zhao
The Second Department of Respiratory Medicine, The First Affiliated Hospital of Xinxiang Medical University, Weihui 453100, China. E-mail: zhongclei@163.com
First published on 23rd January 2017
Abstract
Two-dimensional molybdenum selenide (MoSe2) nanosheets have been explored for their use as photothermal agents in tumor therapy although several biocompatibility and stability issues have hindered their use. Herein, a facile strategy to prepare PLGA–MoSe2 mixture coated with a folate (FA)-modified PEG-lipid shell led to the synthesis of multifunctional nanoparticles (FA–PL–MoSe2). The PEG-lipid shells endowed the insoluble MoSe2 nanosheets with excellent colloidal stability. FA–PL–MoSe2 nanoparticles did not only exhibit good photothermal properties, but also excellent photothermal stability. The FA conjugation promoted a high nanoparticle specificity to target human lung cancer SPC-A-1 cells as well as tumor tissue. In vitro cellular experiments demonstrated that FA–PL–MoSe2 had minor cytotoxicity, great biocompatibility, and could efficiently kill tumor cells under near-infrared laser (NIR, 808 nm) irradiation. Following about 1 month of treatment, FA–PL–MoSe2 showed good hemo-/histocompatibility combined with NIR irradiation and an improved tumor inhibition effect compared to PL–MoSe2, with no relapse and no significant systemic in vivo toxicity.
Introduction
Lung cancer incidence is increasing worldwide, resulting in millions of deaths annually.1,2 Currently, common treatments of lung cancer include surgical resection,3 radiofrequency ablation,4 and chemotherapy.5 However, these therapeutic strategies have detrimental side effects such as surgical wounds, compromised cardiopulmonary function, medical comorbidities,6 pneumothorax,7,8 and multidrug resistance,9,10 among others. Thus, these shortcomings require the development of alternative minimally invasive treatments. In recent years, photothermal therapy combined with NIR laser irradiation has been reported as a minimally invasive cancer treatment, attracting great research interest.11–14 Highly efficient photothermal therapy needs excellent photothermal agents able to absorb the NIR laser and converting it into hyperthermia to destroy tumor cells.15,16To date, two-dimensional (2D) layered transition metal dichalcogenides have drawn great attention as photothermal agents for photothermal therapy due to their novel electronic and optical properties.17,18 They are generally prepared with the formula MX2 (M, transition metal atoms; X, chalcogen atoms), and include MoS2, WS2, TiS2, among others.19–22 The exfoliated transition-metal dichalcogenides (MoS2, WS2, and WSe2) have been reported to have lower cytotoxicity than those of classic 2D materials such as graphene and its analogues.23 Among transition metal dichalcogenide materials, molybdenum selenide (MoSe2) nanosheets possess an obvious NIR absorption peak, indicating their great potential as NIR photothermal transducers.24–26 However, their poor dispersibility in water and lack of active specificity hinder its bioapplication in tumor photothermal therapy. Further processing techniques, such as ultrasonication to produce MoSe2 nanodots and poly(vinylpyrrolidone) modification, have been reported to lead to the formation of biocompatible nanosheets.24–26 Therefore, the advent of more facile processing strategies and assembly techniques for MoSe2 nanosheets formation with excellent biocompatibility and multifunctionality is urgently required.
Herein, a facile self-assembly method based on PLGA and PEG-lipid was used to prepare biocompatible MoSe2 nanoparticles (FA–PL–MoSe2, Fig. 1) consisting of a PLGA/MoSe2 core and a PEG-lipid shell. The PEG-lipid coating endows these nanosheets with excellent hydrophilicity. Since tumor targeting is a promising strategy to better exploit the potential of photothermal agents in photothermal therapy, in order to enhance the tumor therapeutic effect, folate (FA), a water-soluble vitamin essential for human health, was conjugated onto the shells to target the FA receptors overexpressed in lung cancer cells.27–29 The toxicity and biocompatibility of FA–PL–MoSe2 were systematically evaluated in vitro and in vivo and lung cancer cells and tumor tissues were treated with FA–PL–MoSe2 under 808 nm laser irradiation in order to confirm the photothermal therapy effect.
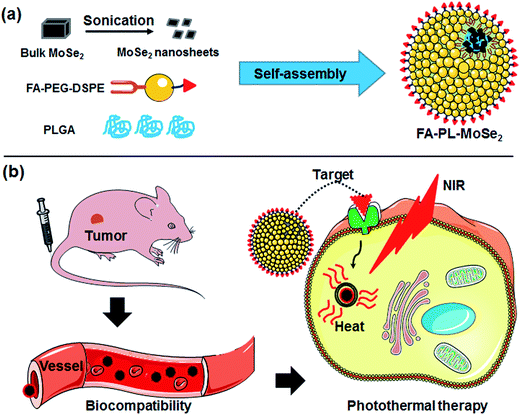 | ||
| Fig. 1 A schematic illustration of FA–PL–MoSe2 nanoparticles preparation and tumor targeted photothermal therapy. | ||
Experimental section
Materials
Bulk MoSe2 powder was purchased from Alfa Aesar Co. Ltd. Soybean lecithin consisting of 90–95% phosphatidylcholine, 1,2-distearoyl-sn-glycerol-3-phosphoethanolamine-N-[folate(polyethylene glycol)-2000] (DSPE-PEG2000-FA) and 1,2-distearoyl-sn-glycero-3-phosphoethanolamine-N-[carboxy(polyethylene glycol)-2000] (DSPE-PEG2000-COOH) were obtained from Shanghai Ponsure Biotech. Co. Ltd. Indocyanine green (ICG) was purchased from Sigma-Aldrich (St. Louis, Mo, USA). Poly(D,L-lactide-co-glycolide) (PLGA, MW: 5000–15![[thin space (1/6-em)]](https://www.rsc.org/images/entities/char_2009.gif) 000, lactide
000, lactide![[thin space (1/6-em)]](https://www.rsc.org/images/entities/char_2009.gif) :
:![[thin space (1/6-em)]](https://www.rsc.org/images/entities/char_2009.gif) glycolide (50
glycolide (50![[thin space (1/6-em)]](https://www.rsc.org/images/entities/char_2009.gif) :
:![[thin space (1/6-em)]](https://www.rsc.org/images/entities/char_2009.gif) 50)) and 4′,6-diamidino-2-phenylindole (DAPI) were obtained from Aladdin (Shanghai, China). Trypsin–EDTA solution, phosphate buffer (PBS), fetal bovine serum (FBS), penicillin–streptomycin solution, and RPMI-1640 Media were procured from Corning Inc.
50)) and 4′,6-diamidino-2-phenylindole (DAPI) were obtained from Aladdin (Shanghai, China). Trypsin–EDTA solution, phosphate buffer (PBS), fetal bovine serum (FBS), penicillin–streptomycin solution, and RPMI-1640 Media were procured from Corning Inc.
Preparation of FA–PL–MoSe2
MoSe2 nanosheets were prepared according to the previously reported methods.24,25 In detail, 50 mg MoSe2 powder was added into 50 mL water, and then the aqueous dispersion was sonicated in an ice-bath by using tip ultrasonic processor (Scientz-IID, 950 W, 25 kHz) with 70% amplitude for 10 h (the sonication was pulsed for 2 s on and 3 s off). The MoSe2 suspension was centrifuged at 4500 rpm for 20 min to separate the large aggregates. Afterwards, the supernatant was then mixed with 10 mg mL−1 PLGA and sonicated in an ice-bath with 50% amplitude for 3 h to obtain the emulsion. And then, the emulsified mixture was added into 12 mL of deionized water containing soybean phosphatidylcholine and DSPE-PEG2000-FA at a mass ratio of 2![[thin space (1/6-em)]](https://www.rsc.org/images/entities/char_2009.gif) :
:![[thin space (1/6-em)]](https://www.rsc.org/images/entities/char_2009.gif) 1 under gentle stirring. The FA–PL–MoSe2 was washed for three times using an Amicon Ultra-4 centrifugal filter (Millipore, Billerica, MA) with a molecular weight cutoff of 100 kDa. As a control, the nanoparticles without FA target molecules were prepared using the same method in which the DSPE-PEG2000-FA was replaced by DSPE-PEG2000-COOH. The purified FA–PL–MoSe2 was stored at 4 °C before use.
1 under gentle stirring. The FA–PL–MoSe2 was washed for three times using an Amicon Ultra-4 centrifugal filter (Millipore, Billerica, MA) with a molecular weight cutoff of 100 kDa. As a control, the nanoparticles without FA target molecules were prepared using the same method in which the DSPE-PEG2000-FA was replaced by DSPE-PEG2000-COOH. The purified FA–PL–MoSe2 was stored at 4 °C before use.
Characterizations
Transmission electron microscope (TEM) images were obtained on a JEOL JEM2011 at 200 kV. Atomic force microscopy (AFM) images were recorded by a Multimode V8 in tapping mode. Dynamic light scattering (DLS) and zeta potential characterization were performed on a Malvern Zetasizer Nano ZS (ZS90). UV-vis absorption spectra ranging from 900 to 400 nm were recorded using a Lambda 750 spectrophotometer (PerkinElmer). The content of Mo in cells and tissue was measured by inductively coupled plasma-atomic emission spectrometry (ICP-AES; Hitachi, P4010). Photothermal effect measurements were performed under irradiation by 808 nm diode laser (Changchun New Industries Optoelectronics Technology Co. Ltd., MDL-III-808R). During NIR irradiation, variation of the temperature was recorded every 30 s using a thermocouple thermometer (Fluke).Cell culture and cellular uptake
Human lung cancer SPC-A-1 cells were provided by the American Type Culture Collection (ATCC) and cultured in RPMI-1640 media supplemented with 10% FBS and 1% penicillin–streptomycin at 37 °C with 5% CO2.For cellular uptake, SPC-A-1 cells (2 × 10⁵ cells per well) were seeded in a 6-well cell culture plate and incubated for 24 h. Afterwards, the media were replaced with fresh RPMI-1640 media containing FA–PL–MoSe2 and then cultured for an extra 3 h. After discarding the media, cells were gently rinsed with PBS for three times, homogenized, and treated with 1 mL aqua regia solution for 4 h. Mo content internalized by cells was detected by an ICP-AES. In addition, the cells treated with FA–PL–MoSe2 were collected for Bio-TEM to observe the location of the nanoparticles inner and outer cells. The detailed Bio-TEM was performed according to previous report.30
To further observe the cellular uptake, ICG was used to label the FA–PL–MoSe2. SPC-A-1 cells adhered to glass slides in 6-well plates and were incubated with free ICG, PL–MoSe2, FA–PL–MoSe2 and FA–PL–MoSe2 + FA blocking at the same concentration of ICG (0.05 mg mL−1) for 3 h, respectively. The cells were then washed with PBS thrice and fixed by 0.2 mL of glutaraldehyde, followed by staining with DAPI for 10 min. The fluorescence images of cells were captured using the laser scanning microscope.
In vitro biocompatibility
In vitro hemolysis assay was conducted according to previous work.31 In detail, 0.2 mL separated red blood cells (RBCs) were mixed with 0.8 mL FA–PL–MoSe2 (in PBS) at predetermined concentrations (50 μg mL−1, 100 μg mL−1, 150 μg mL−1, 200 μg mL−1 and 250 μg mL−1). RBCs incubated with deionized water or PBS were used as positive or negative control, respectively. After standing incubated at 37 °C for 1 h, the above set of suspensions were centrifuged (10![[thin space (1/6-em)]](https://www.rsc.org/images/entities/char_2009.gif) 000 rpm, 1 min) and the absorbance of the supernatants at 541 nm was monitored by a UV-vis spectrometer. The hemolytic percentage (HP) was calculated using the following equation.
000 rpm, 1 min) and the absorbance of the supernatants at 541 nm was monitored by a UV-vis spectrometer. The hemolytic percentage (HP) was calculated using the following equation.where At, Apc and Anc are the absorbance of the supernatant at 541 nm of the test sample, positive and negative controls, respectively.
In addition, the cytotoxicity of FA–PL–MoSe2 was conducted by using a standard CCK-8 assay (Bestbio, China). SPC-A-1 cells (1 × 10⁵ cells per mL, 0.5 mL) were seeded in 96-well plate and cultured for 24 h. After discarding the old media, fresh media containing 0.01, 0.05, 0.1, 0.3 and 0.5 mg mL−1 of FA–PL–MoSe2 were incubated with SPC-A-1 cells for 24 h. PBS was used to mildly wash the cells three times. A 100 μL CCK-8 working solution (10% CCK-8 + 90% RPMI-1640) was then added to each well, followed by incubation at 37 °C for 1 h. The absorbance value at 450 nm was detected using a microplate reader (Infinite 200 Pro, Tecan, Austria). Photos of the cells after 24 h treatment with 0.05 and 0.5 mg mL−1 of FA–PL–MoSe2 were collected by an optical microscope.
In vitro photothermal therapy
The in vitro photothermal performance of FA–PL–MoSe2 was tested. In detail, 100 μL FA–PL–MoSe2 dispersions with different Mo concentrations were placed in each well of 96-well plate and irradiated under 808 nm laser irradiation for 5 min. The real-time temperature and thermal images of the test samples at different time points (once every 30 seconds) were recorded using the thermocouple thermometer and infrared thermal camera (Fluke TI10, USA), respectively.For in vitro photothermal therapy, SPC-A-1 cells were seeded in 96-well plates (2 × 10⁴ cells per well). After 24 h incubation, the cells were treated with fresh media containing PL–MoSe2 and FA–PL–MoSe2 at different Mo concentrations (PBS was used for the control group). After another 12 h, the media were discarded and the free PL–MoSe2 and FA–PL–MoSe2 outside the cells were removed via PBS washing. After addition of fresh media, the cells were irradiated by an 808 nm laser (1 W cm−2, 5 min). The treated cells were incubated for another 24 h, and cell viability was then measured by a standard CCK-8 assay.
Blood analysis
Five healthy Balb/c nude mice were intravenously injected with 150 μL FA–PL–MoSe2 at a Mo dose of 15 mg kg−1. Mice treated with saline were used as blank control group. On the day 1, day 7, and day 24 post injection, the mice were sacrificed to collect blood. The whole blood was divided into two parts. The one was centrifuged and the blood supernatant was used to analyze the serum biochemistry parameters including aspartate aminotransferase (AST) and alanine aminotransferase (ALT). The other was used for complete blood counts evaluations including white blood cell (WBC), red blood cells (RBC), hemoglobin (HGB), mean platelet volume (MPV), mean corpuscular hemoglobin (MCH), hematocrit (HCT), mean corpuscular hemoglobin concentration (MCHC), mean corpuscular volume (MCV) and platelet (PLT).Animal model and in vivo biodistribution
Balb/c nude mice (3–5 week old) were used in vivo experiments and were purchased from Charles River Laboratories (Beijing, China). 1 × 10⁶ SPC-A-1 cells in 150 μL PBS were subcutaneous injected into the back of Balb/c nude mouse to establish animal tumor model. After tumor volume reached 80 mm,3 the mice were used for further in vivo experiments. All welfare and experimental procedures in this study were performed in accordance with the policies of National Ministry of Health and approved by the Ethics Committee of Xinxiang Medical University.Systemic biodistribution of FA–PL–MoSe2 was performed in tumor-bearing mice. The tissues including the tumor, heart, liver, spleen, lung, and kidney were weighed and digested by aqua regia solution overnight at 1 h, 1 day, 7 days, and 24 days post intravenous injection of FA–PL–MoSe2 (15 mg kg−1). The Mo content in different tissues was then analyzed by an ICP-AES.
In vivo photothermal therapy
Prior to in vivo photothermal therapy, tumor-bearing mice treated with saline (blank control), PL–MoSe2 and FA–PL–MoSe2. After 24 h intravenous injection, tumor region was irradiated under 808 nm laser irradiation (1 W cm−2) for 5 min, and simultaneously the real-time images were captured by an infrared thermal camera. Moreover, tumor-bearing mice (n = 5 per group) were treated with saline, FA–PL–MoSe2, PL–MoSe2 + NIR and FA–PL–MoSe2 + NIR (with 5 mg kg−1 of MoSe2). After 24 h intravenous injection, tumor region was irradiated under 808 nm laser irradiation (1 W cm−2) for 5 min. During the irradiation, the temperature and thermal images of the tumor region at different time points (once every 30 seconds) were recorded using the thermocouple thermometer and infrared thermal camera, respectively. During the treatment, the relative tumor volume (V/V0, where V0 represents tumor volume when the treatment was initiated, i.e., day 0), body weight of each mouse were monitored every four days.Histology examination
Healthy Balb/c nude mice were intravenously injected with 150 μL of saline and FA–PL–MoSe2 (15 mg kg−1) for 1 day or 24 days. And then, mice were sacrificed and the major organs including the heart, liver, spleen, lung, and kidney were collected. The obtained organs were fixed with 4% paraformaldehyde overnight. Afterwards, these organs were dehydrated in 25% sucrose, sectioned into 5 μm slices and stained with hematoxylin and eosin (H&E). The stained sections were imaged under an inverted phase contrast microscope.Results and discussion
Preparation and characterization of FA–PL–MoSe2
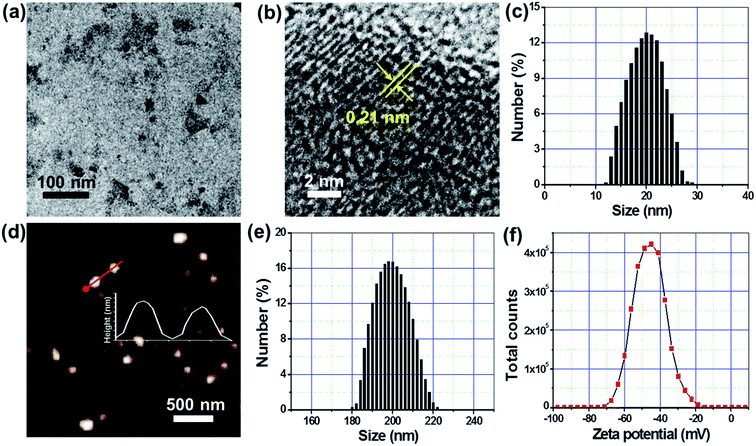
Fig. 1 schematically illustrates the preparation of FA–PL–MoSe2 and the NIR-triggered thermal effect for tumor targeted therapy. In brief, unstable MoSe2 nanosheets were prepared from commercial bulk MoSe2 under ultrasonication, and then stabilized by a PLGA core and PEG-lipid shell, whilst simultaneously being modified by the target molecule FA (Fig. 1a).The morphology of the as-prepared MoSe2 nanosheets was observed by TEM to be that of flake-like particles; high-resolution TEM images showed a lattice spacing of 0.21 nm (Fig. 2a and b); DLS analysis showed an average diameter of approximately 20 nm (Fig. 2c). Following PEG-lipid shell formation, the FA–PL–MoSe2 nanoparticles were almost spherical according to AFM analysis and approximately 200 nm in average diameter as evaluated by DLS analysis (Fig. 2d, e and S1†). The zeta potential of FA–PL–MoSe2 was determined to be −71 to −18.5 mV (Fig. 2f and S2†).
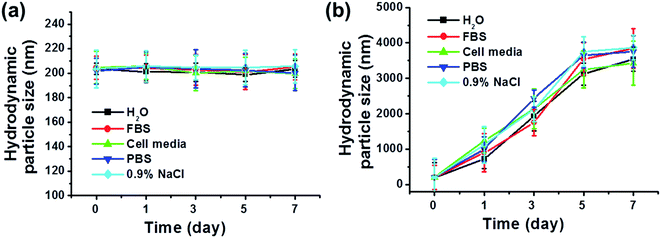
Prior to preparing the insoluble MoSe2 nanosheets for biomedical applications, a PEG-lipid shell was assembled around the MoSe2 nanosheets via a self-assembly method to enhance its biocompatibility and physiologic stability. MoSe2 nanosheets and FA–PL–MoSe2 were mixed with water, FBS, cell media, PBS, or saline. The average size of the FA–PL–MoSe2 nanoparticles in these media featured almost no changes over 1 week (Fig. 3a). However, for bare MoSe2 nanosheets, the nanoparticles inevitably aggregated and precipitated in these media due to the electron screen effect,32 which results in a significant increase of hydrodynamic size (Fig. 3b). These results provide further evidence for the high physiologic stability of FA–PL–MoSe2, most likely due to the PEG-lipid shell around the MoSe2 nanosheets.33–35
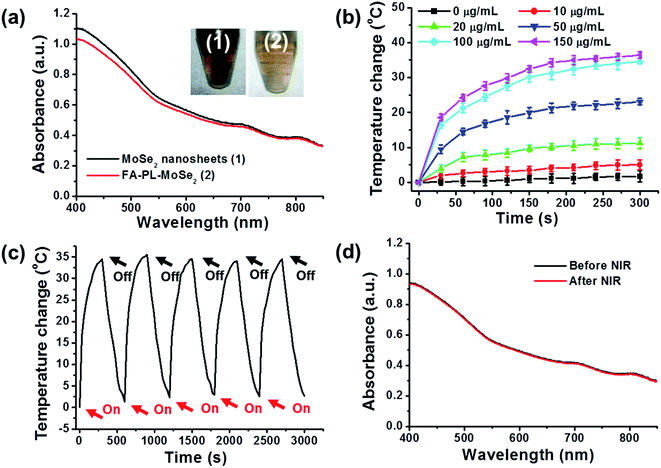
Fig. 4a shows the UV-vis spectra of MoSe2 nanosheets and FA–PL–MoSe2. Both particle types had equally strong absorption in the NIR region, indicating that the encapsulation of PEG-lipid did not influence the absorbance intensity of MoSe2. The temperature change of FA–PL–MoSe2 aqueous solution at different concentrations (0–150 μg mL−1) was recorded under 808 nm irradiation (1 W cm−2, 5 min). Fig. 4b shows the photothermal heating curves, indicating obvious concentration-dependent effects. After 5 min of NIR irradiation, the maximum rising temperature reached approximately 40 °C for the FA–PL–MoSe2 solution at a concentration of 150 μg mL−1; as the control, the temperature of pure water increased by approximately 1 °C under the same conditions. Fig. 4c depicts the photostability of FA–PL–MoSe2, indicating that it retained its initial excellent photothermal effects without any weakening of temperature elevation after five cycles of irradiation. Furthermore, FA–PL–MoSe2 presented with similar absorbance spectra before and after five cycles of NIR irradiation (Fig. 4d). These results demonstrate that FA–PL–MoSe2 has remarkable photostability and an excellent photothermal conversion effect.
Cellular uptake
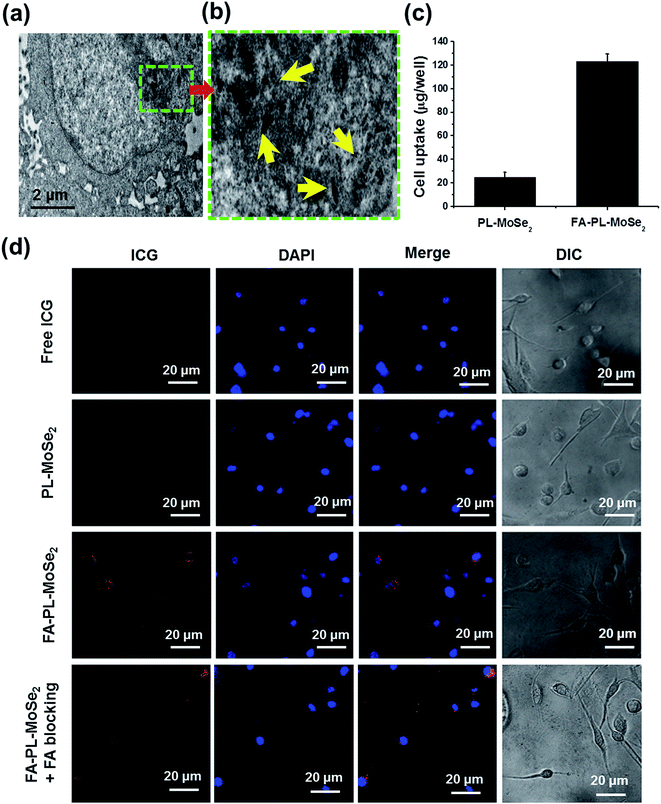
After incubation with FA–PL–MoSe2 for 3 h, the cytoplasm of SPC-A-1 cells showed a large number of FA–PL–MoSe2 nanoparticles (Fig. 5a), as confirmed from the high-magnification image (Fig. 5b). According to the ICP-AES quantitative analysis, SPC-A-1 cells tended to uptake more FA–PL–MoSe2 than PL–MoSe2 (Fig. 5c). To further evaluate the cellular uptake, PL–MoSe2 and FA–PL–MoSe2 were labeled by ICG, a NIR fluorescence dye. Fig. 5d shows much stronger ICG fluorescence emitting from inside the cytoplasm in FA–PL–MoSe2-treated cells than that of PL–MoSe2- and free ICG-treated cells. In addition, after FA blocking, SPC-A-1 cells were treated with FA–PL–MoSe2. There is less ICG fluorescence inside the cytoplasm than FA–PL–MoSe2-treated cells, which may be due to the blocking of FA receptor on cell by free FA. These data demonstrate that FA facilitated the uptake of FA–PL–MoSe2 into the cells, likely via the receptor-mediated endocytosis pathway.36,37In vitro biocompatibility
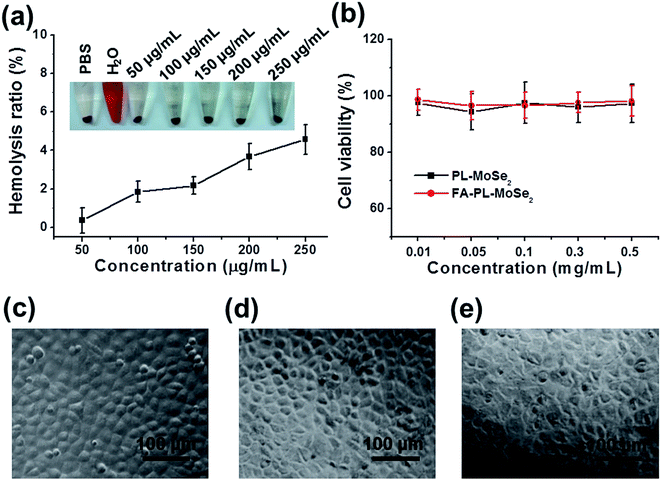
As shown in Fig. 6a, no significant hemolysis phenomenon was detected for FA–PL–MoSe2-treated RBCs below 250 μg mL−1, similar to that of the negative PBS-treated group, suggesting an excellent hemocompatibility of FA–PL–MoSe2.38,39 Moreover, the cytotoxicity of the nanoparticles on SPC-A-1 cells was evaluated by the CCK-8 assay. As shown in Fig. 6b, FA–PL–MoSe2 below 0.5 mg mL−1 exhibited significantly low toxicity to cells, with a higher than 90% cell viability. The cell morphology of SPC-A-1 cells after 24 h of treatment with FA–PL–MoSe2 (0.05 and 0.5 mg mL−1) exhibited no appreciable change, and was similar to the control group (Fig. 6c–e). These results indicate that the FA–PL–MoSe2 has a great biocompatibility in vitro.In vitro photothermal therapy
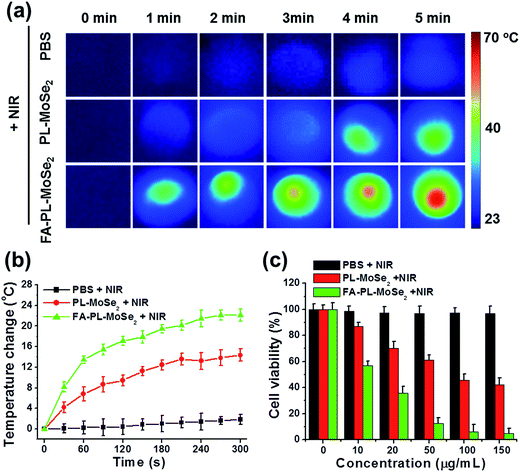
Adherent cells were firstly incubated with PBS, PL–MoSe2, or FA–PL–MoSe2 solution (100 μg mL−1 of MoSe2) for 3 h, respectively. The cells were then treated by 808 nm irradiation (1.0 W cm−2) for 5 min. As shown in Fig. 7a, cells treated with FA–PL–MoSe2 showed the highest temperature increase after 5 min irradiation compared to PL–MoSe2- and PBS-treated cells, with the highest temperature increase being of 22 °C as detected by a thermometer (Fig. 7b). The cells in these three groups were cultured for a further 21 h, and their viabilities were detected by the CCK-8 assay. As shown in Fig. 7c, the FA–PL–MoSe2-treated SPC-A-1 cells showed a most significant concentration-dependent cell death due to the FA targeting facilitating the internalization of FA–PL–MoSe2 and thus the generation of more heat to kill cells.In vivo biocompatibility
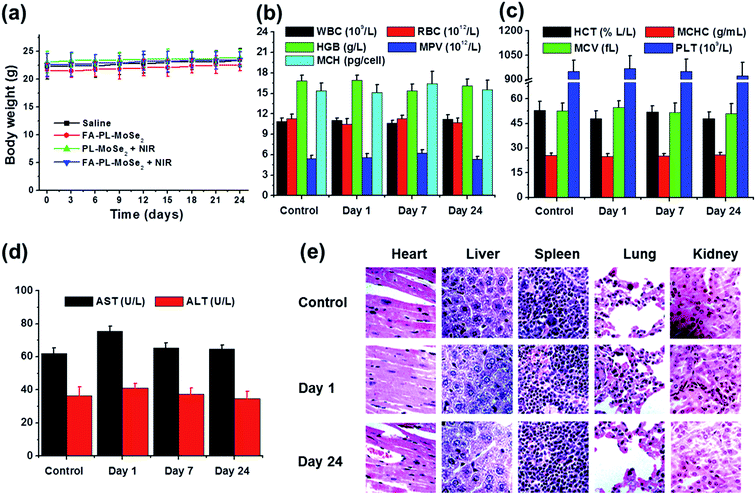
As shown in Fig. 8a, there were no distinct weight changes over 24 days treatment in the control Balb/c mice nor in those treated with FA–PL–MoSe2, PL–MoSe2 + NIR, and FA–PL–MoSe2 + NIR. As illustrated in Fig. 8b–d, complete blood counts (including WBC, RBC, HGB, MPV, MCH, HCT, MCHC, MCV, and PLT), and blood biochemistry (including AST and ALT) in FA–PL–MoSe2-treated mice over 24 days showed no significant difference compared to the control (saline treated group). Fig. 8e showed no apparent pathological tissue damage or abnormality in major organs (heart, liver, spleen, lung, and kidney) in FA–PL–MoSe2-treated mice according to H&E staining results. These results demonstrated that FA–PL–MoSe2 showed low toxicity and excellent in vivo biocompatibility.In vivo photothermal therapy
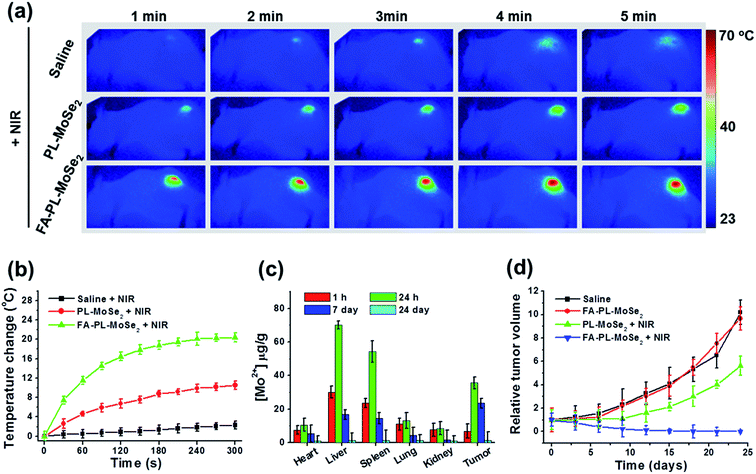
Tumor-bearing mice were intravenously injected with saline, PL–MoSe2, and FA–PL–MoSe2 and, 24 h later, the tumor regions were irradiated by 808 nm laser (1 W cm−2) for 5 min. As shown in Fig. 9a and b, NIR irradiation induced the highest temperature increase (by about 20 °C) in FA–PL–MoSe2-treated tumor regions compared with saline or PL–MoSe2-treated groups.The biodistribution of Mo element in various tissues including the heart, liver, spleen, lung, kidney, and tumor at 1 h and 24 h, 7 days and 24 days following an intravenous injection of FA–PL–MoSe2 is shown in Fig. 9c. For the first 24 h post-injection, the majority of the Mo was accumulated in the tumor tissue except for liver and spleen. After 24 h, the Mo level in all tissues decreased with time, while in the tumor, it remained relatively high over seven days, indicating that the nanoparticles could be eliminated from these major organs thus avoiding potential toxic and side effects. These results were likely due to the fact that the PEG-lipid coating can improve the blood circulation duration and effectively decrease the macrophage clearance of nanoparticles by the reticuloendothelial system as well as the FA tumor targeting effect enhancing tumor accumulation.40,41
Fig. 9d shows the in vivo photothermal therapy effect of FA–PL–MoSe2. Due to the excellent targeting and photothermal effects, tumor-bearing mice treated with FA–PL–MoSe2 combined with 808 nm laser showed significant tumor ablation and growth suppression, and no tumor relapse was observed at 1 month post treatment.
Conclusions
In summary, an excellent photothermal therapy agent based on PEG-lipid coated MoSe2 nanosheets was successfully synthesized and used for efficient tumor targeted photothermal therapy. The PLGA core and PEG-lipid shell provided the unstable MoSe2 nanosheets with outstanding physiological stability and photostability, as well as in vitro and in vivo biocompatibility. The inner MoSe2 core can easily absorb and convert NIR laser into hyperthermia, whereas the outer FA coating can facilitate the internalization of nanoparticles into the cells via receptor-mediated endocytosis. In addition, in vitro and in vivo studies showed that, compared with PL–MoSe2, FA–PL–MoSe2 coupled with NIR irradiation significantly induced a temperature increase being of about 20 °C and thus had an excellent targeting anticancer efficacy without any toxicity to healthy tissues. Therefore, considering all of the above desirable characteristics, the FA–PL–MoSe2 nanoparticles will be a promising agent for cancer photothermal therapy.Conflict of interest
The author reports no conflicts of interest in this work.Notes and references
- J. Ferlay, I. Soerjomataram, R. Dikshit, S. Eser, C. Mathers, M. Rebelo, D. M. Parkin, D. Forman and F. Bray, Int. J. Cancer, 2015, 136, E359–E386 CrossRef CAS PubMed.
- J. K. Field, M. Oudkerk, J. H. Pedersen and S. W. Duffy, Lancet, 2013, 382, 732–741 CrossRef.
- S. H. Hyun, J. Y. Choi, K. Kim, J. Kim, Y. M. Shim, S. W. Um, H. Kim, K. H. Lee and B. T. Kim, Ann. Surg., 2013, 257, 364–370 CrossRef PubMed.
- J. M. Lee, G. Y. Jin, S. N. Goldberg, Y. C. Lee, G. H. Chung, Y. M. Han, S. Y. Lee and C. S. Kim, Radiology, 2004, 230, 125–134 CrossRef PubMed.
- J. A. Greer, W. F. Pirl, V. A. Jackson, A. Muzikansky, I. T. Lennes, R. S. Heist, E. R. Gallagher and J. S. Temel, J. Clin. Oncol., 2012, 30, 394–400 CrossRef PubMed.
- P. B. Bach, L. D. Cramer, C. B. Begg and J. L. Warren, N. Engl. J. Med., 2000, 342, 518–519 Search PubMed.
- A. M. Roy, C. Bent and T. Fotheringham, Curr. Probl. Diagn. Radiol., 2009, 38, 44–52 CrossRef PubMed.
- K. Hirohashi, T. Anayama, H. Wada, T. Nakajima, T. Kato, S. Keshavjee, K. Orihashi and K. Yasufuku, J. Bronchology Interv. Pulmonol., 2015, 22, 99–106 CrossRef PubMed.
- N. R. Patel, B. S. Pattni, A. H. Abouzeid and V. P. Torchilin, Adv. Drug Delivery Rev., 2013, 65, 1748–1762 CrossRef CAS PubMed.
- F. Zhi, H. Dong, X. Jia, W. Guo, H. Lu, Y. Yang, H. Ju, X. Zhang and Y. Hu, PLoS One, 2013, 8, e60034 CAS.
- K. Yang, L. Hu, X. Ma, S. Ye, L. Cheng, X. Shi, C. Li, Y. Li and Z. Liu, Adv. Mater., 2012, 24, 1868–1872 CrossRef CAS PubMed.
- J. Chen, H. Liu, C. Zhao, G. Qin, G. Xi, T. Li, X. Wang and T. Chen, Biomaterials, 2014, 35, 4986–4995 CrossRef CAS PubMed.
- C. Li, Z. Liu and P. Yao, RSC Adv., 2016, 6, 33083–33091 RSC.
- Y. W. Chen, Y. L. Su, S. H. Hu and S. Y. Chen, Adv. Drug Delivery Rev., 2016, 105, 190–204 CrossRef CAS PubMed.
- C. Zhang, Y. Y. Fu, X. Zhang, C. Yu, Y. Zhao and S. K. Sun, Dalton Trans., 2015, 44, 13112–13118 RSC.
- H. A. Hoffman, L. Chakrabarti, M. F. Dumont, A. D. Sandler and R. Fernandes, RSC Adv., 2014, 4, 29729–29734 RSC.
- M. Chhowalla, Z. Liu and H. Zhang, Chem. Soc. Rev., 2015, 44, 2584–2586 RSC.
- L. Yang, S. Wang, J. Mao, J. Deng, Q. Gao, Y. Tang and O. G. Schmidt, Adv. Mater., 2013, 25, 1180–1184 CrossRef CAS PubMed.
- R. Deng, H. Yi, F. Fan, L. Fu, Y. Zeng, Y. Wang, Y. Li, Y. Liu, S. Ji and Y. Su, RSC Adv., 2016, 6, 77083–77092 RSC.
- J. Chen, C. Liu, D. Hu, F. Wang, H. Wu, X. Gong, X. Liu, L. Song, Z. Sheng and H. Zheng, Adv. Funct. Mater., 2016, 26, 8715–8725 CrossRef CAS.
- L. Cheng, J. Liu, X. Gu, H. Gong, X. Shi, T. Liu, C. Wang, X. Wang, G. Liu, H. Xing, W. Bu, B. Sun and Z. Liu, Adv. Mater., 2014, 26, 1794 CrossRef.
- X. Qian, S. Shen, T. Liu, L. Cheng and Z. Liu, Nanoscale, 2015, 7, 6380–6387 RSC.
- W. Z. Teo, E. L. Chng, Z. Sofer and M. Pumera, Chemistry, 2014, 20, 9627–9632 CrossRef CAS PubMed.
- L. Yuwen, J. Zhou, Y. Zhang, Q. Zhang, J. Shan, Z. Luo, L. Weng, Z. Teng and L. Wang, Nanoscale, 2016, 8, 2720–2726 RSC.
- Z. Lei, W. Zhu, S. Xu, J. Ding, J. Wan and P. Wu, ACS Appl. Mater. Interfaces, 2016, 8, 20900–20908 CAS.
- C. Wang, J. Bai, Y. Liu, X. Jia and X. Jiang, ACS Biomater. Sci. Eng., 2016, 2, 2011–2017 CrossRef CAS.
- P. T. Cagle, Q. J. Zhai, L. Murphy and P. S. Low, Arch. Pathol. Lab. Med., 2013, 137, 241–244 CrossRef CAS PubMed.
- H. Wang, L. Zheng, C. Peng, M. Shen, X. Shi and G. Zhang, Biomaterials, 2013, 34, 470–480 CrossRef CAS PubMed.
- M. Salem, Y. Xia, A. Allan, S. Rohani and E. R. Gillies, RSC Adv., 2015, 5, 37521–37532 RSC.
- S. Wang, K. Li, Y. Chen, H. Chen, M. Ma, J. Feng, Q. Zhao and J. Shi, Biomaterials, 2015, 39, 206–217 CrossRef CAS PubMed.
- X. Li, Y. Gong, X. Zhou, H. Jin, H. Yan, S. Wang and J. Liu, Int. J. Nanomed., 2016, 11, 1819–1833 CAS.
- L. Chen, W. Feng, X. Zhou, K. Qiu, Y. Miao, Q. Zhang, M. Qin, L. Li, Y. Zhang and C. He, RSC Adv., 2016, 6, 13040–13049 RSC.
- J. M. Chan, L. Zhang, K. P. Yuet, G. Liao, J. W. Rhee, R. Langer and O. C. Farokhzad, Biomaterials, 2009, 30, 1627–1634 CrossRef CAS PubMed.
- F. Yu, Y. Li, C. S. Liu, Q. Chen, G. H. Wang, W. Guo, X. E. Wu, D. H. Li, W. D. Wu and X. D. Chen, Int. J. Pharm., 2015, 484, 181–191 CrossRef CAS PubMed.
- L. J. Cruz, M. A. Stammes, I. Que, E. R. van Beek, V. T. Knol-Blankevoort, T. J. Snoeks, A. Chan, E. L. Kaijzel and C. W. Löwik, J. Controlled Release, 2016, 223, 31–41 CrossRef CAS PubMed.
- C. Zheng, M. Zheng, P. Gong, D. Jia, P. Zhang, B. Shi, Z. Sheng, Y. Ma and L. Cai, Biomaterials, 2012, 33, 5603–5609 CrossRef CAS PubMed.
- Y. Lu and P. S. Low, Adv. Drug Delivery Rev., 2012, 64, 342–352 CrossRef.
- H. Wei, L. Han, Y. Tang, J. Ren, Z. Zhao and L. Jia, J. Mater. Chem. B, 2015, 3, 1646–1654 RSC.
- C. Shen, X. Liu, B. Fan, C. Shen, X. Liu, B. Fan, P. Lan, F. Zhou, X. Li, H. Wang, X. Xiao, L. Li, S. Zhao, Z. Guo, Z. Pu and Y. Zheng, RSC Adv., 2016, 6, 86410–86419 RSC.
- Q. Xu, L. M. Ensign, N. J. Boylan, A. Schön, X. Gong, J. C. Yang, N. W. Lamb, S. Cai, T. Yu, E. Freire and J. Hanes, ACS Nano, 2015, 9, 9217–9227 CrossRef CAS PubMed.
- M. Yang, M. Wada, M. Zhang, K. Kostarelos, R. Yuge, S. Iijima, M. Masuda and M. Yudasaka, Acta Biomater., 2013, 9, 4744–4753 CrossRef CAS PubMed.
Footnote |
| † Electronic supplementary information (ESI) available. See DOI: 10.1039/c6ra27384j |
| This journal is © The Royal Society of Chemistry 2017 |


