 Open Access Article
High performance asymmetric supercapacitors with ultrahigh energy density based on hierarchical carbon nanotubes@NiO core–shell nanosheets and defect-introduced graphene sheets with hole structure
Zenghui Qiu,
Dawei He,
Yongsheng Wang *,
Xuan Zhao,
Wen Zhao and
Honglu Wu
Key Laboratory of Luminescence and Optical Information, Ministry of Education, Institute of Optoelectronic Technology, Beijing Jiaotong University, No.3 Shang Yuan Cun, Hai Dian District, Beijing 100044, P. R. China. E-mail: 2660779034@qq.com; Fax: +86 10 51688018
First published on 23rd January 2017
Abstract
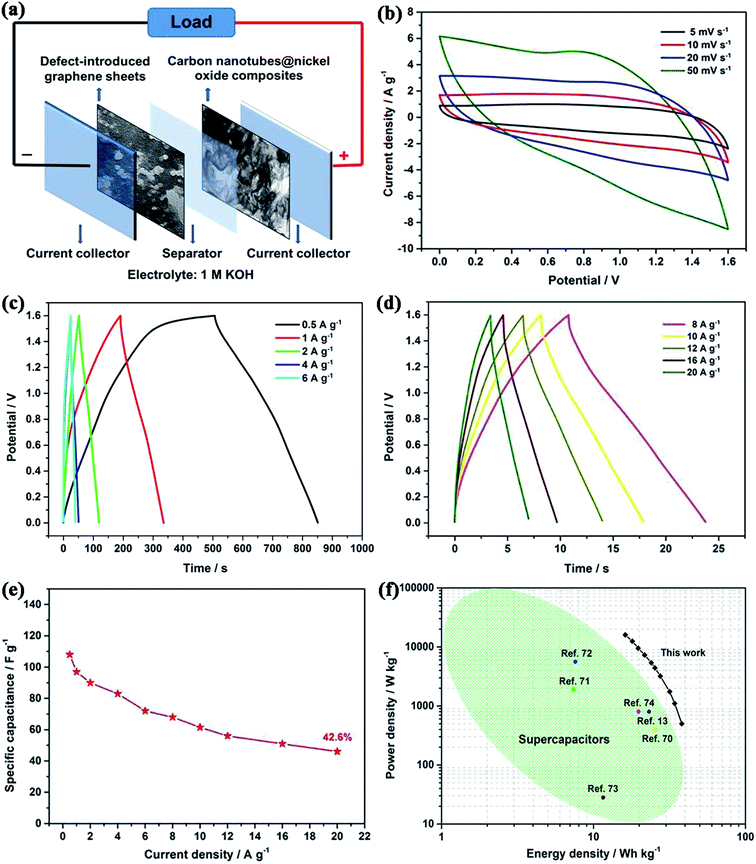
In this work, we report a fast and cost-effective cobalt catalyzed gasification strategy to obtain defect-introduced graphene sheets (DGNs) with hole structure. Compared with the pristine graphene, the porous DGNs display much more outstanding capacitive behaviors. An electrode based on the DGNs shows an ultrahigh specific capacitance of 256 F g−1 at 1 A g−1 and 148 F g−1 even at 20 A g−1. In addition, hierarchical carbon nanotubes@NiO (CNT@NiO) core–shell hybrids were fabricated via a facile chemical bath deposition method, followed by thermal annealing. The resulting CNT@NiO electrode shows a considerable specific capacitance of 1000 F g−1 at 1 A g−1. For the first time, an advanced asymmetric supercapacitor (ASC) device was successfully fabricated consisting of a porous DGN-based negative electrode and a hierarchical CNT@NiO core–shell nanosheet-based positive electrode. The device exhibits a high specific capacitance of 108 F g−1 at 0.5 A g−1 and an excellent cycling stability, with 93.5% capacitance retention after 10![[thin space (1/6-em)]](https://www.rsc.org/images/entities/char_2009.gif) 000 cycles at 6 A g−1. Due to its unique microstructures, the CNT@NiO//DGNs ASC device displays a supreme energy density of 38.1 W h kg−1 at a power density of 500 W kg−1 and even retains an energy density of 16.2 W h kg−1 at 16
000 cycles at 6 A g−1. Due to its unique microstructures, the CNT@NiO//DGNs ASC device displays a supreme energy density of 38.1 W h kg−1 at a power density of 500 W kg−1 and even retains an energy density of 16.2 W h kg−1 at 16![[thin space (1/6-em)]](https://www.rsc.org/images/entities/char_2009.gif) 000 W kg−1 (voltage window of 1.6 V). These results indicate that our ASC device is extremely valuable for energy storage applications and predict future trends toward the realization of graphene-based materials used in supercapacitors.
000 W kg−1 (voltage window of 1.6 V). These results indicate that our ASC device is extremely valuable for energy storage applications and predict future trends toward the realization of graphene-based materials used in supercapacitors.
1. Introduction
In recent years, research into the development of environmentally friendly and renewable high-power energy storage devices has gained much attention, due to the diminishing supply of fossil fuels and the problems associated with environmental pollution. Among these energy storage devices, supercapacitors have attracted considerable attention for energy storage applications owing to their high power density, rapid charge–discharge capability, ultralong life cycle, good stability, and eco-friendliness.1–5 Generally speaking, supercapacitors are usually divided into two categories according to their energy storage behavior: electrical double layer capacitors (EDLCs) based on porous carbon materials and pseudocapacitors based on transition metal oxides/hydroxides. Supercapacitors fill the gap between batteries and conventional dielectric capacitors,6–8 and they are extensively utilized in electric vehicles, memory back-up systems, military applications, electronics, and mobile communications etc.,8–10 where their ultrahigh power density (up to 10 kW kg−1) and ultralong cycle-life (>105 cycles) is satisfactory. Supercapacitors have been considered as the most promising power source in new-generation energy storage systems.However, because of their limited operating working potential (0.6 to 1 V), current symmetrical supercapacitors usually suffer from a lower energy density than rechargeable batteries, which cannot meet the requirements of many practical applications.11–13 Therefore, extensive research efforts have been employed to obtain supercapacitors with wider operating voltages and higher energy.14–16 In terms of the equation:
| E = 0.5CV2, | (1) |
Currently, many pseudocapacitive materials such as transition metal oxides/hydroxides have been widely studied as anode materials for ASCs, owing to their high pseudocapacitance and energy densities.19–22 Among these metal oxides, NiO is one of the most promising positive pole materials in ASC applications because of its high theoretical specific capacitance (3750 F g−1 within 0.5 V), low cost, structural stability and easy synthesis.23–25 Additionally, NiO-based composites are widely used in some other fields, such as Li-ion batteries and supercapacitors, etc.26–29 Nonetheless, like other transition metal oxides, the poor electronic conductivity and low cycle life of NiO reduce its power performance. An effective way to address this issue is to incorporate nano-sized NiO into electrically conductive frameworks, such as carbon-based materials, to form a NiO-conductive framework core–shell structure.30–33 Among these frameworks, CNTs are considered as the most attractive candidate owing to their large surface area, excellent conductivity, good cycle stability and high mechanical strength.34–36 Based on this analysis, CNT-supported NiO hybrids can be used as the anode; however, it is still difficult to directly grow ultrathin and quality NiO nanosheets on CNTs via a cost-effective method.
Graphene-based materials have become the most promising cathode materials for asymmetric supercapacitors due to their large surface area and high electrical conductivity.37–40 However, graphene-based materials usually suffer from limited specific capacitance, leading to relatively low energy density in supercapacitors. Utilizing graphene-based materials with optimized pore structure has been proven to be a good approach for improving capacitive performance to obtain ASCs with high energy density.41–43 To address this issue, the synthesis of defect-introduced graphene sheets (DGNs) with hole structure has attracted increasing attention because of their facile preparation procedures, large surface area, and unique porous structures. Most of the patterning strategies employed, such as electro plasma etching, post-activation processes and lithography, often involve high temperature processing and dangerous gases, which are not cost efficient or suitable for large scale preparation.44–47 Carbon gasification, catalyzed by metallic and oxide particles in a controlled atmosphere, has been demonstrated to be a facile and efficient method.48 Based on their highly uniform porosity compared to many other porous carbon materials, DGNs exhibit enhanced electrochemical performance and high-rate capability in asymmetric supercapacitor applications.
Herein, we report a facile and cost-effective cobalt catalyzed gasification strategy to prepare defect-introduced graphene sheets with hole structure. The prepared DGN electrode displays a significantly enhanced specific capacitance (256 F g−1 at 1 A g−1), which is higher than most of the previously reported carbon-based material electrodes. The preparation of hierarchical carbon nanotubes@NiO core–shell hybrids through a chemical bath deposition process with thermal annealing is also reported. Furthermore, our optimized ASC device comprising hierarchical carbon nanotubes@NiO core–shell nanosheets as the anode and defect-introduced graphene sheets with hole structure as the cathode was successfully fabricated for the first time. The device exhibits remarkable electrochemical performance with a maximum energy density of 38.1 W h kg−1 at a power density of 500 W kg−1 and good cycling stability (94% capacitance retention after 10![[thin space (1/6-em)]](https://www.rsc.org/images/entities/char_2009.gif) 000 cycles) at a wide operational voltage of 1.6 V. These results indicate that transition metal oxides/hydroxides and porous graphene are promising candidates for next-generation energy-storage devices with excellent electrochemical properties.
000 cycles) at a wide operational voltage of 1.6 V. These results indicate that transition metal oxides/hydroxides and porous graphene are promising candidates for next-generation energy-storage devices with excellent electrochemical properties.
2. Experimental section
2.1. Synthesis of hierarchical carbon nanotubes@NiO core–shell nanosheets
To make CNTs more dispersible in deionized water, 1.5 g of CNTs was refluxed in HNO3 (6 M, 100 mL) at 85 °C for 3 h, followed by washing with copious amounts of deionized water and ethanol. Then the precursor CNTs were dried at 60 °C overnight for further use. Hierarchical CNT@NiO core–shell nanosheets were then synthesized using chemical bath deposition combined with thermal annealing. Typically, 0.5 g of the treated CNTs were added into a 200 mL solution containing 14.5 g of NiO(NO3)2·6H2O and 60 g of urea and the solution was ultra-sonically agitated to form a homogeneous suspension. The mixture was then heated in an oil bath at 90 °C for 3 h with stirring, and then the precipitate was cooled down to room temperature and aged for another 12 h naturally. The initial product was collected via filtration and washed with ethanol and deionized water several times with the assistance of a centrifuge, and was then dried in air at 60 °C for 12 h. Finally, the precursors were converted into CNT@NiO composites via thermal annealing at 350 °C for 2 h with a slow heating rate of 1 °C min−1. For comparison, the bare NiO powder was also prepared using the same procedure as described above without CNTs.2.2. Preparation of defect-introduced graphene sheets (DGNs) with hole structure
Graphene was manufactured via the hydrothermal reduction of graphene oxide (GO) in the presence of L-ascorbic acid. The oxidation of graphite powder (GP) to GO was achieved through a modified Hummers' method. In a typical process, 50 mg of as-prepared GO and 100 mg of L-ascorbic acid were diffused in 40 mL deionized water with ultra-sonic agitation for 40 min. The mixture was transferred into a 50 mL Teflon autoclave and heated in a muffle furnace at 180 °C for 8 h. The product was washed with deionized water and ethanol, and then dried using lyophilization in order to obtain non-agglomerated graphene powder. The processed graphene sheets (GNs) were impregnated with 10 wt% Co by dispersion in ethanol and blending fully with stirring. Then, the as-prepared Co/GNs underwent oxidation in air at 300 °C for 25 min. To obtain the pure DGNs, cobalt was removed in a boiling concentrated nitric acid solution for 50 minutes. Finally, the resulting precipitate was filtered off, soaked in ethanol and deionized water several times and then dried with lyophilization. Based on the conclusion that the size and density of hole defects are related to the size and mass of Co catalysts, preventing the agglomeration of CoOx particles and controlling the mass of Co catalysts are key in the formation of hole structures.2.3. Characterization methods
The structure and morphologies of the samples were characterized using field emission scanning electron microscopy (FESEM, HITACHI S-4800) and transmission electron microscopy (TEM, JEOL JEM-2010F). High-resolution transmission electron microscopy (HRTEM), energy dispersive X-ray spectroscopy (EDS) mapping and selected area electron diffraction (SAED) patterns were measured on a JEOL 2010F microscope. Powder X-ray diffraction (XRD) patterns were recorded on a BRUKER (Germany) D8 advance diffractometer with Cu-Kα radiation (λ = 0.15406 nm). Raman spectra were obtained under ambient conditions using a Renishaw Invia micro-Raman system with an Ar-ion laser beam of 532 nm. Thermogravimetric analysis (TGA) with a thermogravimetric analyzer was conducted under an air atmosphere at a heating rate of 10 °C min−1 to characterize the quality change. The Brunauer–Emmett–Teller (BET) specific surface area and N2 adsorption–desorption isotherms of the samples were measured at 77 K using an automatic adsorption instrument (LabRAM, HR-Evolution), and the pore size distribution curve was calculated using the Barrett–Joyner–Halenda (BJH) method from the adsorption branch isotherms.2.4. Electrochemical measurements
Working electrodes were prepared by mixing the active materials, carbon black and polytetrafluoroethylene (PTFE), with ethanol in a mass ratio of 80![[thin space (1/6-em)]](https://www.rsc.org/images/entities/char_2009.gif) :
:![[thin space (1/6-em)]](https://www.rsc.org/images/entities/char_2009.gif) 10
10![[thin space (1/6-em)]](https://www.rsc.org/images/entities/char_2009.gif) :
:![[thin space (1/6-em)]](https://www.rsc.org/images/entities/char_2009.gif) 10 to obtain a homogeneous slurry. Then the slurry was pressed (under a pressure of 10 MPa) onto the nickel foam current collector (1 × 1 cm2) and dried at 100 °C for 12 h in a vacuum oven. The masses of active material on the CNT@NiO electrode, NiO electrode, CNT electrode, DGN electrode, and GN electrode were about 0.75 mg, 0.75 mg, 1 mg, 1.5 mg and 1.5 mg, respectively. The electrochemical performances of the individual electrodes were investigated under a three-electrode system, in which platinum foil and a saturated calomel electrode (SCE) were used as the counter and reference electrodes, respectively. During the testing of the optimized asymmetric supercapacitor, the loading mass ratio of the anode material and cathode material (CNT@NiO
10 to obtain a homogeneous slurry. Then the slurry was pressed (under a pressure of 10 MPa) onto the nickel foam current collector (1 × 1 cm2) and dried at 100 °C for 12 h in a vacuum oven. The masses of active material on the CNT@NiO electrode, NiO electrode, CNT electrode, DGN electrode, and GN electrode were about 0.75 mg, 0.75 mg, 1 mg, 1.5 mg and 1.5 mg, respectively. The electrochemical performances of the individual electrodes were investigated under a three-electrode system, in which platinum foil and a saturated calomel electrode (SCE) were used as the counter and reference electrodes, respectively. During the testing of the optimized asymmetric supercapacitor, the loading mass ratio of the anode material and cathode material (CNT@NiO![[thin space (1/6-em)]](https://www.rsc.org/images/entities/char_2009.gif) :
:![[thin space (1/6-em)]](https://www.rsc.org/images/entities/char_2009.gif) DGNs) was estimated to be 0.5, according to their cyclic voltammetry curves and galvanostatic charge–discharge curves (CNT@NiO electrode within 0–0.5 V and DGN electrode within −1–0 V). The CNT@NiO anode and DGN cathode were pressed together and separated by a porous non-woven cloth separator and electrochemical tests on the asymmetric supercapacitor were performed using a two-electrode cell. All of the above electrochemical measurements were obtained at room temperature in freshly prepared 1 M KOH aqueous electrolyte using a CHI 660B electrochemical workstation.
DGNs) was estimated to be 0.5, according to their cyclic voltammetry curves and galvanostatic charge–discharge curves (CNT@NiO electrode within 0–0.5 V and DGN electrode within −1–0 V). The CNT@NiO anode and DGN cathode were pressed together and separated by a porous non-woven cloth separator and electrochemical tests on the asymmetric supercapacitor were performed using a two-electrode cell. All of the above electrochemical measurements were obtained at room temperature in freshly prepared 1 M KOH aqueous electrolyte using a CHI 660B electrochemical workstation.
3. Results and discussion
3.1. Fabrication and characterization of hierarchical CNT@NiO core–shell electrodes
The detailed preparation procedure for the hierarchical CNT@NiO core–shell nanosheets is illustrated schematically in Fig. 1a. Firstly, ultrathin α-Ni(OH)2 nanosheets were grown vertically onto CNTs via chemical bath deposition. Secondly, the CNTs covered with ultrathin α-Ni(OH)2 were annealed to obtain CNT@NiO core–shell nanosheets under an air atmosphere. The morphology and structure of the samples were characterized using FESEM. Fig. 1b and c display the FESEM images of the CNTs under the different magnifications and the CNTs exhibit nanowire structures with a smooth surface and an outer diameter of about 20–60 nm. For the CNT@NiO core–shell hybrids, the NiO nanosheets were uniformly anchored on the surface of the individual CNT in Fig. 1d and e, and their precursor CNT@Ni(OH)2 composites provide the core–shell nanostructure. The interconnections between the NiO nanosheets provide remarkable mechanical strength and form a desirable conductive network not easily separated from the CNT core. Furthermore, the interconnected NiO nanosheets exhibit a highly porous reticulation, which can offer a higher surface area and more active sites related to electrolyte ions. Due to the fact that polymerized micro-sized particles are only present in the bare NiO sample, we can conclude that the CNT shell not only serves as the conductive support for the growth of NiO core, but also prevents the polymerization of NiO.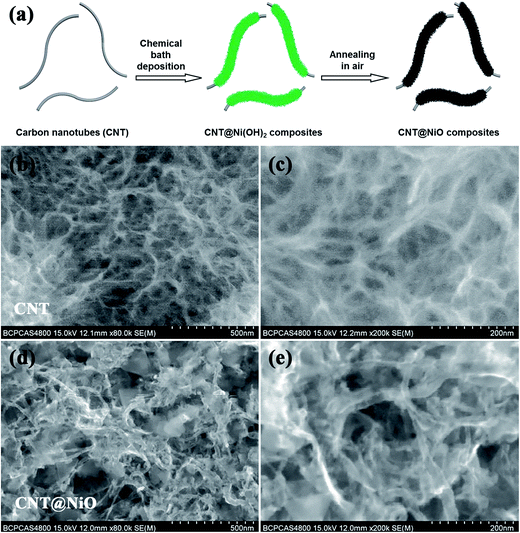 | ||
| Fig. 1 (a) Schematic illustration detailing the preparation of hierarchical CNT@NiO core–shell nanosheets. FESEM images of (b and c) CNT and (d and e) CNT@NiO core–shell composites. | ||
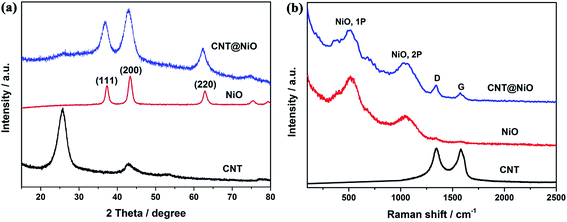
The crystallographic structures and phase information for the samples were investigated using typical XRD measurements. As shown in Fig. 2a, the XRD patterns of the pure NiO and CNT@NiO hybrids show three diffraction peaks located at 2θ = 37.2°, 43.2° and 62.8°, identified as the (111), (200) and (220) planes, respectively, which can be indexed to centered-cubic NiO (JCPDS 43-1477). Obviously, the diffraction graphitic peak at around 26° is also observed in the CNT@NiO composites.49 In addition, compared to bare CNTs, the peaks of the hybrids show weaker diffraction intensity, implying that the NiO nanosheets were successfully decorated onto the CNTs. Furthermore, no visible XRD peaks of α-Ni(OH)2 are observed in the CNT@NiO sample, affirming the complete conversion of Ni–OH into Ni–O during the annealing process. The samples of CNTs, pure NiO and hierarchical CNT@NiO core–shell nanosheets are further confirmed by the Raman spectra shown in Fig. 2b, which display three peaks at about 1343 cm−1 (D-band) and 1577 cm−1 (G-band), along with a peak at 2691 cm−1 (2D-band), implying the existence of CNTs.50 In addition, the pure NiO spectrum shows two broad peaks at around 560 cm−1 and 1062 cm−1, which can be attributed to the first-(1P) and second-order phonon (2P) scattering in NiO.51 All the characteristic peaks of CNTs and NiO can be observed from the CNT@NiO spectrum, confirming that the hybrids are composed of the CNTs and NiO nanosheets.
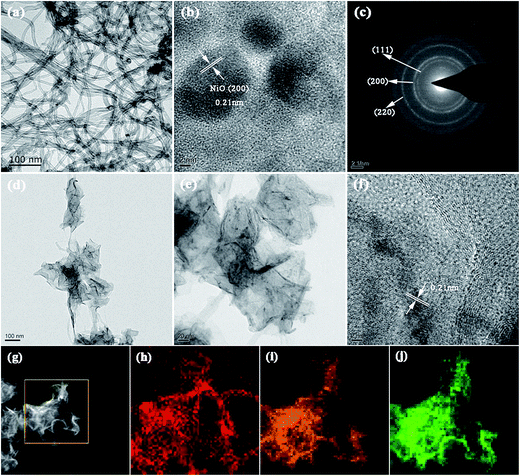
The more detailed morphology and structure of the CNTs, NiO and hierarchical CNT@NiO core–shell compounds were further analyzed using TEM and HRTEM. Fig. 3a shows that CNTs have a hollow tubular morphology feature and an outer diameter ranging between 20 and 60 nm. As shown in Fig. 3b, the HRTEM image of the NiO nanosheets displays a distinct set of clear lattice fringes with interplanar spacings of around 0.21 nm, corresponding to the (200) facet of the face-centered cubic phase of NiO. The selected-area electron diffraction (SAED) pattern (Fig. 3c) shows three intense rings that can be assigned to the (111), (200) and (220) crystal planes of NiO, in agreement with the XRD results. As can be clearly observed in Fig. 3d, the CNT@NiO hybrids exhibit a hierarchical core–shell structure and the surface of the CNTs is covered uniformly by a few layers of NiO shells. The high resolution TEM images (Fig. 3e and f) reveal that the NiO shells have an ultrathin structure, resulting in the full utilization of the active materials and ample exposed surfaces, which is advantageous for achieving excellent supercapacitive performance. In addition, the energy dispersive X-ray spectroscopy (EDS) spectrum (Fig. 3g) further demonstrates the elemental mapping results for the distribution of C, O and Ni elements based on a single CNT@NiO core–shell nanosheet. As shown in Fig. 3h–j, the C, O and Ni elements exhibit a uniform and continuous distribution, corresponding to the hierarchical core–shell structure of the CNT@NiO composite. This reveals that the surfaces of the CNTs were successfully coated by NiO sheets, resulting in greatly shortened transport paths for both ions and electrons, which is beneficial for achieving a high rate capability.52
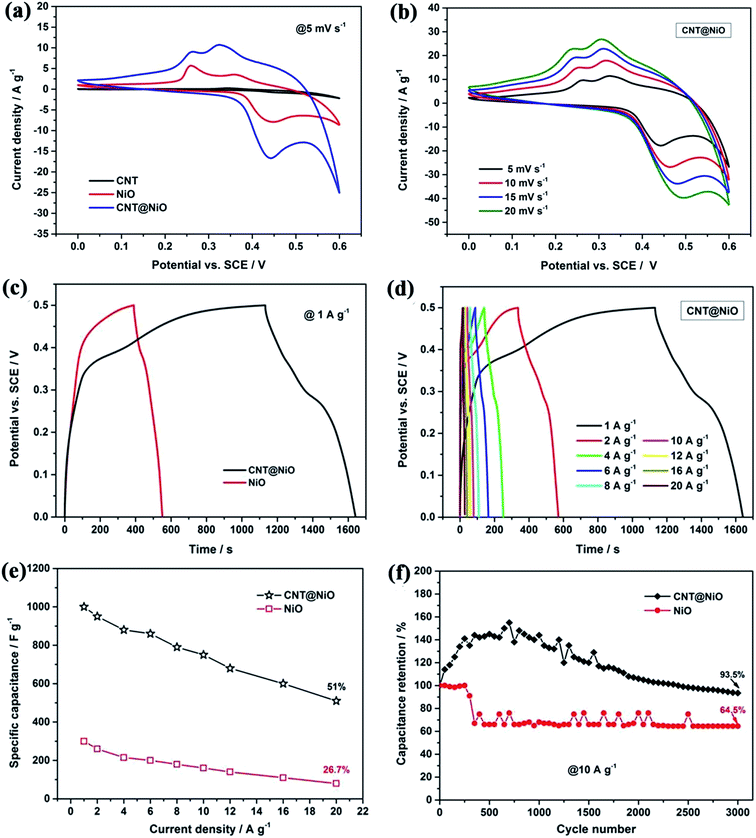
To test the electrochemical properties of the hierarchical CNT@NiO core–shell nanosheet electrodes, cyclic voltammetry (CV) and galvanostatic charge–discharge (GCD) techniques were applied, using a three-electrode configuration in 1 M KOH aqueous electrolyte. Fig. 4a compares the CV curves of the CNT, pure NiO, and CNT@NiO electrodes at a scan rate of 5 mV s−1 within a potential range of 0–0.6 V. It can be clearly observed that the CV curves of the pure NiO and CNT@NiO electrodes consist of two strong redox peaks, indicating that the measured capacitance is mainly governed by a redox mechanism described as follows:53–56
| NiO + OH1− ↔ NiOOH + e1−, | (2) |
| C = I × t/(m × ΔV), | (3) |
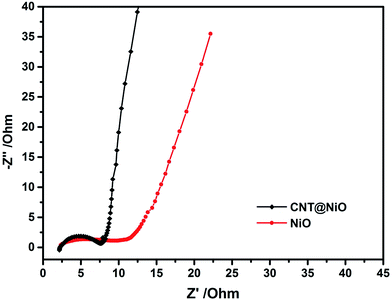
To confirm that the electrical conductivity of NiO can be improved by incorporating the highly conductive frameworks of the CNTs, electrochemical impedance spectroscopy (EIS) experiments were carried out to analyze the NiO and CNT@NiO composite electrodes. Fig. 5 presents Nyquist plots, where the almost semicircular curve in the high frequency region is assigned to the interfacial charge-transfer resistance (Rct), while the linear part in the low frequency region refers to the Warburg resistance (Wd), which represents the diffusion of ions in the electrolyte.59 It can be observed that the radius of the semicircle for the CNT@NiO composites is much smaller than that of NiO and the slope of the line for the CNT@NiO compounds is much greater than that of NiO, revealing a lower diffusion resistance (Rct of NiO and CNT@NiO composite electrodes are 11.5 Ω and 7 Ω, respectively) and a better capacitor behavior. Due to the fact that the highly conductive CNTs provide adequate pathways for ions to reach the surface, thereby minimizing the ion diffusion length, the CNT@NiO composites display a better capacitive nature and more efficient charge transfer compared with NiO.
3.2. Fabrication and characterization of negative electrode material
Porous graphene has emerged as a promising material for applications in energy storage devices due to its excellent electrical conductivity, large surface area and appropriate pore structure. Herein, an electrode based on defect-introduced graphene sheets (DGNs) with hole structure was prepared using a facile and efficient cobalt catalyzed gasification strategy conducted at a relatively low temperature.48 Additionally, the prepared porous graphene exhibits ultrahigh specific capacity and good cyclic stability. Fig. 6a shows the fabrication process of the porous DGNs, which is schematically illustrated as a two-step process. The process involves the deposition of cobalt onto the surfaces, and does not result in the occupation of the cavities in the graphene sheets. Cobalt then acts as the oxidation catalyst for the solid-state reaction and catalyzes the formation of hole structures on the exterior surfaces of the graphene sheets. The CoOx nanoparticles are then removed by washing with acid, resulting in the DGNs. Fig. 6b exhibits a typical FESEM image of individual graphene sheets, showing almost transparent carbon nanosheets with a thin, wrinkled structure, which extend outwards with both sides exposed. The FESEM image in Fig. 6c shows that the DGNs have a well-defined porous structure, with an average pore size of about 15 nm and uniform pore size distribution. The phase information and structural changes that occur during the chemical processing in the transformation of original GNs to DGNs can be further characterized using XRD and Raman spectroscopy. As shown in the XRD patterns (Fig. 6d) of graphite powder (GP), graphite oxide (GO) and the DGNs, GP reveals a characteristic peak at 26.54°, which can be assigned to the (002) plane. Due to oxidation, the (002) peak disappears and a new peak at 11.11° identified as the (001) diffraction peak of GO appears. After the heat treatment under a nitrogen atmosphere, the diffraction peak of GO disappears, indicating that GO has been exfoliated to graphene. Meanwhile, the DGNs exhibit the same characteristic peak which all the carbon-based materials possess. Fig. 6e displays the Raman spectra of GNs and DGNs. In the Raman spectra, the peak for the G-band at about 1587 cm−1 due to the doubly degenerated zone center E2g mode, and the peak for the D-band at about 1352 cm−1 characterizing the disordered sp2 graphene are present.50,51 The peak intensity ratio between the two bands (ID/IG) is often considered a measurement of the graphene quality. Obviously, the D/G intensity ratio for the DGNs (ID/IG = 1.11) is stronger than that for the GNs (ID/IG = 0.97), indicating the existence of defect structures in the DGNs which come from the holes on the sidewalls due to the Co catalyzed defect introducing process.57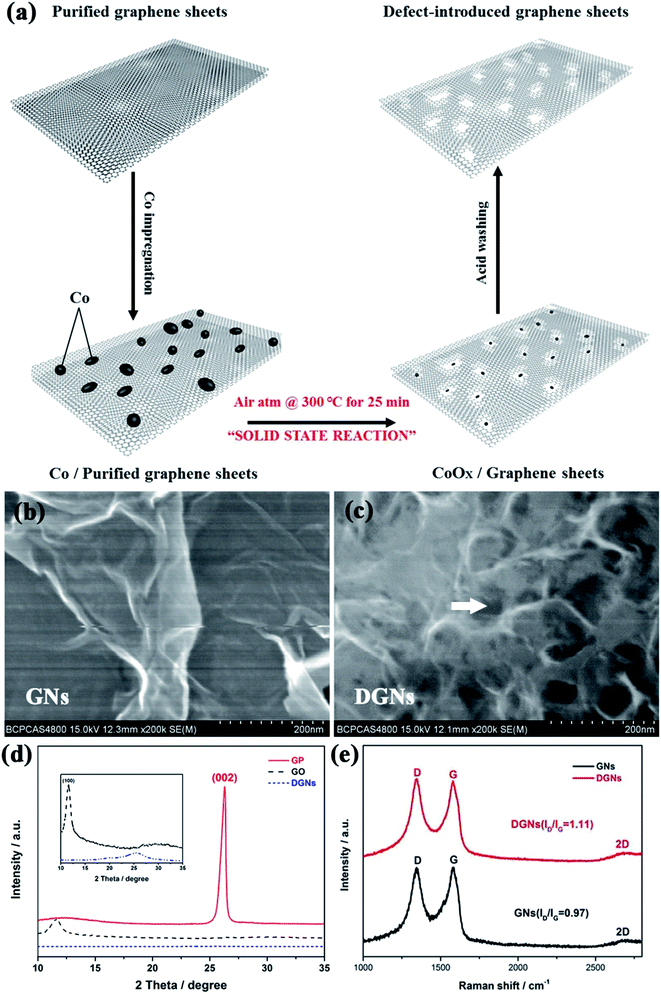 | ||
| Fig. 6 (a) Schematic procedure for drilling DGNs. FESEM images of (b) GNs and (c) DGNs. (d) XRD patterns of GP, GO and DGNs and (e) Raman spectra of GNs and DGNs. | ||
The crystal structure was further determined using TEM. As shown in Fig. 7a, the GNs show a thin wrinkled paper-like curled morphology and the exterior walls of the GNs display hole-free and well-ordered graphitic crystallites. On the contrary, Fig. 7b and c show that hole structures have been introduced on the surfaces of the GNs after the oxidation of the Co/GNs and acid digestion process. The Co/GNs mixture undergo heating in air atmosphere at 300 °C for 25 min to trigger cobalt catalyzed gasification strategy. The magnified TEM image of the DGNs in Fig. 7c clearly displays abundant micro-/mesopores and there are two pivotal factors that affect the defect structure, which control the size and prevent the agglomeration of CoOx particles. The pore structure of the prepared DGNs was analyzed using N2 adsorption–desorption isotherms. As shown in Fig. 7d and e, the isotherm of the GNs (Fig. 7d) is of type II in IUPAC level and has a rapid agglomeration step as the relative pressure approaches unity.60 Additionally, the isotherm of the GNs displays the largest saturated adsorption amount at P/P0 = 1, corresponding to the multilayer filling of large pores, which is responsible for adsorption of a large quantity of N2 at high pressure. In contrast, the isotherm of the prepared DGNs is close to type IV, possessing an obvious hysteresis loop, which indicates the obviously mesoporous character of the sample. The Barrett–Joyner–Halenda (BJH) method was performed to further analyze the porosity and pore size distribution. The inset of Fig. 7d reveals that the GNs have a wide distribution of pore sizes, with average pore sizes of 1.8, 5.3 and 7 nm, revealing a main distribution of micropores. Unlike in the GNs, mesopores with maximum sizes of 14.8, 17.5 and 20 nm are abundantly concentrated in the DGNs, implying that the pore sizes distribution extends to the mesopore-range (inset of Fig. 7e). In view of the above analysis, the BET surface areas of the GNs and DGNs are up to 195 and 456 m2 g−1, and the total pore volume of the GNs and DGNs are up to 0.21 and 0.47 cm3 g−1, respectively.
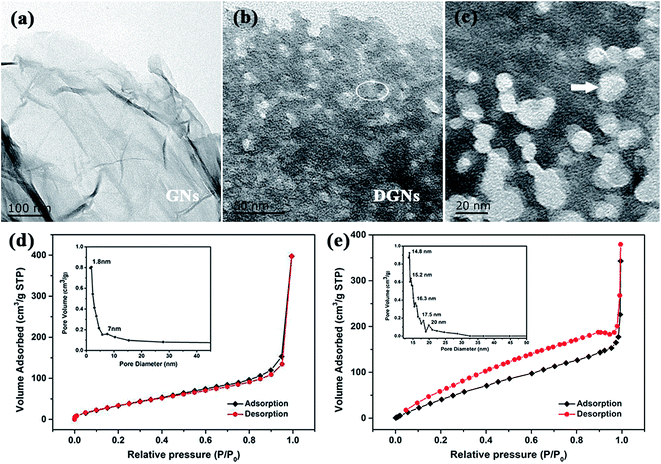 | ||
| Fig. 7 TEM images of (a) GNs and (b and c) DGNs. (c) Magnified TEM image collected from the ringed region in (b). (d and e) N2 adsorption–desorption isotherms of GNs and DGNs. | ||
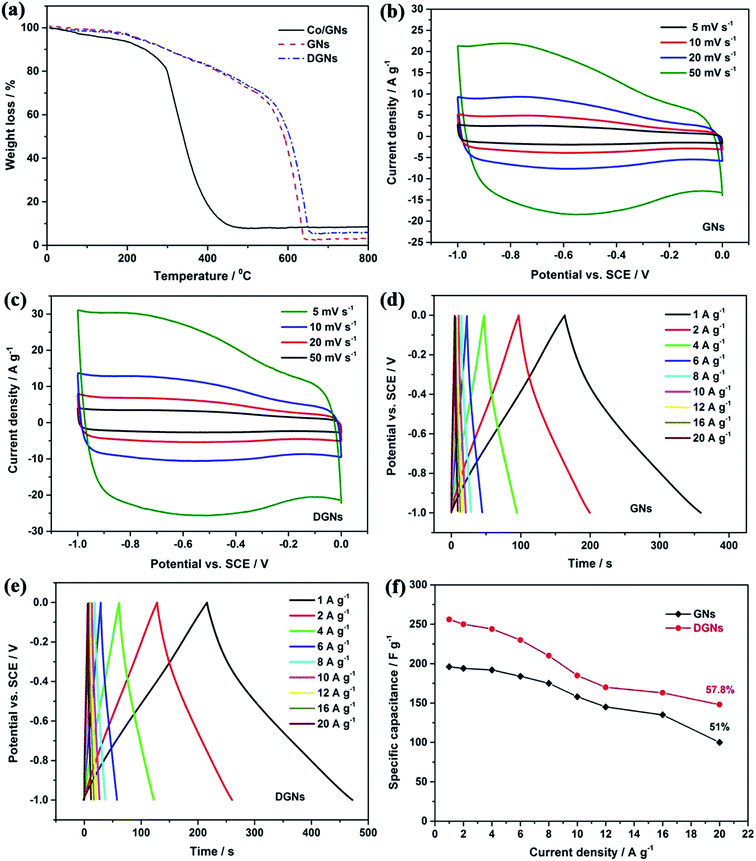
Thermogravimetric analysis (TGA) was employed to determine the oxidation profile of the cobalt-assisted carbon gasification used for defect formation. Fig. 8a shows that each curve has an initial mass loss at a relatively low temperature (<100 °C), owing to the evaporation of physisorbed water. In contrast, the Co/GN mixture exhibits a faster weight loss and is oxidized completely at a lower oxidation temperature than that of the GNs and DGNs. In particular, cobalt oxide catalyzes the oxidation of carbon by offering lattice oxygen and promoting C–O formation to release CO gas.61 The process is as follows:
| 6CoO + O2 → 2Co3O4 | (4) |
| Co3O4 + C → 3CoO + CO, | (5) |
Fig. 8b and c show the comparison of the CV curves of the GN and DGN electrodes at different scan rates ranging from 5 to 50 mV s−1 using 1 M KOH as the electrolyte. It can be clearly observed that the CV curves of the DGN electrode show a larger integral area with an almost rectangular shape, compared with those of the GN electrode at the same scan rate, suggesting that the DGNs possess ideal capacitance and superior charge transport. Typical GCD curves were obtained for the GN and DGN electrodes with a potential range between −1 to 0 V (Fig. 8d and e), in which all the GCD curves are nearly triangular in shape even at an ultrahigh current density of 20 A g−1, indicating good reversibility. In addition, there is no obvious iR drop in any of the curves, revealing a low internal resistance. Fig. 8f displays the specific capacitance of the GN and DGN electrodes at various current densities. Compared with the GN electrode (196 F g−1 at 1 A g−1, 100 F g−1 at 1 A g−1), the DGN electrode shows a higher specific capacitance of 256 F g−1 at 1 A g−1. Even at 20 A g−1, a specific capacitance of 148 F g−1 is still achieved, indicating a more excellent capacitance stability (57.8% retention relative to 1 A g−1). Table 1 summarizes the specific capacitance of previously reported carbon-based material supercapacitor electrodes.62–70 Obviously, the electrochemical performance of our DGN electrode is higher than those of these reported electrodes. Such excellent electrochemical performance can be attributed to the appropriate pore structure, large specific surface area and good electrical conductivity. Through this strategy, the porous structure has shown many merits. Firstly, such a porous structure greatly increases the electrode/electrolyte contact area, resulting in the further enhancement of the capacitive performance. Secondly, the porous structure offers a high packing density, which magnifies the volume energy density of the electrode material. Thirdly, the porous structure provides vast pathways for the electron collection/transport between the overlapping DGN, which is important for the enhancement of the high-rate performance. Thanks to the unique structural features, such as ample mesopore distribution and open flat layers with ultrahigh surface area, the DGN electrode displays excellent kinetic electrochemical capability as well as stable profiles and good reversibility in energy storage cell applications.
| Material | Electrolyte | Specific capacitance (F g−1) | Current density (A g−1) | Ref. |
|---|---|---|---|---|
| NG-900 | 6 M KOH | 130 | 0.5 | 62 |
| aNG | 1 M KOH | 132.4 | 0.1 | 63 |
| TsG | 6 M KOH | 180 | 0.5 | 64 |
| AC800NH3 | 6 M KOH | 196 | 1 | 65 |
| HPCFs | 6 M KOH | 206 | 1 | 66 |
| C-900 | 6 M KOH | 210 | 1 | 67 |
| PANecoal-AC5 | 6 M KOH | 230 | 1 | 68 |
| AC800 | 7 M KOH | 232 | 0.05 | 69 |
| PCPs | 1 M KOH | 245 | 1 | 70 |
| DGNs | 1 M KOH | 256 | 1 | This work |
3.3. Electrochemical performance of the CNT@NiO//DGNs ASC device
To increase the operating voltage and evaluate the electrochemical properties of the prepared samples, an ASC device was constructed using a negative DGN electrode and a positive hierarchical CNT@NiO core–shell nanosheet electrode with one piece of cellulose paper as the separator in 1 M KOH electrolyte. The device is denoted as the CNT@NiO//DGNs ASC device (Fig. 9a). For an ASC, the charge (Q) stored by two electrodes should follow the two equations of| Q+ = Q− | (6) |
| Q = C × ΔV × m | (7) |
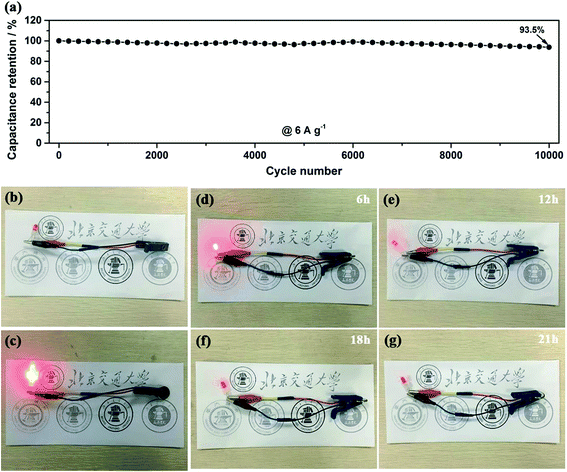
Another important key factor of the ASC device is its cycling performance, as shown in Fig. 10a. Consecutive galvanostatic charge–discharge cycling at a current density of 6 A g−1 for 10![[thin space (1/6-em)]](https://www.rsc.org/images/entities/char_2009.gif) 000 cycles was performed to evaluate the cycling stability. After 10
000 cycles was performed to evaluate the cycling stability. After 10![[thin space (1/6-em)]](https://www.rsc.org/images/entities/char_2009.gif) 000 cycles, 94% of the initial capacitance is still retained and the shape of the GCD curves are not obviously changed, demonstrating a relatively small leakage current and the low self-discharge characteristics of our ASC device. To investigate the practical application of our ASC cell as an efficient power supply, it was applied to light a red-light LED indicator. As shown in Fig. 10b–g, the red LED remains continuously bright for 21 h. All the outstanding electrochemical properties of the device suggest that our electrode materials are suitable for potential applications in high-performance energy storage devices.
000 cycles, 94% of the initial capacitance is still retained and the shape of the GCD curves are not obviously changed, demonstrating a relatively small leakage current and the low self-discharge characteristics of our ASC device. To investigate the practical application of our ASC cell as an efficient power supply, it was applied to light a red-light LED indicator. As shown in Fig. 10b–g, the red LED remains continuously bright for 21 h. All the outstanding electrochemical properties of the device suggest that our electrode materials are suitable for potential applications in high-performance energy storage devices.
4. Conclusions
In this work, hierarchical CNT@NiO core–shell nanosheets were developed via a facile chemical bath deposition method, combined with a thermal annealing approach, and the DGNs with hole structure were synthesized utilizing an efficient cobalt catalyzed gasification process. By taking advantage of the unique nanostructure, the CNT@NiO compound electrode demonstrates ultrahigh specific capacitance (1000 F g−1 at 1 A g−1), superior to the pure NiO electrode, and the DGN electrode exhibits a specific capacitance of up to 256 F g−1 at 1 A g−1. Thanks to the wide voltage window and the high synergistic effects between the two electrodes, an advanced asymmetric supercapacitor based on hierarchical CNT@NiO core–shell nanosheets as the positive electrode and DGNs as the negative electrode was fabricated and tested in a 1.6 V potential window. The CNT@NiO//DGNs ASC device delivers a maximum energy density of 38.1 W h kg−1 and power density of 16![[thin space (1/6-em)]](https://www.rsc.org/images/entities/char_2009.gif) 000 W kg−1, as well as an excellent cycling stability (94% capacitance retention after 10
000 W kg−1, as well as an excellent cycling stability (94% capacitance retention after 10![[thin space (1/6-em)]](https://www.rsc.org/images/entities/char_2009.gif) 000 cycles). Herein, our work provides a novel strategy to construct porous graphene and proves that the CNT@NiO//DGNs ASC device is a promising candidate for energy storage equipment applications. This work should propel the research progress of graphene-based materials as ideal electrode materials for supercapacitors in practical use.
000 cycles). Herein, our work provides a novel strategy to construct porous graphene and proves that the CNT@NiO//DGNs ASC device is a promising candidate for energy storage equipment applications. This work should propel the research progress of graphene-based materials as ideal electrode materials for supercapacitors in practical use.
Acknowledgements
We are grateful for the financial support of the National Basic Research Program (2016YFA0202300, 2016YFA0202302), the National Natural Science Fund Project (under Contract no. 61527817, 61335006, 61378073) and the Beijing Science and Technology Committee (Z151100003315006).References
- A. Balducci, R. Dugas, P. L. Taberna, P. Simon, D. Plée, M. Mastragostino and S. Passerini, J. Power Sources, 2007, 165, 922–927 CrossRef CAS.
- D. A. C. Brownson, D. K. Kampouris and C. E. Banks, J. Power Sources, 2011, 196, 4873–4885 CrossRef CAS.
- C. Du and N. Pan, Nanotechnology, 2006, 17, 5314–5318 CrossRef CAS.
- Z. Hu, X. Xiao, C. Chen, T. Li, L. Huang, C. Zhang, J. Su, L. Miao, J. Jiang, Y. Zhang and J. Zhou, Nano Energy, 2015, 11, 226–234 CrossRef CAS.
- R. Bendi, V. Kumar, V. Bhavanasi, K. Parida and P. S. Lee, Adv. Energy Mater., 2016, 6, 1501833 CrossRef.
- B. E. Conway and W. G. Pell, J. Solid State Electrochem., 2003, 7, 637–644 CrossRef CAS.
- J. Yan, Z. Fan, W. Sun, G. Ning, T. Wei, Q. Zhang, R. Zhang, L. Zhi and F. Wei, Adv. Funct. Mater., 2012, 22, 2632–2641 CrossRef CAS.
- C. Liu, F. Li, L. P. Ma and H. M. Cheng, Adv. Mater., 2010, 22, E28–E62 CrossRef CAS PubMed.
- M. Acerce, D. Voiry and M. Chhowalla, Nat. Nanotechnol., 2015, 10, 313–318 CrossRef CAS PubMed.
- J. J. Yoo, K. Balakrishnan, J. Huang, V. Meunier, B. G. Sumpter, A. Srivastava, M. Conway, A. L. Reddy, J. Yu, R. Vajtai and P. M. Ajayan, Nano Lett., 2011, 11, 1423–1427 CrossRef CAS PubMed.
- S. T. Senthilkumar, Y. Wang and H. Huang, J. Mater. Chem. A, 2015, 3, 20863–20879 CAS.
- Y. Huang, H. Hu, Y. Huang, M. Zhu, W. Meng, C. Liu, Z. Pei, C. Hao, Z. Wang and C. Zhi, ACS Nano, 2015, 9, 4766–4775 CrossRef CAS PubMed.
- H. Gao, F. Xiao, C. B. Ching and H. Duan, ACS Appl. Mater. Interfaces, 2012, 4, 2801–2810 CAS.
- A. Izadi-Najafabadi, S. Yasuda, K. Kobashi, T. Yamada, D. N. Futaba, H. Hatori, M. Yumura, S. Iijima and K. Hata, Adv. Mater., 2010, 22, E235–E241 CrossRef CAS PubMed.
- W. G. Pell and B. E. Conway, J. Power Sources, 2004, 136, 334–345 CrossRef CAS.
- L. Demarconnay, E. Raymundo-Piñero and F. Béguin, J. Power Sources, 2011, 196, 580–586 CrossRef CAS.
- J. Liu, J. Jiang, C. Cheng, H. Li, J. Zhang, H. Gong and H. J. Fan, Adv. Mater., 2011, 23, 2076–2081 CrossRef CAS PubMed.
- M. Yu, Z. Wang, Y. Han, Y. Tong, X. Lu and S. Yang, J. Mater. Chem. A, 2016, 4, 4634–4658 CAS.
- L. Shen, L. Yu, H. B. Wu, X. Y. Yu, X. Zhang and X. W. Lou, Nat. Commun., 2015, 6, 6694 CrossRef CAS PubMed.
- B. Wang, T. Zhu, H. B. Wu, R. Xu, J. S. Chen and X. W. Lou, Nanoscale, 2012, 4, 2145–2149 RSC.
- X. Yu, B. Lu and Z. Xu, Adv. Mater., 2014, 26, 1044–1051 CrossRef CAS PubMed.
- X. H. Xia, J. P. Tu, Y. Q. Zhang, Y. J. Mai, X. L. Wang, C. D. Gu and X. B. Zhao, J. Phys. Chem. C, 2011, 115, 22662–22668 CAS.
- F. Luan, G. Wang, Y. Ling, X. Lu, H. Wang, Y. Tong, X. X. Liu and Y. Li, Nanoscale, 2013, 5, 7984–7990 RSC.
- Z. Yang, F. Xu, W. Zhang, Z. Mei, B. Pei and X. Zhu, J. Power Sources, 2014, 246, 24–31 CrossRef CAS.
- S. I. Kim, J. S. Lee, H. J. Ahn, H. K. Song and J. H. Jang, ACS Appl. Mater. Interfaces, 2013, 5, 1596–1603 CAS.
- Y. Zou and Y. Wang, Nanoscale, 2011, 3, 2615–2620 RSC.
- W. Wen, J.-M. Wu and M.-H. Cao, J. Mater. Chem. A, 2013, 1, 3881 CAS.
- X. Xu, H. Tan, K. Xi, S. Ding, D. Yu, S. Cheng, G. Yang, X. Peng, A. Fakeeh and R. V. Kumar, Carbon, 2015, 84, 491–499 CrossRef CAS.
- X. Xu, J. Liang, H. Zhou, S. Ding and D. Yu, RSC Adv., 2014, 4, 3181–3187 RSC.
- K.-W. Nam, K.-H. Kim, E.-S. Lee, W.-S. Yoon, X.-Q. Yang and K.-B. Kim, J. Power Sources, 2008, 182, 642–652 CrossRef CAS.
- Y. Qian, R. Liu, Q. Wang, J. Xu, D. Chen and G. Shen, J. Mater. Chem. A, 2014, 2, 10917 CAS.
- B. Zhao, J. Song, P. Liu, W. Xu, T. Fang, Z. Jiao, H. Zhang and Y. Jiang, J. Mater. Chem., 2011, 21, 18792 RSC.
- H. Wang, H. Yi, X. Chen and X. Wang, Electrochim. Acta, 2013, 105, 353–361 CrossRef CAS.
- M. F. De Volder, S. H. Tawfick, R. H. Baughman and A. J. Hart, Science, 2013, 339, 535–539 CrossRef CAS PubMed.
- C. de las Casas and W. Li, J. Power Sources, 2012, 208, 74–85 CrossRef CAS.
- J. M. Schnorr and T. M. Swager, Chem. Mater., 2011, 23, 646–657 CrossRef CAS.
- M. D. Stoller and R. S. Ruoff, Energy Environ. Sci., 2010, 3, 1294 CAS.
- C. N. Rao, A. K. Sood, K. S. Subrahmanyam and A. Govindaraj, Angew. Chem., 2009, 48, 7752–7777 CrossRef CAS PubMed.
- Y. Huang, J. Liang and Y. Chen, Small, 2012, 8, 1805–1834 CrossRef CAS PubMed.
- Y. Shao, J. Wang, H. Wu, J. Liu, I. A. Aksay and Y. Lin, Electroanalysis, 2010, 22, 1027–1036 CrossRef CAS.
- X. Ji, K. T. Lee and L. F. Nazar, Nat. Mater., 2009, 8, 500–506 CrossRef CAS PubMed.
- D. S. Jung, T. H. Hwang, J. H. Lee, H. Y. Koo, R. A. Shakoor, R. Kahraman, Y. N. Jo, M. S. Park and J. W. Choi, Nano Lett., 2014, 14, 4418–4425 CrossRef CAS PubMed.
- M. Q. Zhao, Q. Zhang, J. Q. Huang, G. L. Tian, J. Q. Nie, H. J. Peng and F. Wei, Nat. Commun., 2014, 5, 3410 Search PubMed.
- G. Wang, X. Shen, J. Yao and J. Park, Carbon, 2009, 47, 2049–2053 CrossRef CAS.
- S. Pang, H. N. Tsao, X. Feng and K. Müllen, Adv. Mater., 2009, 21, 3488–3491 CrossRef CAS.
- S. C. Eagle and G. K. Fedder, Appl. Phys. Lett., 1999, 74, 3902–3903 CrossRef CAS.
- Z. Chen, Y.-M. Lin, M. J. Rooks and P. Avouris, Phys. E, 2007, 40, 228–232 CrossRef CAS.
- H. S. Oktaviano, K. Yamada and K. Waki, J. Mater. Chem., 2012, 22, 25167 RSC.
- B. Gao, C.-z. Yuan, L.-h. Su, L. Chen and X.-g. Zhang, J. Solid State Electrochem., 2008, 13, 1251–1257 CrossRef.
- A. C. Ferrari, J. C. Meyer, V. Scardaci, C. Casiraghi, M. Lazzeri, F. Mauri, S. Piscanec, D. Jiang, K. S. Novoselov, S. Roth and A. K. Geim, Phys. Rev. Lett., 2006, 97, 187401 CrossRef CAS PubMed.
- H. Wang, H. Yi, X. Chen and X. Wang, J. Mater. Chem. A, 2014, 2, 3223 CAS.
- D. Sun, Q. Zou, Y. Wang, Y. Wang, W. Jiang and F. Li, Nanoscale, 2014, 6, 6557–6562 RSC.
- B. Wang, J. S. Chen, Z. Wang, S. Madhavi and X. W. D. Lou, Adv. Energy Mater., 2012, 2, 1188–1192 CrossRef CAS.
- X. Cao, Y. Shi, W. Shi, G. Lu, X. Huang, Q. Yan, Q. Zhang and H. Zhang, Small, 2011, 7, 3163–3168 CrossRef CAS PubMed.
- K. S. Novoselov, A. K. Geim, S. V. Morozov, D. Jiang, Y. Zhang, S. V. Dubonos, I. V. Grigorieva and A. A. Firsov, Science, 2004, 306, 666–669 CrossRef CAS PubMed.
- J. W. Lee, A. S. Hall, J.-D. Kim and T. E. Mallouk, Chem. Mater., 2012, 24, 1158–1164 CrossRef CAS.
- H.-W. Wang, Z.-A. Hu, Y.-Q. Chang, Y.-L. Chen, H.-Y. Wu, Z.-Y. Zhang and Y.-Y. Yang, J. Mater. Chem., 2011, 21, 10504 RSC.
- X. Zheng, X. Yan, Y. Sun, Z. Bai, G. Zhang, Y. Shen, Q. Liang and Y. Zhang, ACS Appl. Mater. Interfaces, 2015, 7, 2480–2485 CAS.
- D. J. Xue, S. Xin, Y. Yan, K. C. Jiang, Y. X. Yin, Y. G. Guo and L. J. Wan, J. Am. Chem. Soc., 2012, 134, 2512–2515 CrossRef CAS PubMed.
- Z. Li, Z. Pan and S. Dai, J. Colloid Interface Sci., 2004, 277, 35–42 CrossRef CAS PubMed.
- D.-H. Kim and K. Waki, J. Nanosci. Nanotechnol., 2010, 10, 2375–2380 CrossRef CAS PubMed.
- K. H. Lee, J. Oh, J. G. Son, H. Kim and S. S. Lee, ACS Appl. Mater. Interfaces, 2014, 6, 6361–6368 CAS.
- B. Zheng, T.-W. Chen, F.-N. Xiao, W.-J. Bao and X.-H. Xia, J. Solid State Electrochem., 2013, 17, 1809–1814 CrossRef CAS.
- P. Wen, P. Gong, Y. Mi, J. Wang and S. Yang, RSC Adv., 2014, 4, 35914 RSC.
- J. Li, Z. Ren, Y. Ren, L. Zhao, S. Wang and J. Yu, RSC Adv., 2014, 4, 35789 RSC.
- Y. Lv, L. Gan, M. Liu, W. Xiong, Z. Xu, D. Zhu and D. S. Wright, J. Power Sources, 2012, 209, 152–157 CrossRef CAS.
- B. Qiu, C. Pan, W. Qian, Y. Peng, L. Qiu and F. Yan, J. Mater. Chem. A, 2013, 1, 6373 CAS.
- H. Zhao, L. Wang, D. Jia, W. Xia, J. Li and Z. Guo, J. Mater. Chem. A, 2014, 2, 9338 CAS.
- T.-X. Shang, M.-Y. Zhang and X.-J. Jin, RSC Adv., 2014, 4, 39037 RSC.
- H. Yi, H. Wang, Y. Jing, T. Peng and X. Wang, J. Power Sources, 2015, 285, 281–290 CrossRef CAS.
- C. Tang, Z. Tang and H. Gong, J. Electrochem. Soc., 2012, 159, A651 CrossRef CAS.
- H. Wang, C. M. B. Holt, Z. Li, X. Tan, B. S. Amirkhiz, Z. Xu, B. C. Olsen, T. Stephenson and D. Mitlin, Nano Res., 2012, 5, 605–617 CrossRef CAS.
- D.-W. Wang, F. Li and H.-M. Cheng, J. Power Sources, 2008, 185, 1563–1568 CrossRef CAS.
- C. S. Dai, P. Y. Chien, J. Y. Lin, S. W. Chou, W. K. Wu, P. H. Li, K. Y. Wu and T. W. Lin, ACS Appl. Mater. Interfaces, 2013, 5, 12168–12174 CAS.
| This journal is © The Royal Society of Chemistry 2017 |

