 Open Access Article
Creative Commons Attribution 3.0 Unported Licence
Label-free and sensitive detection of microalgae protein using GNRs-based resonance light scattering system
Shuyu Liu *abc,
Lei Tanga,
Jiangli Wangd,
Hanzhuo Fue,
Xia Wanb and
Yunbo Li*a
aSchool of Environment and Chemical Engineering, Shanghai University, Shanghai, 201800, P. R. China. E-mail: liushuyu@shu.edu.cn; Fax: +86-0451-8628-2107; Tel: +86-0451-8628-2107
bKey Laboratory of Biology and Genetic Improvement of Oil Crops, Ministry of Agriculture, P. R. China
cState Key Laboratory of Urban Water Resource and Environment, Harbin Institute of Technology, Harbin 150090, P. R. China
dSchool of Agriculture, Shihezi University, Shihezi City, Xinjiang Uygur Autonomous Region 832003, P. R. China
eUltimate Analysis Laboratory, Boca Raton, FL 33432, USA
First published on 2nd March 2017
Abstract
A novel and label-free gold nanorods (GNRs)-based resonance light scattering system assay has been developed on the basis of that the interactions between microalgae proteins and GNRs could emit strong fluorescence signal. We have prepared GNRs which were well dispersed in the solution and the microalgae protein was absorbed onto the surface of GNRs. The results demonstrated that the intensity of fluorescence has correlation with the protein concentration. The optimum pH was 5.5 and the optimum concentration of inorganic salt ions Na+ was 0.5 mol L−1; the stable time of the reaction system was 2 min. Because of the protein molecules are firmly combined with the surface of the gold particles, a protein layer is formed to prevent the aggregation of gold nanoparticles. Gold nanoparticles have a strong adsorption to proteins and other biological macromolecules and will not change their biological activity, hence it provides a number of advantages. This method offers the advantages of higher sensitivity and selectivity in microalgae protein detection and providing great potential for biology diagnosis.
1. Introduction
Microalgae proteins, as a kind of biological macromolecule, are the material basis of microalgae which constitute the basic organic matter of microalgal cells and the main life activities of microalgae.1 Because of the significance of the microalgae proteins, it is high priority to study the microalgae proteins in clinical medicine and biological chemistry aspects.2,3 A number of conventional detection methods were developed and utilized for microalgae determination, such as Kjeldahl method, Bradford method, spectrometer method, chemical luminescence method and near infrared reflectance spectroscopy. However, these methods suffer from limitations of low sensitivity, poor selectivity or weak stability in different settings.Gold nanoparticles are tiny particles with 1–100 nm in diameter. As a new type of biological molecule probe, gold nanoparticles are simple and stable. Thus, it has been extensively studied and applied4,5 in different shapes and geometries such as spherical particles, nanorods, nanoshells, nanostars and nanocages.6–11 The optical properties are strongly dependent on their shape and size.12–14 As one of the earliest studies on metal nano materials and their stability, strong and stable surface plasma resonance absorption peak appearing in the UV-visible region was utilized.15 The gold nanoparticles were used in electron microscopy for the first time in 1971.16 GNRs exhibit in two SPR bands with the transverse band around 520–600 nm and the longitudinal band in the near IR region, with the exact wavelength tunable by controlling the aspect ratio of the nanorods.17 Because of their near IR SPR band, GNRs are considered as more promising than solid spherical nanoparticles for in vivo bio-medical applications.
Currently more studies focused on the biological probe of the gold nanoparticles. Because of its quantum effect, macroscopic quantum tunneling effect, surface effect, good bio-compatibility and unique optical properties, it can be combined with many kinds of biological macromolecules such as nucleic acid,16,18,19 heavy metal ions20,21 especially protein.22,23 Chang et al. detected a series with thiol compounds, including intracellular bioactive molecules such as cysteine and glutathione, and the positioning of the erythrocyte glutathione basing on interaction between gold and Nile red dye as a fluorescence.24–26 Meanwhile, the strength of interaction between gold nanoparticles and the elements such as nitrogen, sulfur in some groups of compounds to detect some heavy metal ions such as Cu2+, Hg2+.27,28 Dobrovalskaia et al. conducted a systematic study on blood plasma protein adsorption to citrate-protected gold nanoparticles and identified about 60 different proteins in the “protein corona” formed on the gold nanoparticle surface.29 The local electric field enhancement of the surface of metallic nanoparticles in visible light and near infrared light is caused by the plasma resonance of several orders of magnitude of the incident electric field changes. The GNRs have a strong plasma enhancement effect in the range of 600–1500 nm.30,31
Most of the proteins contain fluorescent amino acids, tryptophan and tyrosine. When the fluorescent tryptophan or tyrosine interacts with gold nanoparticles, the fluorescence properties of tryptophan or tyrosine will shift.29,32,33 These changes can occur as emission wavelength red-shift or blue-shift, fluorescence quenching or enhancement. Such changes have been applied to determine the binding affinity and binding constant of proteins with gold nanoparticles quantitatively. Proteins and gold nanoparticles are formed by the electrostatic attraction and hydrophobic force, which give the system a characteristic of fluorescence scattering peak that enhancing the fluorescence scattering signal of the associated nanoparticle. On the basis of the linear relationship between the fluorescence intensity and the concentration of proteins, a new method for protein determination was established. In this study, a simple, sensitive and stable method based on the combination of GNRs with the microalgae protein was explored for the microalgae protein analysis; the related pH condition was determined as well. The salt ions Na+ and the stable time of the reaction system was also examined. A number of parameters affecting the fluorescence intensity were studied and experimental sensitivity were examined. The results demonstrated a higher sensitivity and selectivity in microalgae protein detection and a great potential for biology diagnosis can be brought by this method.
2. Material and methods
Chemicals and materials
The microalgae proteins were extracted from Microcystis aeruginosa (FACHB 905) culture which obtained from the Freshwater Algae Culture Collection of the Institute of Hydrobiology (Chinese Academy of Sciences, Wuhan, China), hexadecyltrimethylammonium bromide (CTAB), sodium citrate, sodium oleate, HAuCl4·4H2O, silver nitrate, sodium borohydride, L-ascorbic acid (BioUltra) and hydrochloric acid were all obtained from SinopHarm Chemical Reagent Co., Ltd. (China).Apparatus
Fluorescence spectra were obtained from fluorescence spectro-fluorometer (SHIMADZU-5301, Japan). Transmission electron microscopy (TEM) measurements were made on an electron microscope (JEOL-200CX, Hitachi) equipped with a camera (Model GATAN782CCD, USA) at an operating voltage of 120 kV. The samples for TEM studies were prepared by placing one droplet of the sample deposited onto carbon-coated copper grids.Synthesis of GNRs
Gold nanorods were synthesized by utilizing seed-growing method.34 First, the seed solution was prepared for gold NR growth: 5 mL of 0.2 M CTAB solution was added to a 20 mL scintillation vial and 5 mL of 0.5 mM HAuCl4 was mixed with the solution, 0.6 mL of fresh 0.01 M NaBH4 was diluted to 1 mL with ultrapure water and was a trickle to join in the mixture under vigorous stirring (1200 rpm) for 2 min. The seed solution was kept for 30 min at room temperature. Next, the growth solution was prepared: 2.25 g of CTAB and 0.31 g of sodium oleate (NaOL) were dissolved in 62.5 mL of ultrapure water under vigorous stirring for 5 min, and the mixture was left undisturbed to cool down to 30 °C, then 4.5 mL of 4.0 mM AgNO3 solution and 62.5 mL of 1 mM HAuCl4 were added into the mixture and the solution was kept at 30 °C for 15 min, then the solution was stirred for 90 min and became colorless. Then 0.53 mL of 12.1 M HCl was dropwise into the growth solution. After stirring 15 min at 400 rpm, 0.31 mL of 0.064 M ascorbic acid (AA) was added into the solution stirred about 30 s. Finally, 0.1 mL of seed solution was injected into the growth solution. The resultant solution was vigorously stirred for 30 s and kept undisturbed at 30 °C for 12 h for gold NR growth. The size and shape of GNRs were characterized by JEOL-200CX transmission electron microscopy (TEM).The extraction and preparation of Microcystis aeruginosa protein solution
Protein extraction from Microcystis aeruginosa: first, the sludge was milled into powder by liquid nitrogen, and the powder was suspended in four times volume of acetone with 2 mmol L−1 DTT and 10% TCA, followed by precipitation for 2 h at −20 °C. Next, the solution was separated with the speed of 9000 rpm for 15 min at 4 °C, precipitation was suspended in acetone with 2 mmol L−1 DTT for 2 h at −20 °C, followed by centrifugal separation for 15 min at 9000 rpm. The supernatant was discarded. Repeat the above steps for several times to extract enough materials. Microcystis aeruginosa protein can be obtained by the precipitation of the vacuum freeze drying.Preparation of Microcystis aeruginosa protein solution: aqueous stock solution of Microcystis aeruginosa protein was achieved in a standardized way in water at room temperature and by magnetic stirring for 24 h and stored in the refrigerator. Reaction system was prepared by utilizing the protein solutions and dilution it into seven 10 mL volumetric flasks with 2 mL, 2.5 mL, 3 mL, 3.5 mL, 4 mL, 4.5 mL and 5 mL, respectively. Then 5 mL GNRs solutions were added into each flask, and bring the volume to 10 mL with distilled water. The solutions were stirred on magnetic stirrer followed by static mode for 10 min. The solutions were centrifuged and unreacted GNRs and protein residues were removed. The solutions were ready for fluorescence intensity detection. The pH value was adjusted with minute amounts of aqueous HCl (0.1 mol L−1) or NaOH (0.1 mol L−1) solutions, respectively.
3. Results and discussion
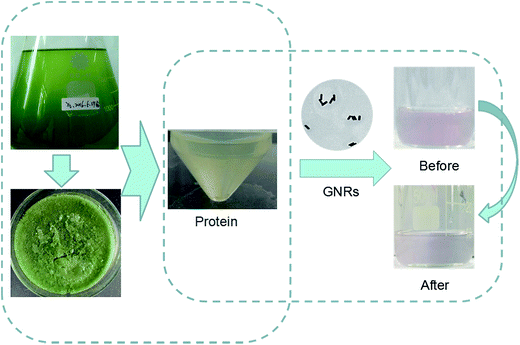
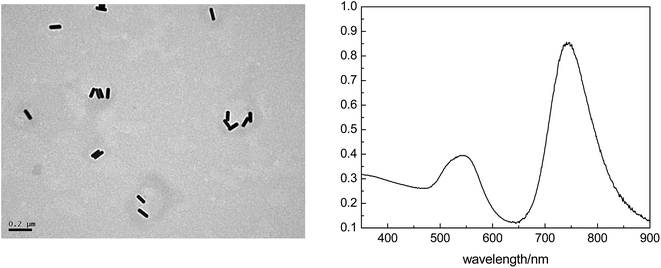
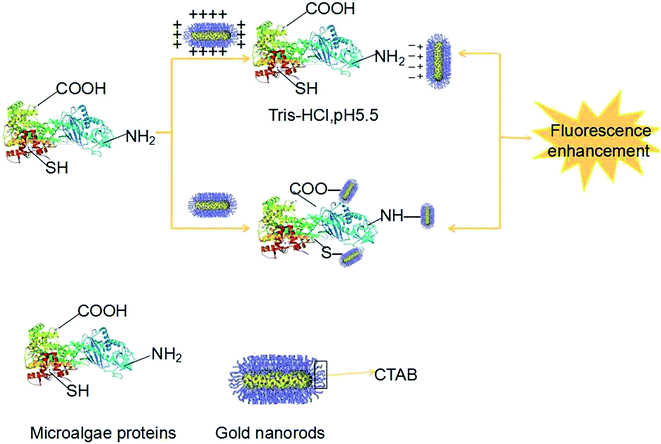
The mainly mechanism for the protein combining with the nanoparticles was shown in Fig. 1. The color of the reaction solution remained degraded pink after addition the algae protein. The protein structure containing inner base causes a strong repulsion between protein-groups and GNRs. The lack of protection of adsorbed groups makes GNPs susceptible to aggregation, thus inducing color change of GNRs from the original pink to a degraded level.Transmission electron microscopy (TEM) and ultraviolet absorption spectra of GNRs (UV-vis) are shown below. It can be seen its rod shape and the size is about 0.1 μm of GNR (Fig. 2).
The analysis of the interaction between Microcystis aeruginosa protein and GNRs
Fig. 3 illustrates the fluorescence spectra of the interactions between different concentrations of Microcystis aeruginosa proteins and GNRs. The fluorescence intensity was significantly enhanced with the increasement of Microcystis aeruginosa protein concentration and peak intensity at 560 nm in the system. Localized surface plasmon resonance (LSPR) of GNRs can produce a localized field enhancement effect except for GNRs with fluorescence.35,36 Hydrogen bonds exist between the amino groups, carboxyl groups and thiol groups in GNRs and Microcystis aeruginosa proteins.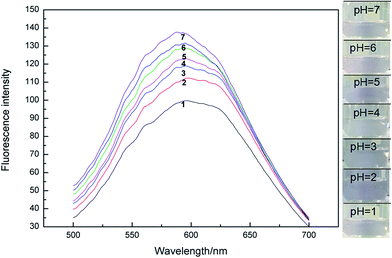 | ||
| Fig. 3 Fluorescence spectra of interactions between different concentrations of Microcystis aeruginosa protein and GNRs. | ||
On the one hand, the surface plasmon resonance of gold nanoparticles was changed, the incident light and the surface plasmon resonance of the gold nanoparticles absorb the same wavelength as the resonance frequency, and thus the characteristic absorption spectra was formed. The fluorescence enhancement includes the excitation and the emission enhancement. When the wavelength of the plasmon resonance wavelength was closed to the protein molecules, the emission intensity is enhanced and maximum the fluorescence enhancement. Ming et al. reported on the strong polarization dependence of the plasmon-enhanced fluorescence on single GNRs. The fluorescence from the organic fluorophores which embedded in a mesostructured silica shell around individual GNRs is enhanced by the longitudinal plasmon resonance of the nanorods. When the longitudinal plasmon wavelength and the excitation wavelength of the GNRs are almost equal, the fluorescence enhancement reaches the maximum value.37 On the other hand, the covering layer of GNRs was formed on the surface of the Microcystis aeruginosa protein, which is much larger than that of aggregation of the GNRs. The Raman scattering signals and the interaction between GNRs and Microcystis aeruginosa proteins was enhanced. The result is demonstrated by Qin Long et al.38,39 that the higher the concentration of protein or amino acid, the stronger the signal intensity.
Optimization of experimental conditions for fluorescence detection
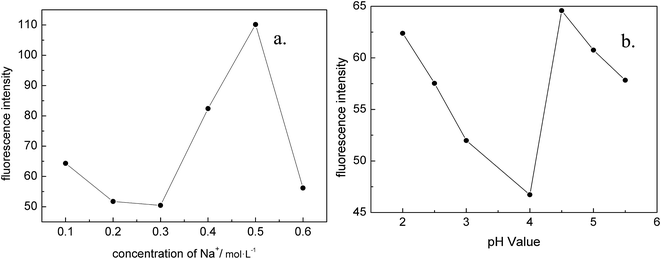
Based on the principles, there are two main factors that affect the experiment: pH value and the concentration of inorganic salt ion. To further understand the optimal experimental conditions, two approaches were developed for the analysis.In the strategy 1: we studied the effect of pH on fluorescence intensity (Fig. 4a). In the pH range of 2.0–4.0, the fluorescence intensity decreased while the pH value increased. Specifically, when pH increased from 4.0 to 4.5, the fluorescence intensity increased; when pH increased from 4.5 to 5.5, the fluorescence intensity decreased to the minimum value. At pH 4.5, the most sensitive response was obtained and the fluorescence intensity reached its maximum value.
When the pH is low, the Microcystis aeruginosa protein molecules partially deformed and the fluorescence intensity was decreased. The Microcystis aeruginosa proteins are the amphoteric electrolyte with isoelectric points, thus the pH of the solutions can change the solubility of the protein. With the increase of pH to 4.5 in the solution, the GNRs and Microcystis aeruginosa proteins have strong interactions, and the fluorescence intensity was enhanced. However, in the work presented by Yuyun Zhao et al.,40 a strong interaction between gold nanoparticles were stabilized by sodium citrate and electric point greater than 7 of the protein in pH 7.4 solution, and the solution appears color change or coagulation flocculation phenomenon.40 In our work, there is no similar phenomenon, the possible reason may be the pH value of the solution in this paper is less than 7 and the different structure of the protein.
In the strategy 2: we studied the effect of inorganic salt ion concentration on fluorescence intensity. When the concentration of Na+ was 0.1–0.3 mol L−1, the fluorescence intensity changed little. When the concentration of Na+ was 0.3–0.5 mol L−1, the fluorescence intensity was obviously enhanced, and the most sensitive response appears at 0.5 mol L. When the concentration of Na+ was above 0.5 mol L−1, the intensity of fluorescence was decreased. It can be concluded that the optimal concentration of Na+ was 0.5 mol L−1 as illustrated in Fig. 4b. This result was consist with the experimental studies by Pylaev T. E.41 and Javad Hassanzadeh.42 The interference of Na+, k+, Ca2+, Ag+, Mg2+, Zn2+, Cu2+, Fe3+, Mn2+ were explored. The amounts of most potentially interfering species in serum are below their tolerable levels or can be decreased with diluting, so there would be no interferences from these species in Microcystis aeruginosa protein determination.
Sensitivity of experiments
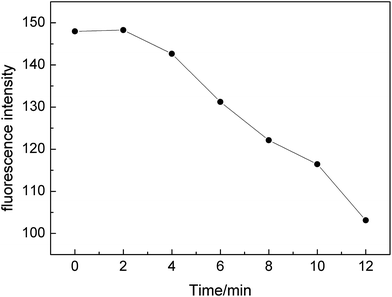
The fluorescence intensity of the system reached the maximum in 0–2 min, the combination of the GNRs and the Microcystis aeruginosa proteins was the highest. Subsequently, the fluorescence intensity gradually decreased in 2–12 min (Fig. 5). Sensitivity of the experiments have been examined in terms of detection limit and linear dynamic range. It is found that at the range of 5 to 10, the method exhibited linear gradient change of fluorescence intensity.It is probably bound to facets at the end of GNRs via complex formation between its indole groups and empty orbitals on these facets about the combination of the GNRs and the Microcystis aeruginosa proteins was decreased. In the experimental study of Javad Hassanzadeh,42 the adsorption of albumin on the GNRs active surfaces inhibits their catalytic action and decreases fluorescence signal. But this result is not consistent with the experimental results of Wu Menghui43 and Jolanda Spadavecchia44 using bovine serum protein (BSA), which may be due to differences in the structure of different proteins, resulting in differences in measurement results.45–48
Discussion
The interactions between gold nanoparticles and proteins are due to the surface of the gold nanoparticles with more charges (Fig. 6). When the protein is equal to or slightly greater than the isoelectric point of protein in pH, the protein is neutral and the electrostatic interaction between protein and gold nanoparticles is small. However, the surface tension of protein molecules is very large in a weak hydration state, which is more easily adsorbed on the surface of gold nanoparticles.Because of the protein molecules are firmly combined with the surface of the gold particles, a protein layer is formed to prevent the aggregation of gold nanoparticles. Gold nanoparticles have a strong adsorption to proteins and other biological macromolecules and will not change their biological activity, hence it has a good application prospect.
4. Conclusion
The present work has demonstrated that the combination of GNRs and proteins in Microcystis aeruginosa can enhance the fluorescence intensity with the increase of concentration of algae proteins. The mechanism involved in the formation of hydrogen bonds between the amino groups and carboxyl groups of the GNRs and the algae proteins which changed the surface plasmon resonance luminescence properties. When the GNRs were combined with Microcystis aeruginosa proteins, the size of the polymers was much larger than that of the nanorods, which greatly enhanced the fluorescence intensity. This nanoparticle method has exhibited a high precision, sensitivity approach for the algal protein determination.Abbreviations
| GNRs | Gold nanorods |
| LSPR | Localized surface plasmon resonance |
| IR | Infrared |
| DTT | DL-Dithiothreitol |
Acknowledgements
This work was supported by Open Project of State Key Laboratory of Urban Water Resource and Environment (No. ESK201601) and National Natural Science Foundation of China (No. 50809037, 41430644, 41273126), the special S&T project on treatment and control of water pollution (No. 2012ZX07201-003), and Innovative Research Team in University (No. IRT13078). Science and Technology Commission of Shanghai Municipality (No. 13230500600).References
- A. Right, The structure and function of protein, Higher Education Press, 1982, pp. 1–5 Search PubMed.
- C. Zhenzhen, Z. Ning and Z. Wenshen, et.al., Research and application of protein molecular fluorescence probes, Chin. J. Anal. Chem., 2006, 34(9), 1341–1347 Search PubMed.
- F. Suling, W. Jin and F. Jing, Resonance light scattering method for the determination of proteins with Titan yellow, Spectrosc. Spectral Anal., 2005, 25(6), 927–929 Search PubMed.
- C. M. Welch and R. G. Compton, The use of nanoparticles in electroanalysis: a review, Anal. Bioanal. Chem., 2006, 384, 601–619 CrossRef CAS PubMed.
- V. I. Roldughin, Quantum-size colloid metal systems, Russ. Chem. Rev., 2000, 69(10), 821–843 CrossRef CAS.
- R. J. Newhouse and J. Z. Zhang, Optical properties and applications of shape-controlled metal nanostructures, Reviews in Plasmonics 2010, Springer, New York, 2012, pp. 205–238 Search PubMed.
- J. Chen, F. Saeki, B. J. Wiley, H. Cang, M. J. Cobb, Z.-Y. Li, L. Au, H. Zhang, M. B. Kimmey, X. Li and Y. Xia, Gold nanocages: bioconjugation and their potential use as optical imaging contrast agents, Nano Lett., 2005, 5(3), 473–477 CrossRef CAS PubMed.
- M. Hu, J. Chen, Z. Li, L. Au, G. V. Hartland, X. Li, M. Marquez and Y. Xia, Gold nanostructures: engineering their plasmonic properties for biomedical applications, Chem. Soc. Rev., 2006, 35, 1084–1094 RSC.
- Y. Sun and Y. Xia, Gold and silver nanoparticles: a class of chromophores with colors tunable in the range from 400 to 750 nm, Analyst, 2003, 128, 686–691 RSC.
- N. J. Halas, S. Lal, W. Chang, S. Link and P. Nordlander, Plasmons in strongly coupled nanostructures, Chem. Rev., 2011, 111, 3913–3963 CrossRef CAS PubMed.
- H. Wang, D. Brandl, P. Nordlander and N. J. Halas, Plasmonic nanostructures: artificial molecules, Acc. Chem. Res., 2006, 40, 53–62 CrossRef PubMed.
- P. K. Jain, K. S. Lee, I. H. El-Sayed and M. A. El-Sayed, Calculated absorption and scattering properties of gold nanoparticles of different size, shape, and composition: applications in biological imaging and biomedicine, J. Phys. Chem. B, 2006, 110, 7238–7248 CrossRef CAS PubMed.
- C. L. Nehl, H. Liao and J. H. Hafner, Optical properties of star shaped gold nanoparticles, Nano Lett., 2006, 6, 683–688 CrossRef CAS PubMed.
- S. Link, M. B. Mohamed and M. A. El-Sayed, Simulation of the optical absorption spectra of GNRs as a function of their aspect ratio and the effect of the medium dielectric constant, J. Phys. Chem. B, 1999, 103, 3073–3077 CrossRef CAS.
- M. C. Daniel and D. Astruc, Gold Nanoparticles: Assembly, Supramolecular Chemistry, Quantum-Size-Related Properties, and Applications toward Biology, Catalysis, and Nanotechnology, Chem. Rev., 2004, 104(1), 293–346 CrossRef CAS PubMed.
- R. Markus, D. Heiko and R. U. Janicke, et al., Single-cell fluorescence resonance energy transfer analysis demonstrates that caspase activation during apoptosis is a rapid process. Role of caspase-3, J. Biol. Chem., 2002, 277(27), 24506–24514 CrossRef PubMed.
- J. Storhoff, A. Lazarides, C. Mirkin and G. Schatz, What Controls the Optical Properties of DNA-Linked Gold Nanoparticle Assemblies?, J. Am. Chem. Soc., 2000, 122(19), 4640–4650 CrossRef CAS.
- C. Mirkin, R. Letsinger, R. Mucic and J. Storhoff, A DNA-based method for rationally assembling nanoparticles into macroscope materials, Nature, 1996, 382(6592), 607–609 CrossRef CAS PubMed.
- R. Elghanian, J. Storhoff, R. Mucic, R. Letsinger and C. Mirkin, Selective colorimetric detection of polynucleotides based on the distance-dependent optical properties of gold nanoparticles, Science, 1997, 277(5329), 1078–1081 CrossRef CAS PubMed.
- Y. Chuanxiao, Y. f. g. Li, F. Ping and H. Chengzhi, Study on the Interaction of Aluminum Ion with Deoxyribonucleic Acid by Resonance Light Scattering Measurement, Anal. Chem., 2002, 30, 473–477 Search PubMed.
- Y. M. Hao and H. X. Shen, Spectrophotometric determination of nucleic acids using palladium(II) complex with 2-(5-bromo-2-pyridylazo)-5-diethylaminophenol, Anal. Chim. Acta, 2000, 413(1–2), 87–94 CrossRef CAS.
- Y. Gang, Study on the interaction between spectral probe and biological active substance – reaction mechanism, application and preparation, Peking University, 2000 Search PubMed.
- L. U. Shen, S. Wang and W. Chang, Application of Colloidal Gold on Immunoassay, J. Wuhan Univ., 2000, 46(4), 393–399 Search PubMed.
- S. J. Chen and H. T. Chang, Nile Red-Adsorbed Gold Nanoparticles for Selective Determination of Thiols Based on Energy Transfer and Aggregation, Anal. Chem., 2004, 76(13), 3727–3734 CrossRef CAS PubMed.
- W. L. Tseng, J. S. Lee and H. T. Chang, Using Nile red adsorbed gold nanoparticles to locate glutathione within erythrocytes, Langmuir, 2005, 21(23), 10676–10683 CrossRef CAS PubMed.
- Y. F. Huang and H. T. Chang, Nile Red-Adsorbed Gold Nanoparticle Matrixes for Determining Aminothiols through Surface-Assisted Laser Desorption/Ionization Mass Spectrometry, Anal. Chem., 2006, 78(5), 1485–1493 CrossRef CAS PubMed.
- X. R. He, H. B. Liu and Y. L. Li, et al., Gold Nanoparticle-Based Fluorometric and Colorimetric Sensing of Copper(II) Ions, Adv. Mater., 2005, 17(23), 2811–2815 CrossRef CAS.
- C. C. Huang and H. T. Chang, Selective Gold-Nanoparticle Based “Turn-On” Fluorescent Sensors for Detection of Mercury(II) in Aqueous Solution, Anal. Chem., 2006, 78(24), 8332–8338 CrossRef CAS PubMed.
- M. A. Dobrovolskaia, A. K. Patri, J. Zheng, J. D. Clogston, N. Ayub, P. Aggarwal and B. W. Neun, Interaction of colloidal gold nanoparticles with human blood: effects on particle size and analysis of plasma protein binding profiles, Nanomedicine, 2009, 5, 106–117 CAS.
- L. Vigderman and E. R. Zubarev, High-Yield Synthesis of GNRs with Longitudinal SPR Peak Greater than 1200 nm Using Hydroquinone as a Reducing Agent, Chem. Mater., 2013, 25(8), 1450–1457 CrossRef CAS.
- C. Huanjun, K. Xiaoshan and Y. Zhi, et al., Shape- and size-dependent refractive index sensitivity of gold nanoparticles, Langmuir, 2008, 24(10), 5233–5237 CrossRef PubMed.
- B. Pan, D. Cui, P. Xu, Q. Li, T. Huang, R. He and F. Gao, Study on interaction between gold nanorod and bovine serum albumin, Colloids Surf., A, 2007, 295, 217–222 CrossRef CAS.
- L. Shang, Y. Wang, J. Jiang and S. Dong, pH-dependent protein conformational changes in albumin: gold nanoparticle bioconjugates: a spectroscopic study, Langmuir, 2007, 23, 2714–2721 CrossRef CAS PubMed.
- X. Ye, C. Zheng and J. Chen, et al., Using Binary Surfactant Mixtures to Simultaneously Improve Dimensional Tunability and Monodispersity in the Seeded-Growth of GNRs, Nano Lett., 2013, 13(2), 765–771 CrossRef CAS PubMed.
- J. R. Lakowicz, C. D. Geddes and I. Gryczynski, et al., Advances in surface-enhanced fluorescence, J. Fluoresc., 2004, 14(4), 425–441 CrossRef CAS PubMed.
- K. G. Thomas and P. V. Kamat, Chromophore-Functionalized Gold Nanoparticles, Acc. Chem. Res., 2003, 36(12), 888–898 CrossRef CAS PubMed.
- T. Ming, L. Zhao and Z. Yang, et al., Strong Polarization Dependence of Plasmon-Enhanced Fluorescence on Single Gold Nanorods, Nano Lett., 2009, 9(11), 3896–3903 CrossRef CAS PubMed.
- L. Qin, X. W. He and L. Chen, et al., Turn-on Fluorescent Sensing of Glutathione S-Transferase at near-Infrared Region Based on FRET between Gold Nanoclusters and Gold Nanorods, ACS Appl. Mater. Interfaces, 2015, 7, 5965–5971 CAS.
- Y. C. Shiang, C. A. Lin and C. C. Huang, et al., Protein A-conjugated luminescent gold nanodots as a label-free assay for immunoglobulin G in plasma, Analyst, 2011, 136(6), 1177–1182 RSC.
- Y. Zhao, Z. Wang and W. Zhang, et al., Adsorbed Tween 80 is unique in its ability to improve the stability of gold nanoparticles in solutions of biomolecules, Nanoscale, 2010, 2(10), 2114–2119 RSC.
- T. E. Pylaev, V. A. Khanadeev and B. N. Khlebtsov, et al., Colorimetric and dynamic light scattering detection of DNA sequences by using positively charged gold nanospheres: a comparative study with gold nanorods, Nanotechnology, 2011, 22(28), 285501–285511 CrossRef CAS PubMed.
- J. Hassanzadeh, M. Amjadi and J. L. Manzoori, et al., Gold nanorods-enhanced rhodamine B-permanganate chemiluminescence and its analytical application, Spectrochim. Acta, Part A, 2013, 107(7), 296–302 CrossRef CAS PubMed.
- L. Xucong, W. Menghui and G. Liangqia, et al., Studies on the Determination of Protein by a New Resonance Rayleigh Scattering System, Spectrosc. Spectral Anal., 2007, 27(8), 1587–1590 Search PubMed.
- J. Spadavecchia, S. Casale and S. Boujday, et al., Bioconjugated gold nanorods to enhance the sensitivity of FT-SPR-based biosensors, Colloids Surf., B, 2012, 100(12), 1–8 CrossRef CAS PubMed.
- M. Wei, K. Hua and X. Liguang, et al., Attomolar DNA detection with chiral nanorod assemblies, Nat. Commun., 2013, 4, 2689 Search PubMed.
- W. Xiaoling, C. Xi and G. Fengli, et al., SERS encoded nanoparticle heterodimers for the ultrasensitive detection of folic acid, Biosens. Bioelectron., 2016, 75, 55–58 CrossRef PubMed.
- T. Lijuan, L. Si and X. Liguang, et al., Chirality-based Au@Ag Nanorod Dimers Sensor for Ultrasensitive PSA Detection, ACS Appl. Mater. Interfaces, 2015, 7, 12708–12712 Search PubMed.
- Y. Zhu, L. Xu and W. Ma, et al., A one-step homogeneous plasmonic circular dichroism detection of aqueous mercury ions using nucleic acid functionalized gold nanorods, Chem. Commun., 2012, 48, 11889–11891 RSC.
| This journal is © The Royal Society of Chemistry 2017 |

