 Open Access Article
Creative Commons Attribution 3.0 Unported Licence
Component-based biocompatibility and safety evaluation of polysorbate 80†
Huimin Sunabe,
Rui Yangb,
Jue Wangb,
Xia Yangc,
Jiasheng Tu*ae,
Langui Xieb,
Chunqi Lid,
Qiaocong Laod and
Chunmeng Sun *ae
*ae
aState Key Laboratory of Nature Medicines, Department of Pharmaceutics, China Pharmaceutical University, 24 Tong Jia Xiang, Nanjing 210009, China. E-mail: jiashengtu@aliyun.com; suncm_cpu@hotmail.com@hotmail.com; Tel: +86-25-83271305
bNational Institutes for Food and Drug Control, 2 Tiantan Xili, Dongcheng District, Beijing 100050, China
cYuncheng University, 1155 Fudan West Street, Yuncheng 044000, China
dHunter Biotechnology, Inc., Transfarland, Xiaoshan Economic & Technology, Hangzhou 311231, China
eCenter for Research Development and Evaluation of Pharmaceutical Excipients and Generic Drugs, China Pharmaceutical University, 24 Tong Jia Xiang, Nanjing 210009, China
First published on 7th March 2017
Abstract
Polysorbate 80 is a complicated mixture consisting of a series of esters and etherates synthesized separately by oleic acid and ethylene oxide with a two-core matrix of sorbitan and isosorbide. The extreme complexity of its components makes it difficult to determine its safety. In this study, we provided a quantitative method using UPLC-Q-TOF-MS to identify its components and further explored the side effects of its main constituents using an in vitro hemolysis study, LO2 cells cytotoxicity assay and an in vivo acute toxicity assay to zebrafish. We separated nine major components containing a total of 355 chemicals, confirmed their structures and accurately determined their content. In vitro and in vivo studies revealed that polyoxyethylene sorbitan dioleate (PSD) could induce the highest hemolysis rate, highest cytotoxicity to LO2 cells and highest fatality rate of zebrafish in spite of its relatively low content in polysorbate 80. The results of the exhaustive component-based investigation on polysorbate 80 provide a basis for risk control and safety improvement, and brings new ideas for the re-evaluation and application of any complicated pharmaceutical excipients.
1. Introduction
Polysorbate 80 (commercially known as Tween 80 and chemically as polyoxyethylene-sorbitan-20-monooleate) is one of the most common nonionic surfactants currently used in a great variety of formulations including traditional Chinese medicine injections and protein biopharmaceuticals.1,2 It is also widely used as a solubilizing agent3 for improving the solubility of poorly soluble drugs in different pharmaceutical dosage forms such as creams, ointments, lotions, tablets as well as injections, which are complex mixtures and difficult to characterize.4 Additionally, researchers found that polysorbate 80 was responsible for breaking through the blood–brain barrier.5 However, polysorbate 80-containing dosage forms, especially injections, were reported to trigger adverse effects, including hemolysis6 and anaphylactoid reactions,7–10 although the underlying specific mechanisms are still obscure.As an amphiphilic polymer, the majority of constituents in polysorbate 80 possess both hydrophilic and hydrophobic blocks. Besides traces of totally hydrophilic polymer, i.e., polyoxyethylene, these molecules have various different hydrophobic compositions. Due to the various side reactions in the polysorbate 80 synthesis and their resulting different by-products, polysorbate 80 obviously is a mixture containing not only monoesters, but also polyethylene glycol (PEG), diesters, triesters and even tetraesters at varying polyoxyethylene polymerization degrees. Thereby, it is difficult to characterize.11–13
Ultra performance liquid chromatography (UPLC) combined with high resolution Q-TOF-MS is more sensitive and efficient than traditional HPLC in analyzing complicated mixtures. Thus, it is greatly suitable for component analysis of mixtures such as metabolites, biochemical materials, and natural ingredients and could offer sufficient sensitivity, accuracy and precision to determine the main components of polysorbate 80. With ATA Finder Software, the chemical structures of each component in polysorbate 80 can be identified by the chromatogram and analyzed even it has some components with extremely similar structures.
The study is mainly aimed to develop a highly efficient analysis method to separate components polysorbate 80 using UPLC-Q-TOF-MS equipped with an evaporative light scattering detector (ELSD), classify their chemical structures and determine their contents using Nano Quantity Analyte Detector (NQAD), and investigate the contribution of each constituent to the toxicity of polysorbate 80. These data will provide a basis for polysorbate 80's quality control and lay a good foundation for studies on mechanisms underlying the adverse reactions of polysorbate 80 in the future.
2. Materials and methods
2.1 Materials
Methanol and tetrahydrofuran were provided by Merck Co., Ltd. Commercial Polysorbate 80 (NJWE, 20130401, 20100406; SHSY, 100414M, RY, 807367E; HNEK, 20100201; WZQM, 20100501; SEPPIC, L10313) was collected in the market. MTT (3-(4,5-dimethyl-thiazol-2-yl)-2,5-diphenyl-tetrazoliumbromide) and LO2 cell lines were from Shanghai Institute of Cell Research (Shanghai, China). RPMI 1640 medium was purchased from Gibco BRL (Grand Island, NY).2.2 Animal use
Rabbits were purchased from Qinglongshan Farms (Nanjing, China). Zebrafish were from Hunter Biotech Co., Ltd. In Hangzhou, China. The special zebrafish research platform (Hangzhou Hunter Biotech Co., Ltd.) was certificated by Association for Assessment and Accreditation of Laboratory Animal Care (AAALAC). Animal experiments were conducted in full compliance with the National Institute of Health Guide for the Care and Use of Laboratory Animals and approved by the Animal Ethics Committee of China Pharmaceutical University.2.3 Cell culture and cell lines
LO2 cells were cultured in RPMI 1640 medium with 10% fetal bovine serum (FBS) at 37 °C in a 5% CO2 atmosphere. All culture media were replaced every two days.2.4 Chromatography systems for component separation
Reversed-phase HPLC (RP-HPLC) analysis was carried out on an Agilent 1260 HPLC system (Palo Alto, CA, USA) equipped with a binary gradient pump, auto-sampler, a temperature-controlled column compartment, and an evaporative light scattering detector (ELSD 2000ES, Caltech, USA). The ELSD settings were as follows: impactor mode “off”, nitrogen gas flow rate of 1.0 L min−1 at gain 1, evaporation tube temperature of 100 °C, injection volume of 20 μL, and column temperature of 30 °C. Analytes were separated using a Agilent Eclipse XDB-C18 (4.6 × 150 mm, 5 μm, USA). The mobile phases were methanol (A) and tetrahydrofuran (B). The initial condition was set at 100% solvent B. Solvent B was decreased to 90% within the first 4.9 minutes and then to 20% from 5.0 min to 18.9 min. At the last 0.1 minutes (19.0–19.1 min), solvent B was recovered to 100% from 20%. Method validation was performed as previously described.142.5 Chromatography systems for component collection
The collection and preparation of polysorbate 80 constitutes were performed by Waters Auto Purification System 2767 Sample Manager, 2545 Binary Gradient Module, 2424 ELS Detector and 515 HPLC Pump. The ELSD settings were as follows: nebulizer gas pressure 60 psi, drift tube temperature 60 °C. Nitrogen gas was provided by an in-house nitrogen gas generator system at 65 psi. The injection volume was 800 μL, and the column temperature was 30 °C. Chromatographic column: Gemini-NX (5 μm 150 × 21.2 mm, 110 Å). Mobile phase flow rate is 25 mL min−1. Mobile phase A is methanol–water (95![[thin space (1/6-em)]](https://www.rsc.org/images/entities/char_2009.gif) :
:![[thin space (1/6-em)]](https://www.rsc.org/images/entities/char_2009.gif) 5, v/v) and B is THF. Gradient elution method was shown in Table 1.
5, v/v) and B is THF. Gradient elution method was shown in Table 1.
| Time (min) | Mobile phase A (%) | Mobile phase B (%) | Flow rate (mL min−1) |
|---|---|---|---|
| 0 | 100 | 0 | 25 |
| 15 | 50 | 50 | 25 |
| 15.1 | 0 | 100 | 25 |
| 17 | 0 | 100 | 25 |
| 17.1 | 100 | 0 | 25 |
| 19 | 100 | 0 | 25 |
Sample preparation: 0.5 g mL−1 polysorbate 80 solution was prepared by accurately weighing 50 g into a 100 mL volumetric flask, and then filled with THF.
Purification of fraction: each fraction was processed using the rotary evaporator (BUCHI R-215) at 40 °C, and then appropriate methanol was added to dissolve the residue. The methanol solution was dried as the above. Finally, the residue was transferred to an 8 mL vial and was pumped dry with oil pump. If the purity of fractions is lower than 95%, there is necessary to do the second separation as the same method.
2.6 UPLC-Q-TOF-MS analysis
Mass spectrometric analysis was carried out on an UPLC-Q-TOF-MS system (Beverly, MA) operating in Jet Stream ESI Positive Mode.15 The instrument was set to run at capillary voltage of 3500 V, fragmentor voltage of 400 V, drying gas temperature of 300 °C, drying gas flow of 8 L min−1, sheath gas temperature of 350 °C, sheath gas flow rate of 11 L min−1 and nebulizer pressure of 40 psi. The calibration was performed in the range of 100–3000 m/z. Instrument control and data analysis were achieved using Agilent Mass Hunter Station. Agilent FBF software was applied to search specified compounds according to the molecular formula.2.7 MTT assay
The cytotoxicity of each constituent isolated from polysorbate 80 was evaluated using MTT (3-(4,5-dimethylthiazol-2-yl)-2,5-diphenyltetrazolium bromide) colorimetric test by calculating the percentage of viable cells.16,17 In brief, LO2 cells were seeded in 96-well plates at a density of 5000 cells per well in RPMI 1640 medium containing 5% FBS and allowed to grow overnight. After incubation with each constitute at serial concentrations (10, 25, 50, 100, 200, 300, 400 and 500 μg mL−1) at 37 °C for 24 h, 200 μL of MTT (5 mg mL−1) was added to each well. The plates were then incubated for another 4 h at 37 °C to form formazan crystals. After removal of the medium, 150 μL of dimethyl sulfoxide (DMSO) was pipetted into each well and the plates were shaken slowly for 10 min to completely dissolve formazan. The absorbance of dissolved formazan at 570 nm was measured using a microplate reader (BioTek Instrument, Inc.).18 Cell inhibition was calculated by the following equation:| Cell viability (%) = [ODsample/ODblank] × 100% |
![[thin space (1/6-em)]](https://www.rsc.org/images/entities/char_2009.gif) C (logarithm of concentrations) was plotted to describe in vitro toxicity of each constituent of polysorbate 80.
C (logarithm of concentrations) was plotted to describe in vitro toxicity of each constituent of polysorbate 80.
2.8 Acute toxicity of polysorbate 80 and its main constituents on zebrafish
Zebrafish is considered as an ideal candidate for acute toxicity evaluation of complicated mixtures19,20 because it possesses genes highly homologous to human genes and signal transduction pathways similar to human's and has a very short feeding period, which is a major advantage compared with other experimental animals. In this study, zebrafish embryos were supplied by Hunter BiotechCo., Ltd. (Hangzhou, China). Suitable embryos were selected and incubated at 28 °C for 48 h in fish water, which was prepared by addition of 200 mg salt in every 1 L instant reverse osmosis water and has conductivity of 480–510 μS cm−1, pH of 6.9–7.2 and hardness of 53.7–71.6 mg CaCO3 per L.21 To determine the fifty percent lethal dose (LD50) of polysorbate 80, 60 zebrafish at 10 months old were divided into six groups with 10 zebrafish per group. Zebrafish of 5 groups were intraperitoneally injected 6.48, 7.56, 8.64, 9.72 and 10.80 mg polysorbate 80 per fish, respectively, and the rest group non-treated served as the blank control. The number of dead zebrafish in each group was counted and used to calculate LD50.Acute toxicity of polysorbate 80 collected from six manufacturers (seven batches) was evaluated on zebrafish of 7 groups with 10 fish per group. Each fish was injected the polysorbate 80 at the dose of LD50 per fish and raised for another 72 h. In addition, another 90 zebrafish were divided into 9 groups with 10 zebrafish per group. Fishes in the 7 testing groups were intraperitoneally injected with 7 main constitutes of polysorbate 80, namely E, L, Q, S, Si, W and Y, respectively, at a dose of 1 μg per fish. Zebrafish in blank control group and negative control group were intraperitoneally injected the same volume of water and 20% DMSO, respectively. After administration, all fishes were raised for another 72 h and the number of dead zebrafish in each group was counted and the mortality rate (ratio of number of dead fishes and the total number of fishes within one testing group at the experimental terminus) was calculated.
2.9 Hemolytic test
Fresh blood collected from rabbits was placed into a flask and stirred unidirectionally to remove fibrous proteins. The fiber-free blood was mixed with saline and centrifuged at 1500 rpm to collect blood cells. After several washes, the blood cells in the sub-layer were collected, prepared as 2% saline suspension, mixed thoroughly with equal volume of seven constituents, which were separated from polysorbate 80 and dissolved at a serial of concentrations (0, 1, 2, 5, 10, 20, 30, 40 and 50 mg mL−1) in ethanol. Afterwards, these solutions were placed in a water bath at 37.5 °C for 3 h to observe phenomena and then centrifuged at 1500 rpm. The upper layer solution was collected and their absorbance at 540 nm was measured using a UV spectroscope. Hemolysis rate (%) induced by each constituent was calculated by the following equation:| Hemolysis rate (%) = (ODt − ODnc)/(ODpc − ODnc) × 100% |
3. Results and analysis
3.1 UPLC-Q-TOF-MS studies
According to the USP35/NF30, polysorbate 80 is a mixture of partial esters of fatty acids, mainly oleic acid, with sorbitol and its anhydrides ethoxylated with approximately 20 moles of ethylene oxide for each mole of sorbitol and sorbitol anhydrides. However, limited by techniques in actual synthetic process, the yielded polysorbate 80 usually contains not only the expected product with an average of 20 ethylene oxide repeat units connected to the 4 short PEO branches of the sorbitan core, but also some other by-products.13In general, polysorbate 80 is synthesized through dehydration of sorbitol, esterification with oleic acid and etherification with ethylene oxide (Fig. 1B).1 However, it is possible that the first step of dehydration generates two main products, i.e., 1,4-sorbitan by losing one H2O molecule (sorbitol anhydride) and 1,4- or 3,6-isosorbide by losing two H2O molecules (isosorbide), leading to production of compounds with various degrees of esterification and polymerization in the following esterification and etherification (Fig. 1A). As a result, the components of polysorbate 80 are too complex to be efficiently separated and accurately analyzed, making its quality control and safety evaluation very difficult.
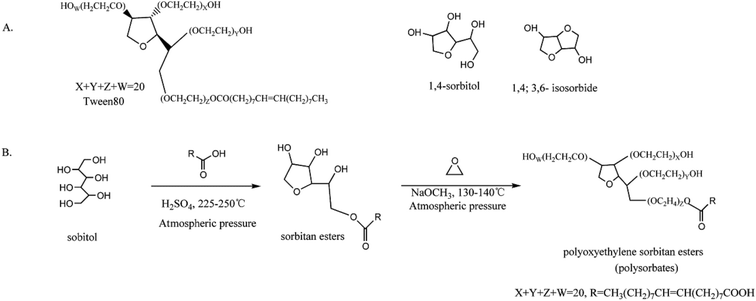 | ||
| Fig. 1 (A) Theoretical structure of polysorbate 80 and its core parents, 1,4-sorbitan and 1,4;3,6-isosorbide. (B) Synthetic procedure of polysorbate 80. | ||
Adamo et al. separated the components of polysorbate 80 using reverse-phase HPLC (RP-HPLC) and obtained only two peaks in chromatogram.19 Zhang et al. separated polysorbate 80 by RP-HPLC and observed seven peaks. But it took up to 45 min to analyze one sample.13 In this study, using our improved elution conditions, we were able to obtain nine peaks in chromatogram within 15 min (Fig. 2A). In addition, using UPLC-Q-TOF-MS based on the total ion chromatogram (TIC), we were able to analyze eleven components (Fig. 2B).
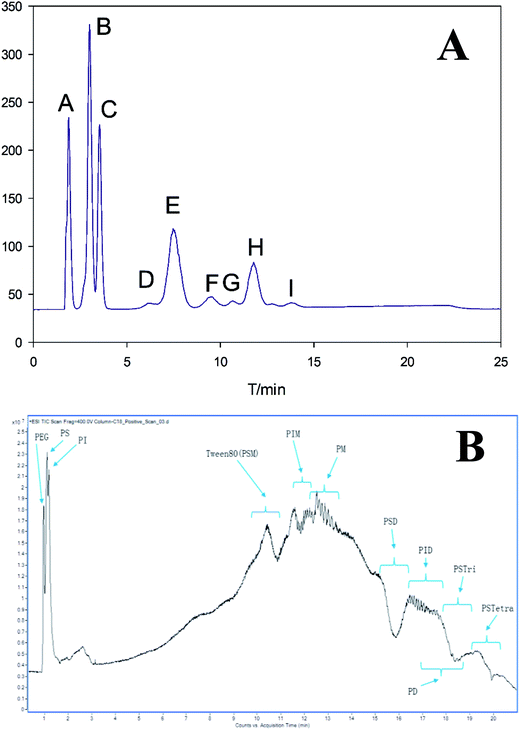 | ||
| Fig. 2 (A) Chromatograms of polysorbate 80 revealed by reversed-phase HPLC with ELS detection; (B) total ion chromatogram (TIC) for polysorbate 80 using UPLC-Q-TOF-MS. | ||
In this procedure, we first established a database containing a total of 355 possible components in polysorbate 80 according to their name, molecular formula and weight using Mass Hunter PCDL Manager Software. These components were defined based on their structures confirmed by Find by Formula (FBF) software (validated by Agilent, US) after UPLC-Q-TOF-MS test. Finally, eleven components were successfully obtained and confirmed. Moreover, polymerization of each component was successfully determined by UPLC-Q-TOF-MS analysis.
The mass spectrum of UPLC fraction eluted at 0.8–1.6 min showed three unesterified species, i.e., polyethylene glycol (PEG), polyoxyethylene sorbitan (PS) and polyoxyethylene isosorbide (PI) with high hydrophilicity.
As shown in Fig. 2B, the chromatographic peak at 10.0–10.9 min showed a single distribution of sodiated oligomer with mass of C24H44O6 (OC2H4)n (n = 15–33). The m/z values of its two clusters [M + Na]+ and [M + 2Na]2+ were in agreement with the average molecular weight of polysorbate 80, 1309.7 plus one or two cationized Na+, respectively. The addition of esterification with oleic acid strengthened its interaction with the column, hence, prolonged its retention time comparing with the first three peaks. Consequently, the elution content was assigned to polysorbate 80.
The peaks between 11.5 and 12.5 min corresponded to the mass of C24H42O5 (OC2H4)n (n = 5–27), which is 18 Da (H2O) less than the molecular weight of C24H44O6 mentioned above. Therefore, distribution C was assigned to polyoxyethylene isosorbide monooleate (PIM).
Different from the fractions collected at 10.0–10.9 min and 11.5–12.5 min, the components with sorbitan core were more readily eluted than those with isosorbide core with the same number of esterified oleic acid due to their stronger hydrophilicity.
The peak between 12.5 and 13.5 min possessed a mass equal to a molecular of oleic acid ester (C18H33O2–) plus 3 to 21 polyethylene glycol (PEG or –(OC2H4)n, n = 3–21). Thus, it was assigned to polyethylene glycol monooleate (PM) although neither PEO-sorbitanoleate(s) nor PEO-isosorbideoleate(s) had such central/end substituent mass.
Similar to fractions B and C at 15.2–16.4 min and 16.4–17.5 min, respectively, fractions E and F were assigned to polyoxyethylene sorbitan dioleate (PSD) and polyoxyethylene isosorbide dioleate (PID). The results showed that, for both polyoxyethylene sorbitan and polyoxyethylene isosorbide, the retention time increased with the number of oleic acid ester bonded to their branches increasing, or hydrophobicity increasing caused by decreased hydroxyl number. Such tendency was also observed for polyethylene glycol monooleate (PM) and polyethylene glycol dioleate (PD, fraction G).
The longer retention time of the last eluted fractions H and I with same sorbitan core indicated that they had higher hydrophobicity, consistent with the presence of three additional oleates and four oleates, respectively. Hence, H was designated as polyoxyethylene sorbitan trioleate (PSTri), which was defined as the target product of polysorbate 85 synthesis but not polysorbate 80.24 In analogy to these findings, the minor distribution I was assigned to polyoxyethylene sorbitan tetraoleate (PSTetra).
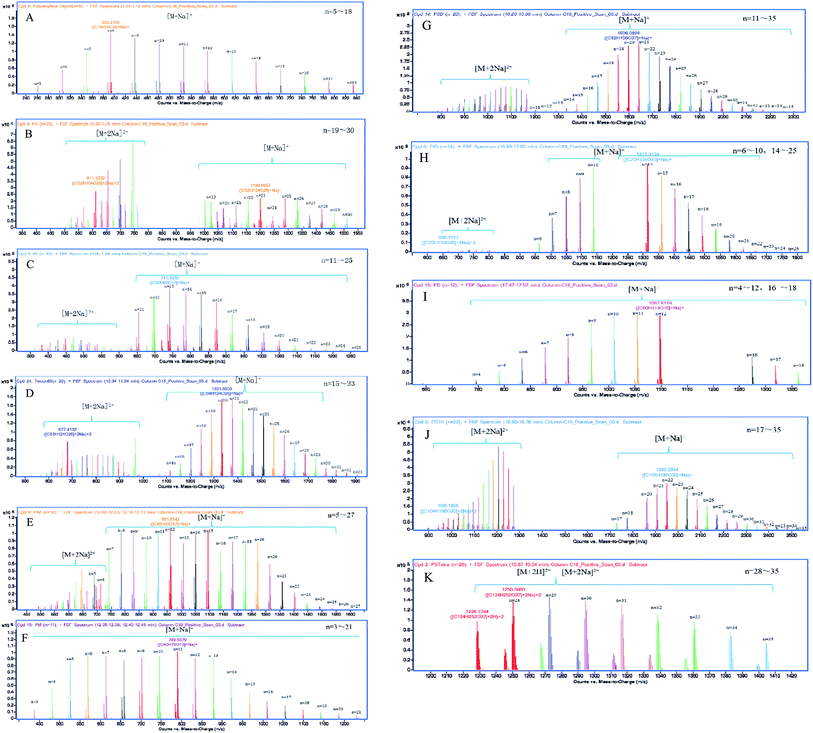
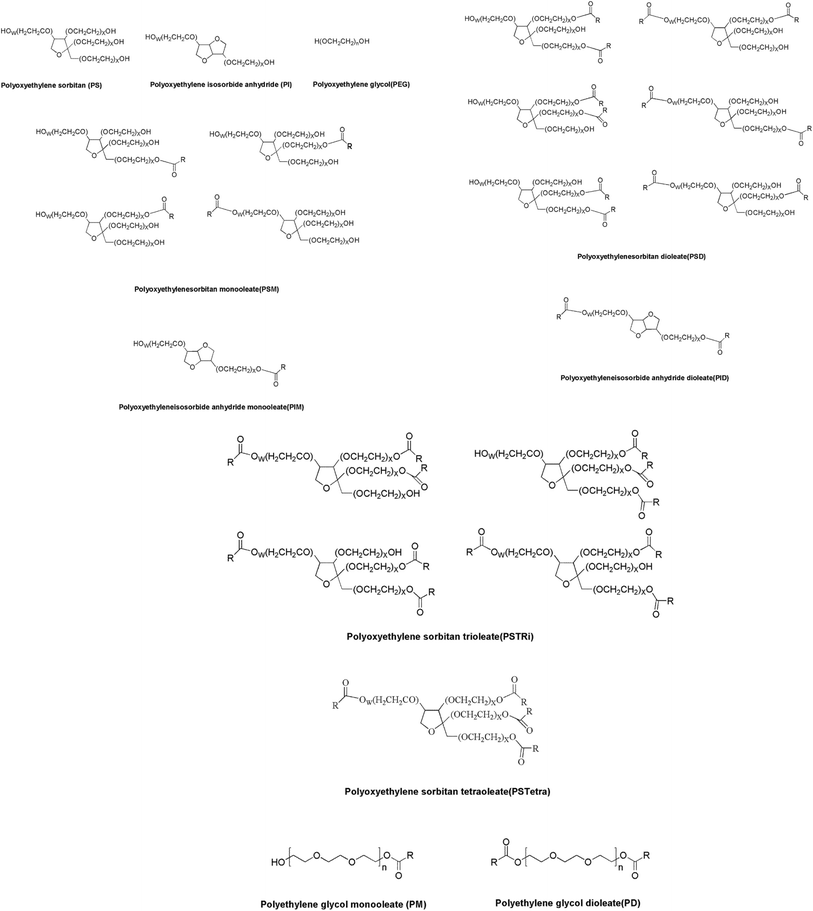
Fig. 3 displayed the deconvoluted mass spectra of the nine species A–I separated by the method mentioned above. The one or two peak clusters representing the chemicals that Na+ or 2Na+ continuously combined to the internal epoxyethane of same molecular weight in each spectrogram showed normal distribution, where “n” represented the number of epoxyethane conjugated to the main species by etherification, and was accurately verified by UPLC-Q-TOF-MS (Table 2). Conclusively, Fig. 4 gave the predicted chemical structures of the main species of the nine components in polysorbate 80. It can be found in Fig. 4 that polyethylene dioleate (PD) is a symmetrical compound esterified by one polyoxyethylene molecule and two oleic acid molecules. As it has similar polarity with PID and PSTri, the acquisition time overlapped in Fig. 2B.
| Peak no. | Name | Formula | n |
|---|---|---|---|
| A | Polyethylene glycol (PEG) | H(OCH2CH2)nOH | 5–18 |
| Polyoxyethylene sorbitan (PS) | C6H12O5(OC2H4)n | 19–30 | |
| Polyoxyethylene isosorbide (PI) | C6H10O4(OC2H4)n | 11–25 | |
| B | Polyoxyethylene sorbitan monooleate (PSM) | C24H44O6(OC2H4)n | 15–33 |
| C | Polyoxyethylene isosorbide monooleate (PIM) | C24H42O5(OC2H4)n | 5–27 |
| D | Polyethylene glycol monooleate (PM) | C18H33O2(OC2H4)nH | 3–21 |
| E | Polyoxyethylene sorbitan dioleate (PSD) | C42H76O7(OC2H4)n | 11–35 |
| F | Polyoxyethylene isosorbide dioleate (PID) | C42H74O6(OC2H4)n | 6–25 |
| G | Polyethylene glycol dioleate (PD) | C36H66O3(OC2H4)nH | 4–18 |
| H | Polyoxyethylene sorbitan trioleate (PSTri) | C60H108O8(OC2H4)n | 17–35 |
| I | Polyoxyethylene sorbitan tetraoleate (PSTetra) | C78H140O9(OC2H4)n | 28–35 |
3.2 Analysis and comparison of polysorbate 80 from different sources
Because the manufacture process varied for polysorbate 80 with different sources, their components also varied in both category and proportion. Using the improved HPLC method developed in the study, the distinct compositions of both injectable grade and non-injectable grade polysorbate 80 from six manufacturers including seven batches were identified. Table 3 summarized the information of all products, including manufactures, grade and batch number. Fig. 5 showed their comparative chromatograms using injectable grade polysorbate 80 from NJWE as a reference. As shown in Fig. 5c and f, the chromatograms of No. 4 and No. 7 injectable grade polysorbate 80 were consistent with that of the reference No. 1 polysorbate 80, while others were different in their constituent distribution. In Fig. 5a, b, d and e, a shoulder peak acromion was diluted prior to PSM, indicating that other impurities were present in PSM of the tested polysorbate 80. Besides, the chromatograms also showed that No. 2, 3, 5 and 6 polysorbate 80 had less component C, polyoxyethylene isosorbide monooleate (PIM), than No. 1 polysorbate 80, and contained a new component E, polyoxyethylene sorbitan dioleate (PSD). These findings demonstrated that polysorbate 80 from different sources were different in components and their composition. The improved RP-HPLC method along with mass chromatogram can be implemented in controlling the quality of polysorbate 80 and collecting more information about available products.| No. | Manufacturers | Grade | Batch no. |
|---|---|---|---|
| 1 | NJWE | Injectable | 20130401 |
| 2 | NJWE | Non-injectable | 20100406 |
| 3 | SHSY | Non-injectable | 100414M |
| 4 | RY | Injectable | 807367E |
| 5 | HNEK | Non-injectable | 20100201 |
| 6 | WZQM | Non-injectable | 20100501 |
| 7 | SEPPIC | Injectable | L10313 |
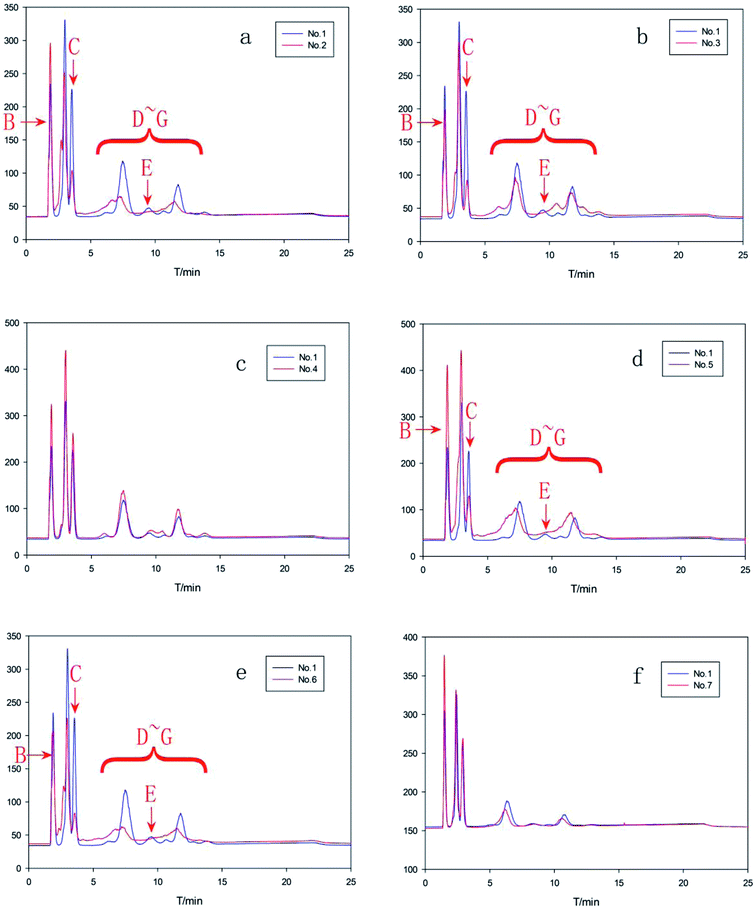 | ||
| Fig. 5 Comparative chromatograms of polysorbate 80 from different manufacturers (corresponding number and sample information were listed in Table 3). No. 1 polysorbate 80 for injection from NJWE was regarded as the reference (blue curve). (a) No. 2 vs. No. 1, (b) No. 3 vs. No. 1, (c) No. 4 vs. No. 1, (d) No. 5 vs. No. 1, (e) No. 6 vs. No. 1, (f) No. 7 vs. No. 1. | ||
3.3 In vitro cytotoxicity studies
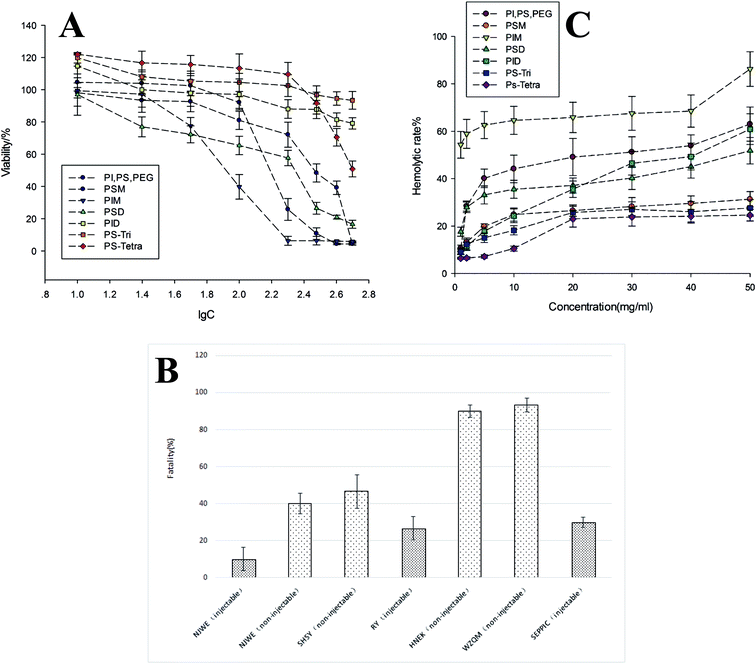
The cytotoxicity of the seven constitutes isolated from polysorbate 80 were investigated using LO2 cells and MTT assays. Their cytotoxicity to LO2 cells was showed in Fig. 6A as viability rate (%) vs. logarithm of concentrations (lg![[thin space (1/6-em)]](https://www.rsc.org/images/entities/char_2009.gif) C). The results showed that each constitute had different cytotoxicity in different concentration ranges. At concentration of 55 μg mL−1 (lg
C). The results showed that each constitute had different cytotoxicity in different concentration ranges. At concentration of 55 μg mL−1 (lg![[thin space (1/6-em)]](https://www.rsc.org/images/entities/char_2009.gif) C = 1.74) or lower, PSD had the highest toxicity among all constitutes, while at concentration between 55 μg mL−1 and 150 μg mL−1, the cytotoxicity of each constitute showed similar trend and was in the order of PIM > PSD > PSM and PID > PSTri > PSTetra. At concentration of IC50, PIM showed the highest cytotoxicity to LO2 cells.
C = 1.74) or lower, PSD had the highest toxicity among all constitutes, while at concentration between 55 μg mL−1 and 150 μg mL−1, the cytotoxicity of each constitute showed similar trend and was in the order of PIM > PSD > PSM and PID > PSTri > PSTetra. At concentration of IC50, PIM showed the highest cytotoxicity to LO2 cells.
3.4 LD50 determination and acute toxicity of polysorbate 80 from various manufacturers to zebrafish
In the acute toxicity test, we determined the polysorbate 80 products from different sources (as shown in the Table 3), as well as the major seven constituents isolated from polysorbate 80. First, the LD50 was calculated by the dose–fatality curve (Fig. S1†). Accordingly, the tested zebrafish were injected at dose of 8.46 mg per fish (LD50). The fatalities of zebrafish treated with injectable/non-injectable grade polysorbate 80 from different manufacturers were shown in Fig. 6C. The fatality of zebrafish treated with injectable grade polysorbate 80 was <40%, while that of zebrafish treated with non-injectable grade polysorbate 80 was ≥40%. The results also showed that No. 4 and No. 7 induced such low fatality as No. 1 (NJWE reference sample, 10% fatality), fortunately with high consistence to NJWE reference sample. While for those samples (No. 5 and No. 6) highly distinctive from No. 1 in chromatogram, they had relatively higher fatality (>85%). These findings demonstrated that the composition and proportion of each constituent in polysorbate 80 were related to its acute toxicity.3.5 Acute toxicity of the main components of polysorbate 80 to zebrafish
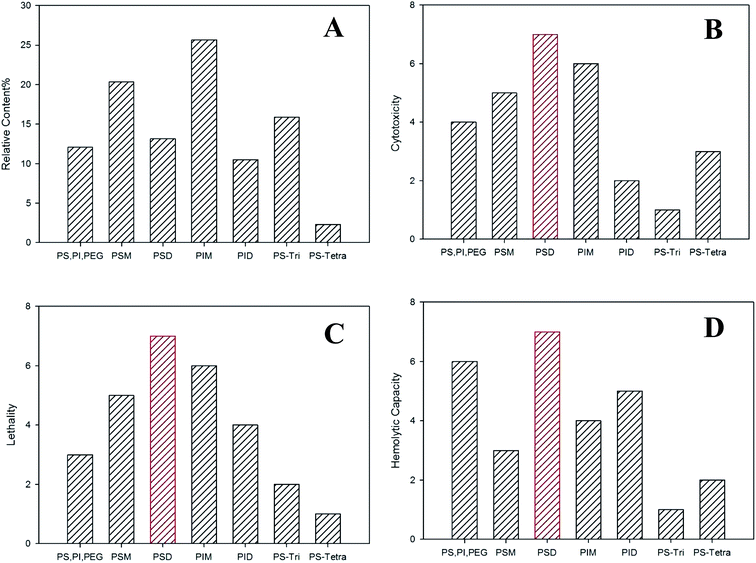
To determine the acute toxicity of each constitute that primarily contributed to acute toxicity of polysorbate 80, we first measured their contents by the improved methods using UPLC-Q-TOF-MS (PS, PI and PEG were taken together due to the difficulty of the present separation method) and HPLC-NQAD, as they are suitable for quantification of substances which showed neither UV absorption nor electrochemical activity and were difficult to ionize or characterize. It was interesting that PSD rather than PSM, which was defined as the main constitute of polysorbate 80 in accordance with USP35/NF29, was actually the primary component of polysorbate 80, accounting for 25.68% (data not shown). In addition, the toxicity of each constitute in polysorbate 80 to zebrafish was shown as fatal effect in Fig. 7D. PIM, PSM and PSD showed high fatality effect of 5.4, 2.9 and 2.7, respectively, among all constitutes. These findings prompted that studies on the safety and functionality of polysorbate 80 should focus on the relative proportion of these primary constitutes, which play important roles in polysorbate 80-induced side effects. Moreover, these results provide great assistances in establishment of a more precise standard for effective quality control of for polysorbate 80 by strictly limiting the proportion of each component.3.6 Hemolytic test
The hemolytic rate of the seven constitutes from polysorbate 80 in in vitro experiment using rabbit fresh blood is relevant to their toxicity to zebrafish (Fig. 6C). Among them, PIM treatment resulted in the highest hemolytic rate, in consistent with its toxicity to zebrafish, and PID and PSM had higher hemolytic rate and toxicity than other components. These results indicated that oleates with isosorbitol anhydride had higher toxicity than oleates with sorbitol anhydride. Moreover, the fatality of zebrafish induced by PIM, PID and PSM was more than 60%, much higher than that induced by other constitutes (<15%). The hemolytic rate was in the order of PID > PSTri > PSTetra, consistent with their toxicity to zebrafish, suggesting that the toxicity of oleates with the same parent core decreases as the esterificaiton degree increases. Besides, PIM, PID and PSM had poor solubility in water and PID with isosorbitol anhydride had similar solubility with PSTri, indicating that esterification of isosorbitol anhydride had higher hydrophobicity. Thus, interaction between oleates and phospholipid bilayer was prone to happen and lead to toxicity. At concentration <10 mg mL−1, PID had lower hemolytic rate than PIM, in accordance with their toxicity to zebrafish.4. Discussion
The median lethal cytotoxicity dose (described as CD50), the median lethal dose to zebrafish (described as LC50), and the median hemolytic dose (described as HD50) of each component were calculated and sorted in descending order. Fig. 7 shows the relative cytotoxicity, lethality, and hemolytic rate induced by each constitute in polysorbate 80. It can be concluded that PSD possessed the highest toxicity in relative cytotoxicity, hemolytic capacity and lethality. The cytotoxicity and lethality of components PS, PI, PEG, PSM, PSD and PIM showed similar variation tendency, while their hemolytic capacity showed completely different variation tendency. PS, PI and PEG presented strong hemolytic capability, presumably because their good solubility may induce devastating osmotic pressure difference across the membrane of red blood cells. It is likely that PSM, PSD and PM had high amphipathicity and affinity to cells' lipid bilayer, thereby inducing great cytotoxicity. Furthermore, the content of PSM, PSD and PM is also higher than that of others in polysorbate 80. Therefore, it is reasonable to assume that these three constitutes play important functional roles in polysorbate 80. Because PID, PSTri and PSTetra have poor water solubility, it is very difficult to evaluate their functional roles in polysorbate 80. We assume that PSTri may have negligible contribution to the side effects of polysorbate 80 because of its relatively high content (approximately 16%) and PSTetra may have less contribution to the side effects of polysorbate 80 because of the lowest content in polysorbate 80.Taken together, polysorbate 80 in diverse dosage forms has been widely applied in formulating drugs for a long time. But the quality control is not so consummate that severe adverse reactions commonly happen.8,25–27 It is assumed that the popularity of such applications was attributed to other co-existing components with a suitable proportion in it rather than PSM or PSD. However, the synthetic toxicity of polysorbate 80 should be determined by different factors, including both the proportion and the intrinsic toxicity of each constitute. Considering these two factors together, the estimated fatal effects of all tested constitutes were predicted in Fig. S2,† where we can find that PIM was proved to contribute the most to polysorbate 80-induced toxicity to zebrafish. In the future, further investigations were essential to illustrate the underlying mechanisms for toxicity induced by each constitute of polysorbate 80.
5. Conclusion
The developed UPLC-Q-TOF-MS method provided valuable information for the separation and identification of the sorbitan and isosorbide derivatives in polysorbate 80. Nine main components of polysorbate 80 were successfully separated and characterized. Moreover, count of ethylene oxide units in each constitute was accurately analyzed and the contents of these constitutes were accurately quantified using NQAD. This method may also be feasible for quantification of other sorbitan esters including Tween 20, Tween 40, Tween 60, etc. and the results immensely motivate the analytical measurement for complicated mixtures.PSM, the theoretical target product of polysorbate 80, was proved to possess acute toxicity on zebrafish among all the isolated components, indicating that (1) pharmaceutical excipients including complicated mixtures as polysorbate 80 have potential risks and the present quality standards are not sufficient for their quality control, and (2) the optimal component ratio of pharmaceutical excipients and their toxicity should be further investigated in detail.
Abbreviations
| BBB | Blood brain barrier |
| CD50 | Median cytotoxicity lethal dose |
| DMSO | Dimethyl sulfoxide |
| ELSD | Evaporative light scattering detector |
| FBF | Find by formula |
| FBS | Fetal bovine serum |
| HD50 | Median hemolytic dose |
| IC50 | Half maximal inhibitory concentration |
| LC50 | Zebrafish median lethal dose |
| LD50 | Fifty percent lethal dose |
| MTT | 3-(4,5-Dimethylthiazol-2-yl)-2,5-diphenyltetrazolium bromide |
| NQAD | Nano quantity analyte detector |
| PD | Polyethylene glycol dioleate |
| PEG | Polyethylene glycol |
| PI | Polyoxyethylene isosorbide |
| PID | Polyoxyethylene isosorbide dioleate |
| PIM | Polyoxyethylene isosorbide monooleate |
| PM | Polyethylene glycol monooleate |
| PS | Polyoxyethylene sorbitan |
| PSD | Polyoxyethylene sorbitandioleate |
| PSM | Polyoxyethylene sorbitan monooleate |
| PSTetra | Polyoxyethylene sorbitan tetraoleate |
| PSTri | Polyoxyethylene sorbitan trioleate |
| TIC | Total ion chromatogram |
Acknowledgements
This work was funded by the Ministry of Science and Technology of the People's Republic of China (2015ZX093001002007, 2014ZX09507001006), the National Natural Science Foundation of China (81501579, 81673364), the Natural Science Foundation of Jiangsu Province (BK20150702), the Six Talents Summit Program of Jiangsu Province (YY-043), and the Priority Academic Program Development of Jiangsu Higher Education Institutions.References
- C. Li, C. Sun, S. Li, P. Han, H. Sun, A. Ouahab, Y. Shen, Y. Xu, Y. Xiong and J. Tu, Int. J. Nanomed., 2014, 9, 2089–2100 CrossRef PubMed.
- Y. Wang, C. Wang, C. Gong, Y. Wang, G. Guo, F. Luo and Z. Qian, Int. J. Pharm., 2012, 434, 1–8 CrossRef CAS PubMed.
- Y. A. Choi, Y. H. Yoon, K. Choi, M. Kwon, S. H. Goo, J. S. Cha, M. K. Choi, H. S. Lee and I. S. Song, Biol. Pharm. Bull., 2015, 38, 208–217 CAS.
- S. Qiu, Z. Liu, L. Hou, Y. Li, J. Wang, H. Wang, W. Du, W. Wang, Y. Qin and Z. Liu, Int. Immunopharmacol., 2013, 15, 144–149 CrossRef CAS PubMed.
- C. Li, S. S. Li, T. J. Tu, X. X. Qi, Y. R. Xiong, S. Du, Y. Shen, J. S. Tu and C. M. Sun, Polym. Chem., 2015, 6, 2740–2751 RSC.
- S. F. Zhang, D. Yan, H. Y. Tang, Y. Luo, P. Zhang, M. Yang, Y. S. Wang and X. H. Xiao, Yaoxue Xuebao, 2010, 45, 535–538 CAS.
- I. Badiu, M. Geuna, F. Nebiolo, E. Heffler, C. Bussolino and G. Rolla, Allergy, 2012, 67, 254–255 Search PubMed.
- E. A. Coors, H. Seybold, H. F. Merk and V. Mahler, Ann. Allergy, Asthma, Immunol., 2005, 95, 593–599 CrossRef CAS.
- Y. N. Mi, N. N. Ping, X. Xiao, Y. B. Zhu, J. Liu and Y. X. Cao, PLoS One, 2014, 9, e90199 Search PubMed.
- W. Sun, L. I. Yikui, N. Wang, D. U. Feng, W. Hao and L. Zhao, Zhongguo Zhongyao Zazhi, 2011, 36, 1874–1878 Search PubMed.
- S. Abrar and B. Trathnigg, J. Chromatogr. A, 2010, 1217, 8222–8229 CrossRef CAS PubMed.
- S. Frison-Norrie and P. Sporns, J. Agric. Food Chem., 2001, 49, 3335–3340 CrossRef CAS PubMed.
- R. Zhang, Y. Wang, L. Tan, H. Y. Zhang and M. Yang, J. Chromatogr. Sci., 2012, 50, 598–607 CAS.
- C. Sun, Y. Shen, D. Sun, T. Hang and J. Tu, J. Chromatogr. Sci., 2012, 50, 343–348 CAS.
- M. Eskandani, H. Hamishehkar and J. Ezzati Nazhad Dolatabadi, DNA Cell Biol., 2013, 32, 498–503 CrossRef CAS PubMed.
- Y. Shen, J. Wang, Y. N. Li, Y. Tian, H. M. Sun, O. Ammar, J. S. Tu, B. H. Wang and C. M. Sun, RSC Adv., 2015, 5, 46464–46479 RSC.
- Y. Wang, T. Sun, Y. Zhang, B. Chaurasiya, L. Huang, X. Liu, J. Tu, Y. Xiong and C. Sun, RSC Adv., 2016, 6, 37452–37462 RSC.
- E. Marza, C. Barthe, M. André, L. Villeneuve, C. Hélou and P. J. Babin, Dev. Dyn., 2005, 232, 506–518 CrossRef CAS PubMed.
- M. Adamo, L. W. Dick Jr, D. Qiu, A. H. Lee, J. Devincentis and K. C. Cheng, J. Chromatogr. B: Anal. Technol. Biomed. Life Sci., 2010, 878, 1865–1870 CrossRef CAS PubMed.
- D. Hewitt, M. Alvarez, K. Robinson, J. Ji, Y. J. Wang, Y. H. Kao and T. Zhang, J. Chromatogr. A, 2011, 1218, 2138–2145 CrossRef CAS PubMed.
- F. O. Ayorinde, S. V. Gelain, J. H. Johnson and L. W. Wan, Rapid Commun. Mass Spectrom., 2000, 14, 2116–2124 CrossRef CAS PubMed.
- X. Ling, Z. Huang, J. Wang, J. Xie, M. Feng, Y. Chen, F. Abbas, J. Tu, J. Wu and C. Sun, J. Mater. Chem. B, 2016, 4, 1787–1796 RSC.
- X. Ling, C. Zhao, L. Huang, Q. Wang, J. Tu, Y. Shen and C. Sun, RSC Adv., 2015, 5, 81668–81681 RSC.
- N. S. Erdem, N. Alawani and C. Wesdemiotis, Anal. Chim. Acta, 2014, 808, 83–93 CrossRef PubMed.
- M. I. Palacios Castano, M. Venturini Diaz, T. Lobera Labairu, I. Gonzalez Mahave, M. D. Del Pozo Gil and A. Blasco Sarramian, J. Invest. Allergol. Clin. Immunol., 2016, 26, 394–396 CrossRef CAS PubMed.
- I. Badiu, M. Geuna, E. Heffler and G. Rolla, BMJ case reports, 2012, 2012, 254–255 CrossRef PubMed.
- K. S. Price and R. G. Hamilton, Allergy Asthma Proc., 2007, 28, 313–319 CrossRef CAS PubMed.
Footnote |
| † Electronic supplementary information (ESI) available. See DOI: 10.1039/c6ra27242h |
| This journal is © The Royal Society of Chemistry 2017 |

