DOI:
10.1039/C6RA27138C
(Paper)
RSC Adv., 2017,
7, 13911-13918
Influence of Cu doping on the visible-light-induced photocatalytic activity of InVO4†
Received
22nd November 2016
, Accepted 22nd February 2017
First published on 1st March 2017
Abstract
The photocatalytic degradation of methylene blue (MB) in the presence of pure InVO4 or a 0.5–5.0 mol% Cu-doped InVO4 composite under visible light irradiation (λ ≥ 400 nm) was studied in this research. The structural and photophysical properties of the as-prepared samples in the photocatalytic degradation process were investigated. The doping of InVO4 with a Cu photocatalyst results in wide absorption in the visible-light region and superior visible-light-driven photocatalytic activities in the degradation of MB. The results indicate that the InVO4 sample doped with 1.0 mol% of Cu shows the highest photocatalytic activity. The enhanced photocatalytic activity was attributed to the copper ions acting as trapping sites, facilitating the separation of charge carriers. The main active species for the degradation of MB were investigated to explain the enhancement of the photocatalytic performance of Cu-doped InVO4. A possible photocatalytic degradation pathway for aqueous MB dye and a charge transfer mechanism for Cu-doped InVO4 were proposed.
1 Introduction
Heterogeneous photocatalysis has been widely studied for the degradation of hazardous organic pollutants of many categories.1,2 The highly organic contaminated wastewater generated by many industries leads to environmental problems.3,4 Methylene blue (MB) is commonly used as a pigment in various industries such as the textile industry, plastic production, printing, and so on. The release of methylene blue into natural water has to be carefully monitored because it is toxic to humans and aquatic organisms.5,6 Heterogeneous photocatalysis using photocatalysts is one of the most effective methods for the treatment of methylene blue because of its high performance, the possibility to reuse the catalyst, and its low energy consumption.7 Indium vanadate (InVO4) has been extensively evaluated in the field of photocatalysis for water treatment under visible light irradiation due to its narrow band gap and chemical stability.8 According to evaluations of the photocatalytic activities of indium vanadate, many types of organic compounds are used as models for degradation, such as nitrobenzene,9 rhodamine B,10–12 methyl orange,13 methylene blue,14 and 4-chlorophenol.15 However, InVO4 has a low band gap and a high electron and hole pair recombination rate, resulting in decreased photocatalytic activity. To achieve a high photocatalytic performance, indium vanadate has been modified by various methods, such as metal ion doping16,17 and the formation of composites.18–21 The doping strategy is a feasible method for separating the charge carriers of a semiconductor. It can be achieved by introducing impurity atoms into the materials. The aim of doping impurities into InVO4 is to modify the physicochemical properties of the material, which depend upon the type of impurity doping (shallow or deep) and the nature of the valence of the impurity (inert lattice mismatching, donor or acceptor).22–24 Copper is a transition metal ion and is widely used as a dopant in metal oxide semiconductors because it can extend optical absorption toward longer wavelengths, provide a large surface area for the adsorption of chemical species, and enable efficient separation of photogenerated charge carriers.25 Therefore, identifying appropriate dopants and dopant concentrations is crucial to increase the overall performance of a photocatalyst. In previous papers, InVO4 catalysts have been synthesized using a hydrothermal method,13,26–29 by electrospinning,10 using a microwave synthesis method,30 and in a mixed aqueous solution.31 It was found that the different synthesis conditions provided valuable information for choosing appropriate precursors for In and V. For example, Yao et al. (2009)32 studied the effect of the starting composition (molar ratio of In/V), pH value, soaking time and absence/presence of a polyvinyl pyrrolidone (PVP) additive on the physicochemical properties of InVO4. In 2012, Song et al.9 reported that the orthorhombic structure of InVO4 has a higher photocatalytic performance than monoclinic InVO4 for photodegradation of nitrobenzene under visible light irradiation. Moreover, literature reviews show that metal ion-doped InVO4 has improved photocatalytic activity for degrading organic molecules.33,34 Yan et al.33 reported that a Pt–InVO4 photocatalyst exhibited excellent visible-light-driven photocatalytic activity for the degradation of ciprofloxacin (CIP), achieving 98.2% degradation. Surprisingly, only one paper has been published on Cu-doped InVO4.34 It is necessary to study the physical and chemical properties of synthesized photocatalysts, and the influence of doping ions on photocatalytic reactions. In this paper, the effect of copper doping on the physicochemical properties and photocatalytic performance of InVO4 were evaluated. The photocatalytic mechanism of Cu-doped InVO4 was proposed. An understanding of Cu-doped InVO4 will aid the development of modified InVO4 that operates efficiently under visible light.
2 Experimental
2.1 Material synthesis
The starting precursors used to synthesize Cu-doped InVO4 were indium nitrate hydrate (In(NO3)3·xH2O, Sigma-Aldrich, USA, 99.9%), ammonium metavanadate (NH4VO3, Sigma-Aldrich, US, 99%), ammonium hydroxide (NH4OH, Sigma-Aldrich, US, 30%), nitric acid (HNO3, Merck, Germany, 65%), and copper(II) nitrate trihydrate (Cu(NO3)2·3H2O, Sigma-Aldrich, US, 99%).
Firstly, indium nitrate hydrate and ammonium metavanadate were dissolved in deionized water and nitric acid, respectively with a molar ratio of 1![[thin space (1/6-em)]](https://www.rsc.org/images/entities/char_2009.gif) :1. Then, 6.0 M ammonium hydroxide was slowly added to the above solutions to adjust the pH value to 7. The mixture solution was treated at a temperature of 200 °C for 24 h in a Teflon-lined stainless steel autoclave. Finally, the precipitated InVO4 particles were obtained after washing with deionized water by centrifugation at 7000 rpm for 10 min several times until the pH was equal to 7, and drying at 70 °C in air overnight.
:1. Then, 6.0 M ammonium hydroxide was slowly added to the above solutions to adjust the pH value to 7. The mixture solution was treated at a temperature of 200 °C for 24 h in a Teflon-lined stainless steel autoclave. Finally, the precipitated InVO4 particles were obtained after washing with deionized water by centrifugation at 7000 rpm for 10 min several times until the pH was equal to 7, and drying at 70 °C in air overnight.
To achieve doping, a calculated nominal copper content of 0.5–5.0 mol%, from copper(II) nitrate trihydrate as the precursor for copper, was subsequently added to the prepared mixture solution of indium nitrate hydrate and ammonium vanadate. After the mixture was stirred until it was homogeneous, it was placed in a Teflon-lined stainless steel autoclave and heated at 200 °C for 24 h. The resulting precipitates were obtained as previously described above.
2.2 Characterization
The phase compositions of the prepared samples were analyzed using X-ray diffraction (XRD) preformed on a Philips X' Pert MPD with Cu Kα radiation (λ = 0.15406 nm). The specific surface area of the samples was obtained using BET surface area measuring apparatus (autosorb-1MP-Quantachrome) at the boiling point of liquid nitrogen. The microstructure and elemental distribution (In, V, O and Cu) for 1.0 mol% Cu-doped InVO4 were investigated using a scanning electron microscope (SEM, JEOL JSM-5910LV, Japan) and energy dispersive spectroscopy analysis (EDS). A transmission electron microscope (TEM, JEOL JEM-2010) was used to observe the morphology and particle size of the prepared photocatalysts. The UV-vis diffuse reflectance spectra of the samples were measured using a UV-visible spectrophotometer (PerkinElmer Lambda 1050) referenced to MgO. The resulting diffuse reflectance spectra were then converted to absorbance spectra using the Kubelka–Munk function; F(R∞) = [1 − (R∞)]2/2R∞, where F(R∞) is the so-called remission or Kubelka–Munk function and R∞ = Rsample/Rstandard. The band gap energy was then obtained from a plot between 1241/λonset and [F(R∞)hυ]1/2, where h is Planck's constant (6.626 × 10⁻³⁴ m2 kg s−1), and υ is the frequency in Hz.35,36 X-ray photoelectron spectroscopy (XPS) was carried out on an AXIS ULTRADLD, Kratos analytical instrument using nonmonochromatic Al Kα X-rays at 1.4 keV as the excitation source and choosing C 1s (285.6 eV) as the reference line. The photoluminescence (PL) spectra of the photocatalysts were recorded using an AvaSpec-2048TEC-USB2-2 spectrophotometer with LEDs (Oceans optics, LLS-345) as an excitation light source.
2.3 Photodegradation measurements
The photocatalytic activities of the as-prepared pure InVO4 and 0.5–5.0 mol% Cu-doped InVO4 samples were evaluated by observing the photodegradation of MB in aqueous solutions under visible light irradiation (λ ≥ 400 nm), using a 50 W halogen lamp with a glass filter to block UV components. The initial concentration of MB was 2 × 10⁻⁵ M. In each experiment, 0.1 g of the photocatalyst was suspended in an aqueous solution (100 mL) of MB in a slurry reactor. Prior to irradiation, the suspension was stirred in the dark for 30 min to ensure the establishment of an adsorption–desorption equilibrium. At given time intervals of 15 min, 5 mL of the suspension was collected and centrifuged at 7000 rpm for 5 min to remove the catalyst powders. The concentration of MB was then detected by measuring the maximum absorbance at 664 nm using a spectrophotometer. For the stability test, the remaining photocatalyst powder after photocatalytic degradation of MB in suspension was collected by centrifugation, washed with deionized water to remove the residual MB, and then dried before being used in another photocatalytic reaction. This process was repeated five times.
3 Results and discussion
3.1 Material characterization
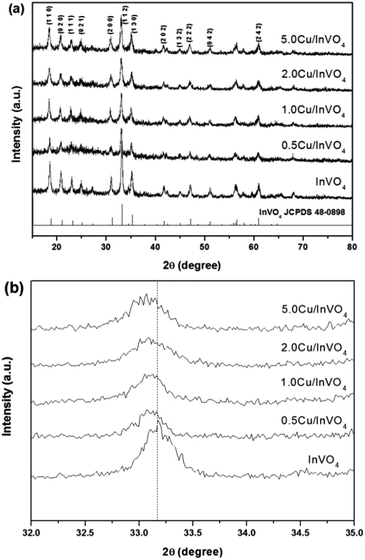
Fig. 1a shows the XRD patterns of the pure InVO4 and 0.5–5.0 mol% Cu-doped InVO4 samples. The diffraction patterns of all the samples were well matched with the orthorhombic phase (JCPDS file no. 48-0898). No other diffraction peaks were observed in the XRD patterns of the Cu-doped InVO4 samples. This suggests that there is no impurity phase formation, which could occur from chemical reactions between Cu and InVO4. The diffraction peak at 33.18° is the main characteristic of the (112) plane of pure InVO4. This peak is slightly shifted towards lower angles with an increasing amount of copper doping, suggesting that In3+ ions (0.80 Å) are substituted for smaller-sized Cu2+ ions (0.73 Å) in InVO4 (Fig. 1b). Moreover, the incorporation of copper ions in the InVO4 lattice caused the expansion of the crystalline planes in the InVO4 crystal structure. The interplanar spacing (dhkl) values of all the samples were calculated from the (112) plane (the dhkl values of all the samples are given in the ESI, Table S1†). The interplanar spacing of the (112) orthorhombic crystallographic plane of the 0.5–5.0 mol% Cu-doped InVO4 samples increased compared with pure InVO4, implying that Cu2+ ions are substituted into the orthorhombic InVO4 lattice. Therefore, disorder of the crystalline structure of the InVO4 samples was promoted by copper substitution.
 |
| | Fig. 1 XRD patterns of pure InVO4 and Cu-doped InVO4 with a nominal copper content of 0.5–5.0 mol% in the 2θ range of (a) 15–80° and (b) 32–35°. | |
The specific surface area of InVO4 was 19.97 m2 g−1 based on the BET method using N2 adsorption, which was lower than that of 1.0 mol% Cu-doped InVO4 (50.50 m2 g−1). In general, the photocatalytic performance depends on many parameters, such as the surface area, adsorption capacity, optical absorption, carrier recombination rate, etc.37,38 A larger surface area in most cases corresponds to a smaller particle size and a higher adsorption capacity, leading to enhanced photocatalytic activity.
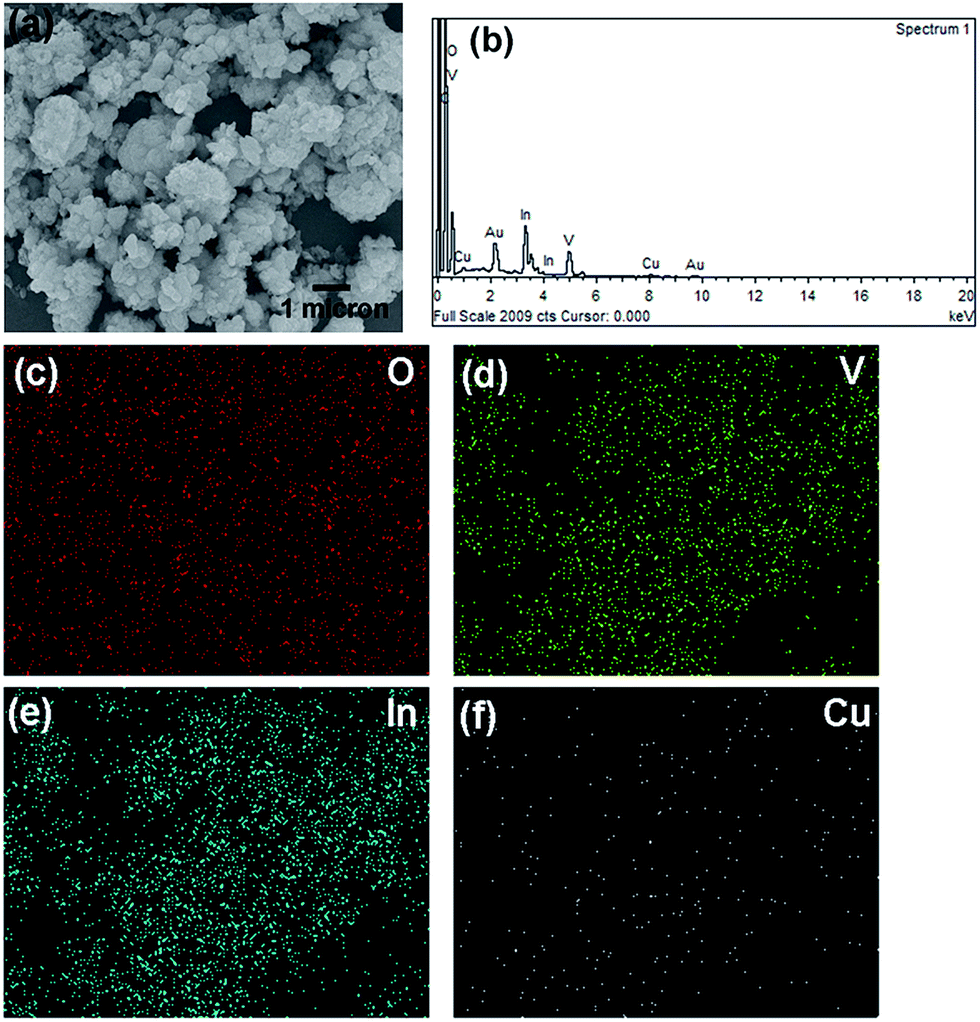
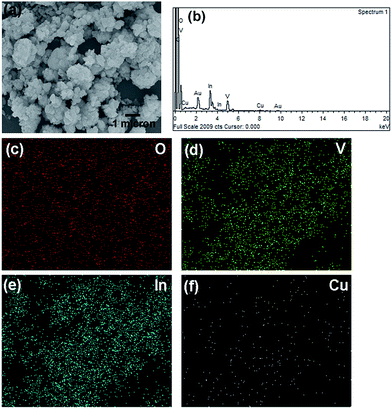
A scanning electron microscope (SEM) image of 1.0 mol% Cu-doped InVO4 is shown in Fig. 2. The average diameter of the agglomerated particles of 1.0 mol% Cu-doped InVO4 is about 100–200 nm. The EDS spectrum of 1.0 mol% Cu-doped InVO4 revealed that the emission peaks correspond to In, V, O and Cu, along with Au and C peaks, which might have come from gold sputtering and the carbon tape used to fix the sample on the sample holder, respectively (Fig. 2b). Fig. 2c–f present the elemental mapping of 1.0 mol% Cu-doped InVO4, indicating the uniform distribution of In, V, O and Cu in the 1.0 mol% Cu-doped InVO4 sample.
 |
| | Fig. 2 (a) SEM image, (b) EDS spectrum, and (c–f) elemental mapping of 1.0 mol% Cu-doped InVO4. | |
Fig. 3 shows the TEM images for pure InVO4 and 1.0 mol% Cu-doped InVO4 after hydrothermal reaction at 200 °C for 24 h. In Fig. 3a, the particle diameters for pure InVO4 were measured to range from 20 nm to 30 nm. The characteristics of the 1.0 mol% Cu-doped InVO4 particles can be observed from Fig. 3b. The particle diameters were determined to be in the range of 15 nm to 20 nm, so the particles are significantly smaller than those of pure InVO4. This may be due to the Cu ions retarding the growth of the crystallites. The lattice fringes of the spherical-like particles of pure InVO4 can be observed in Fig. 3c. The interplanar spacing of InVO4 was found to be d002 = 0.323 nm. The lattice fringe of 1.0 mol% Cu-doped InVO4 corresponds to the d-spacing of 0.216 nm, which is consistent with the spacing of the (202) plane (Fig. 3d).
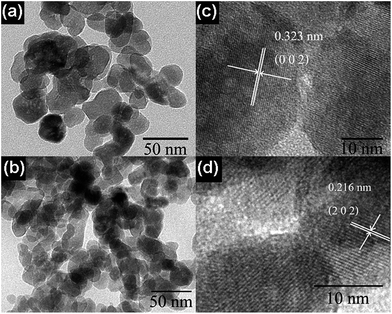 |
| | Fig. 3 TEM images and lattice fringes of (a and c) pure InVO4 and (b and d) 1.0 mol% Cu-doped InVO4. | |
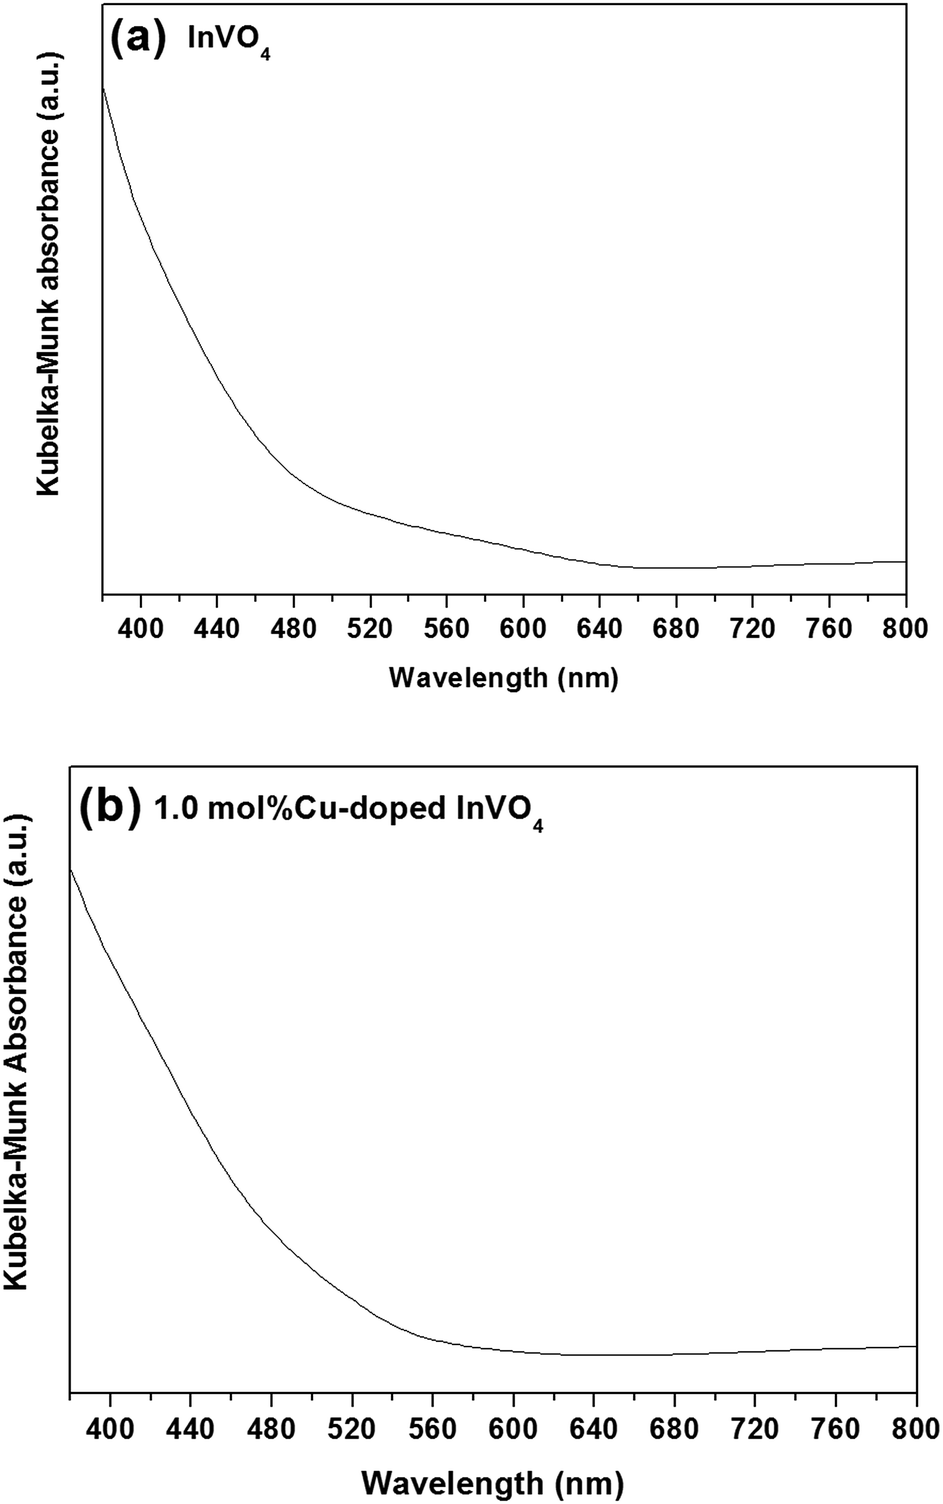
The diffuse reflectance spectra of pure InVO4 and 1.0 mol% Cu-doped InVO4 are shown in Fig. 4. The absorption margin of the 1.0 mol% Cu-doped InVO4 sample dramatically shifts to a longer wavelength, indicating a decrease in the band gap with respect to pure InVO4. The absorption spectra of the pure InVO4 and 1.0 mol% Cu-doped InVO4 samples indicated maximum absorption at 642 nm and 600 nm, which corresponded to band gaps of 1.93 eV and 2.07 eV, respectively (Fig. 4a and b). The differences in absorption between pure InVO4 and 1.0 mol% Cu-doped InVO4 may be due to the different sizes and types of photocatalyst particles present in the samples leading to different light scattering and absorption properties.39,40 The narrow band gap implies that the photocatalytic performance was enhanced under visible light irradiation, as previously reported.41,42
 |
| | Fig. 4 Kubelka–Munk absorbance spectra of the pure InVO4 (a) and 1.0 mol% Cu-doped InVO4 (b) samples. | |
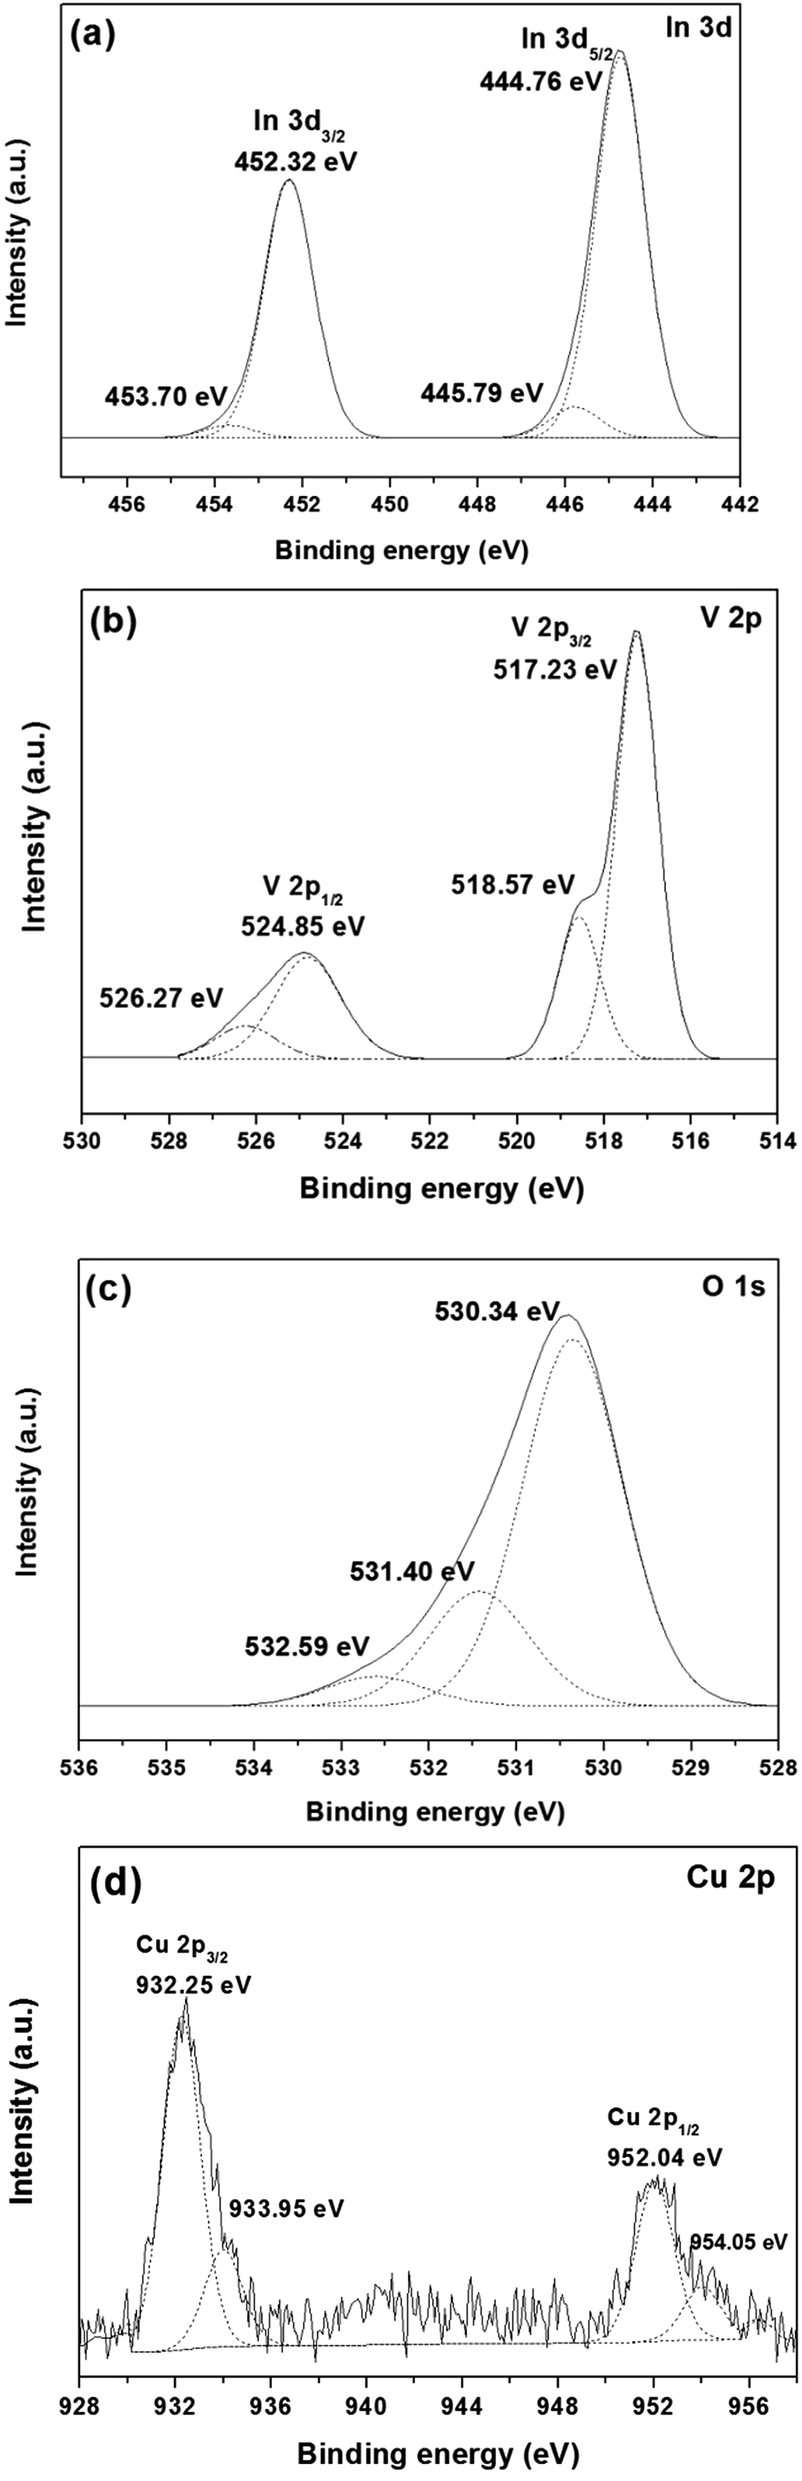
The elemental composition and chemical states of the elements in the samples were analyzed using the XPS technique. Fig. 5a shows the typical In 3d5/2 core level spectrum for 1.0 mol% Cu-doped InVO4, with the peaks at binding energy (BE) values of 444.76 eV and 445.79 eV for In 3d5/2 and In 3d3/2, respectively, assigned to In3+ in InVO4.43,44 For the In 3d region, the peaks of In 3d5/2 and In 3d3/2 at 452.32 eV and 453.70 eV, respectively, corresponded to In3+ species.45 The V 2p core level spectrum is shown in Fig. 5b. The main peaks for V 2p3/2 and V 2p1/2 were present at 517.23 eV and 524.85 eV, respectively, and were attributed to the V5+ oxidation state in InVO4.46 Moreover, the other peaks at about 518.17 eV and 526.27 eV were ascribed to the oxidation state of V4+.47 The reduction of the oxidation state of V from V5+ to V4+ can be explained by the change of oxygen vacancies in the InVO4 structure during the synthesis of the material. Fig. 5c shows the O 1s core level spectrum of 1.0 mol% Cu-doped InVO4. The O 1s peak could be fitted by three components at about 530 eV, 531 eV, and 532 eV, ascribed to lattice oxygen of the metal oxide semiconductor, adsorbed OH groups and H2O, respectively.48,49 As shown in the Cu 2p core-level spectrum (Fig. 5d), the binding energies of Cu at 932.25 eV and 952.04 eV, corresponding to Cu 2p3/2 and Cu 2p1/2, respectively, were attributed to Cu+.50 Moreover, the two characteristic peaks for Cu 2p at 933.95 eV and 954.05 eV corresponding to Cu 2p3/2 and Cu 2p1/2, respectively, indicated that copper also existed in the form of Cu2+.51 Therefore, Cu+ and Cu2+ species coexisted in 1.0 mol% Cu-doped InVO4. The coexistence of Cu+ and Cu2+ in InVO4 could be due to the presence of O-deficient InVO4 particles.14
 |
| | Fig. 5 XPS spectra of (a) In, (b) V, (c) O, and (d) Cu elements for 1.0 mol% Cu-doped InVO4 samples. | |
3.2 Photocatalytic performances
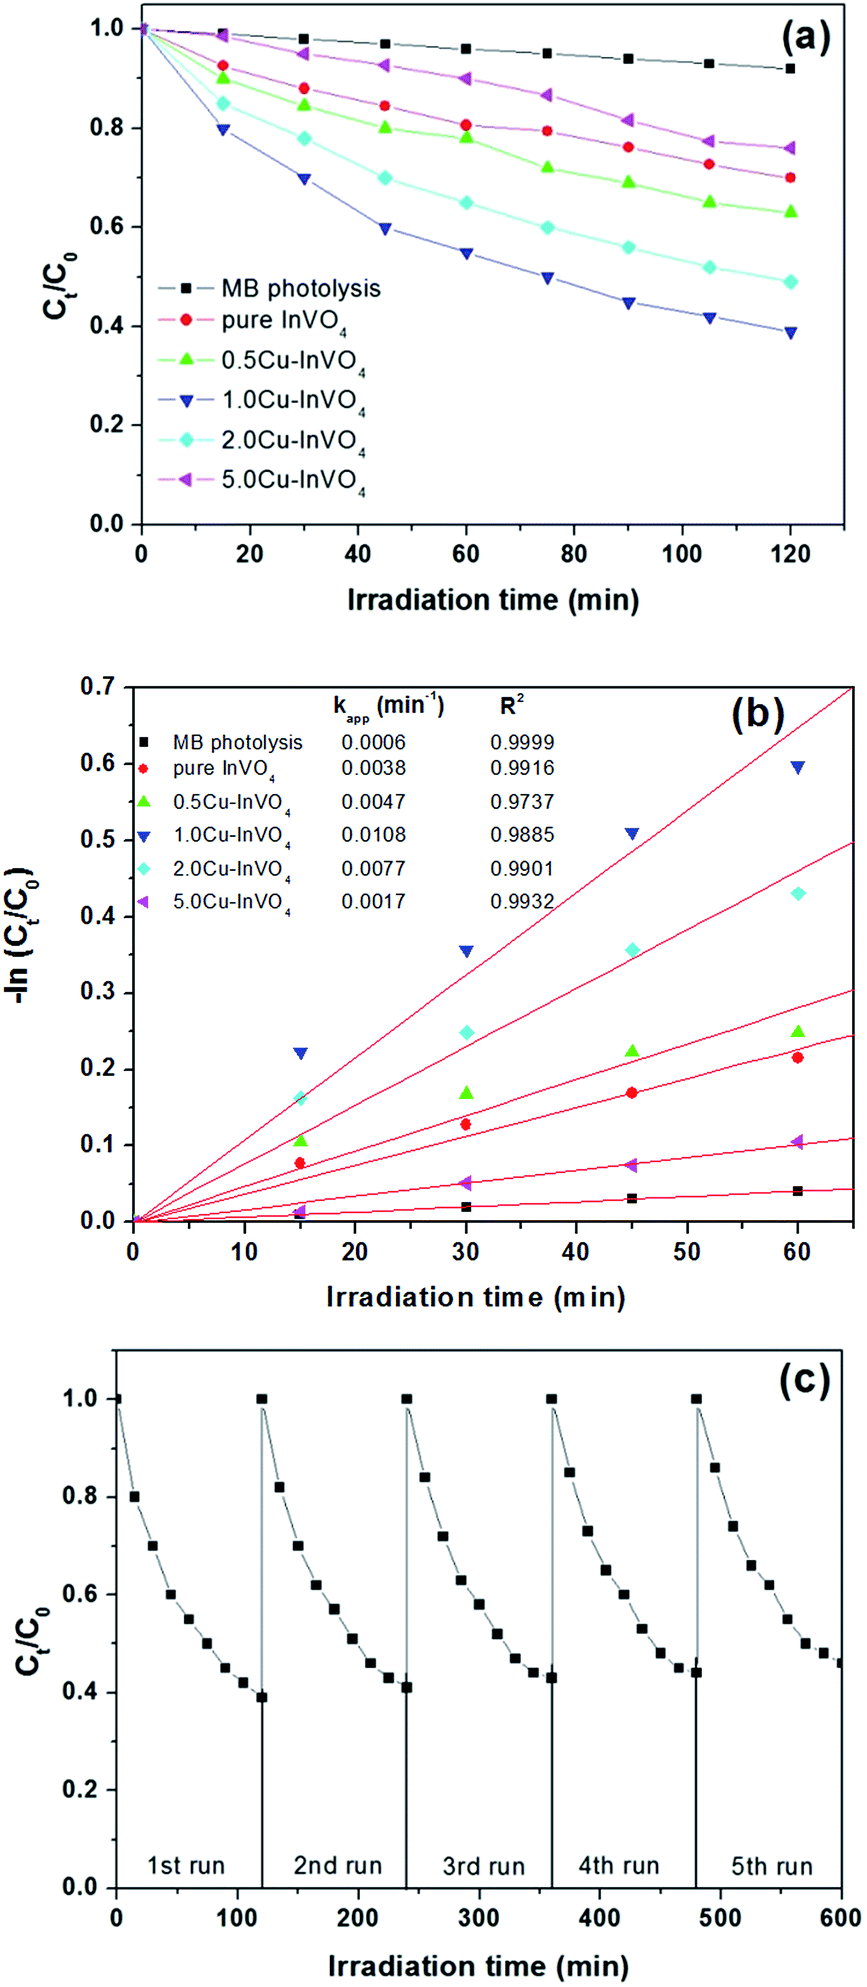
The photodegradation of methylene blue (MB) using InVO4 and 0.5–5.0 mol% Cu-doped InVO4 nanoparticles under visible light irradiation is illustrated in Fig. 6a. A slight decrease in MB concentration was observed in the presence of 0.5–5.0 mol% Cu-doped InVO4. The pure InVO4, and 0.5 mol%, 1.0 mol%, 2.0 mol% and 5.0 mol% Cu-doped InVO4 samples can degrade approximately 8%, 30%, 37%, 61%, 51%, and 23% of MB, respectively under visible light irradiation.
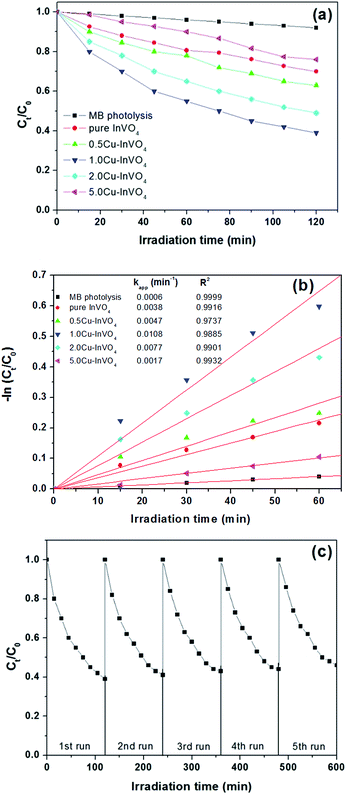 |
| | Fig. 6 (a) Photocatalytic degradation of MB as a function of the irradiation time under visible light for all samples; (b) pseudo first order kinetics fitting data for the photodegradation of MB; (c) recyclability of 1.0 mol% Cu-doped InVO4 in the degradation of MB for 5 cycles. | |
From Fig. 6a and b, the photocatalytic activity initially increases with an increasing level of Cu doping (up to 1.0 mol%) in the InVO4 sample, followed by a decrease in activity with a further increase in the Cu ion level. The increase in MB photodegradation with an increase in the amount of Cu is explained by the ability of the Cu dopant to act as a charge carrier trap site for electrons.52,53 At high Cu dopant concentrations, the distances between the trapping sites for electrons and holes decrease, resulting in an enhanced recombination rate for electron–hole pairs. Therefore, a high level of Cu doping increases the concentration of recombination centers, and consequently the photocatalytic efficiency of InVO4 decreases.54,55 It is notable that the 1.0 mol% Cu-doped InVO4 nanoparticles display better degradation properties than the other samples. Thus, the optimal concentration of Cu doping in InVO4 is favorable for the improvement of the photocatalytic activity in MB degradation. To quantitatively analyze the reaction kinetics of MB degradation, the experimental data in Fig. 6b were fitted using the Langmuir–Hinshelwood model, as expressed by the following equation:56 −dC/dt = kappt, where C is the concentration of MB and kapp is the apparent reaction rate constant. Integration of the above equation will give the concentration as a function of time:57 −ln(Ct/C0) = kappt. From this kinetics analysis, it is evident that the photocatalytic degradation of MB follows pseudo-first order kinetics (Fig. 6b). From the linear fitting curves of −ln(Ct/C0) versus irradiation time (t), the MB degradation rate constant (kapp) was calculated to be 6.0 × 10⁻⁴, 3.8 × 10⁻³, 4.7 × 10⁻³, 10.8 × 10⁻³, 7.7 × 10⁻³, and 1.7 × 10⁻³, min−1 for MB photolysis, and photodegradation with pure InVO4, and 0.5 mol%, 1.0 mol%, 2.0 mol%, and 5.0 mol% Cu-doped InVO4, respectively. Among the different samples, the 1.0 mol% Cu-doped InVO4 sample exhibited the highest kapp value. This Cu-doped InVO4 photocatalyst had significantly enhanced photocatalytic activity compared to the pure InVO4 photocatalyst. To evaluate the stability and reusability of the Cu-doped InVO4 photocatalysts, the 1.0 mol% Cu-doped InVO4 photocatalyst was recycled for 5 runs of photodegradation of MB, as depicted in Fig. 6c. After 5 successive runs with each reaction lasting for 600 min, the degradation efficiency of the 1.0 mol% Cu-doped InVO4 photocatalyst was largely maintained, indicating good stability.
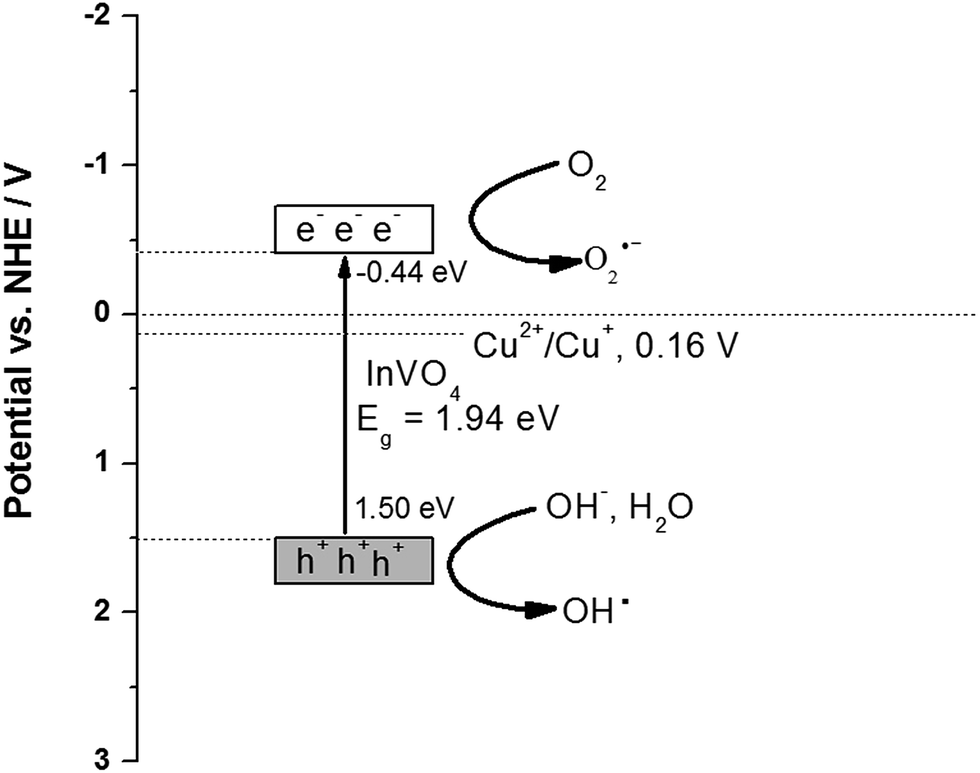
To understand the charge transfer behavior between CeO2 and InVO4, the band edge positions of the conduction band (CB) and the valence band (VB) of InVO4 were calculated using the following equation: E0CB = χ − EC − 0.5Eg,58 where χ is the electronegativity of the semiconductor, EC is the energy of free electrons on the hydrogen scale of 4.5 eV, Eg is the band gap of InVO4, and the χ value of InVO4 is 5.03 eV.59 The valence band energy (EVB) can be calculated using the following equation:60 EVB = ECB + Eg, where ECB is the conduction band energy. The Eg value of InVO4 was evaluated from the UV-vis DRS analysis to be about 1.94 eV. Based on the equation above, the CB and VB edge potentials of InVO4 were calculated to be −0.44 and 1.50 eV, respectively. We further analyzed the photocatalytic mechanism focusing on Cu-doped InVO4 for MB degradation (Fig. 7). When absorbing visible light with photon energy (hυ) equal to or exceeding the band gap, the Cu-doped InVO4 generates electron–hole (e−/h+) pairs at the surface, as shown in (eqn (1)).
| | |
Cu-doped InVO4 + hυ → Cu-doped InVO4 (hVB+ + eCB−)
| (1) |
 |
| | Fig. 7 Schematic of the charge migration and separation on Cu-doped InVO4. | |
The photogenerated holes (hVB+) on the surface of Cu-doped InVO4 can react with adsorbed water (H2O) and hydroxide ions (OH−) to produce hydroxyl radicals (OH˙) (eqn (2) and (3)). At the same time, O2 acts as an electron acceptor to generate a superoxide anion radical (O2˙−) (eqn (4)). The O2˙− radicals then react with hydroperoxyl radicals (HO2˙) to produce hydrogen peroxide (H2O2), subsequently producing hydroxyl radicals (eqn (5) and (6)).
| | |
Cu-doped InVO4 (hVB+) + H2O → OH˙ + H+
| (2) |
| | |
Cu-doped InVO4 (hVB+) + OH− → OH˙
| (3) |
| | |
Cu-doped InVO4 (eCB−) + O2 → O2˙−
| (4) |
| | |
O2˙− + HO2˙ + H+ → H2O2 + O2
| (5) |
The hydroxyl radical is a strong reactive species which can degrade methylene blue through the reaction shown in eqn (7).
| | |
OH˙ + MB → intermediates → degradation products
| (7) |
Moreover, the photogenerated electron–hole pairs can be separated in surface trap states in Cu-doped InVO4. From the XPS results, the Cu2+/Cu+ ions may act as trapping sites. The Cu2+ ions would easily uptake one photogenerated electron from the InVO4 conduction band. As a result, Cu2+ is quickly reduced to Cu+ (Cu2+/Cu+ redox potential = 0.16 V versus NHE).61 Cu+ ions might not be stable in the photocatalysis process. Reoxidation would occur by hole trapping and Cu2+ could be formed. Cu2+/Cu+ ion doping can facilitate efficient charge separation, increase the lifetime of electron–hole separation and support charge carrier transfer to the catalyst surface.
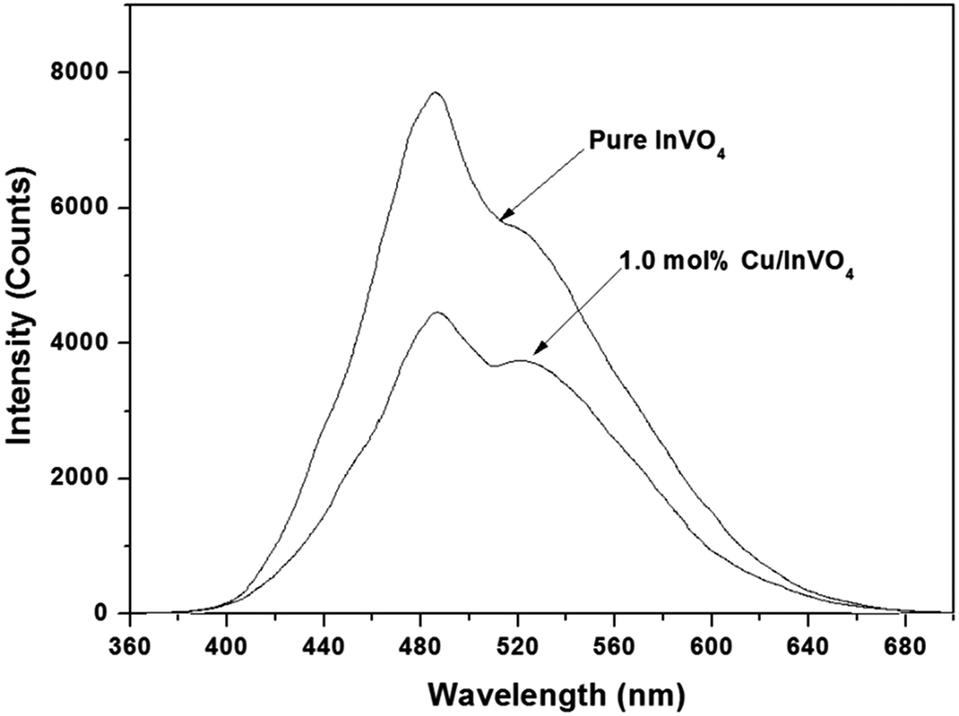
Photoluminescence (PL) spectroscopy is widely used to explore the efficiency of transferring charge carriers in semiconductors, which can reflect the separation and recombination of photogenerated electron–hole pairs. Generally, lower PL signals suggest a slower charge carrier recombination rate and a higher separation efficiency. As shown in Fig. 8, the PL spectrum of 1.0 mol% Cu-doped InVO4 displayed the lowest PL intensity. In contrast, pure InVO4 had a relatively higher PL intensity. This result implies that the recombination rate of photogenerated electron–hole pairs was inhibited after doping with copper.
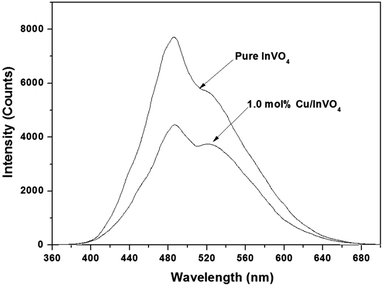 |
| | Fig. 8 PL spectra of pure InVO4 and 1.0 mol% Cu-doped InVO4 samples. | |
The reactive species, such as h+, OH˙ and O2˙−, significantly influence the photocatalytic performance by degrading organic compounds. To clarify the photocatalytic mechanism, the main reactive species were investigated using trapping experiments for MB degradation over 1.0 mol% Cu-doped InVO4. Different quenchers were added in the photocatalytic degradation of MB under visible light irradiation. In this case, isopropanol (2 mM), benzoquinone (BQ, 2 mM), and potassium iodide (2 mM) were employed as hydroxyl radical (OH˙), superoxide radical (O2˙−), and hole (h+) scavengers, respectively. The photocatalytic activity of 1.0 mol% Cu-doped InVO4 significantly decreased when BQ was added, implying that photogenerated superoxide anion radicals were the predominant active species for MB photodegradation, rather than photogenerated hydroxyl radicals or photogenerated holes (Fig. 9).
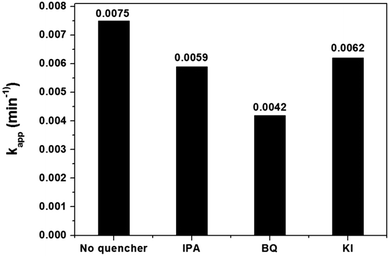 |
| | Fig. 9 Effect of different scavengers on the photocatalytic degradation of MB over 1.0 mol% Cu-doped InVO4 under visible light irradiation. | |
4 Conclusions
Pure InVO4 and 0.5–5.0 mol% Cu-doped InVO4 catalysts were successfully synthesized via a hydrothermal method. The photocatalytic activities of all the samples were evaluated by monitoring the photocatalytic degradation of MB under visible light irradiation. The 1.0 mol% Cu-doped InVO4 photocatalyst exhibited much higher photocatalytic activity than the other samples. The enhanced photocatalytic activities of Cu-doped InVO4 could be ascribed to the efficient separation and migration of photogenerated charge carriers, as well as the decreased recombination probability of electron–hole pairs derived from the Cu doping effect. These experiments demonstrate that Cu-doped InVO4 photocatalysts can be readily produced with the requisite properties for use in water treatment applications, where their photocatalytic properties can be employed in the degradation of emerging environmental pollutants.
Acknowledgements
The authors gratefully acknowledge the financial support from the Thailand Research Fund (TRF) and the Higher Education Commission (CHE), as well as the Materials Science Research Center, Department of Physics and Materials Science, Faculty of Science, Chiang Mai University.
References
- A. Sivakumar, B. Murugesan, A. Loganathan and P. Sivakumar, J. Taiwan Inst. Chem. Eng., 2014, 45, 2300–2306 CrossRef CAS.
- O. Carp, C. L. Huisman and A. Reller, Prog. Solid State Chem., 2004, 32, 42–90 CrossRef.
- Y. Chen, R. Huang, D. Chen, Y. Wang, W. Liu, X. Li and Z. Li, ACS Appl. Mater. Interfaces, 2012, 4, 2273–2279 CAS.
- G. Li, B. Jiang, X. Li, Z. Lian, S. Xiao, J. Zhu, D. Zhang and H. Li, ACS Appl. Mater. Interfaces, 2013, 5, 7190–7197 CAS.
- E. Forgacsa, T. Cserhátia and G. Oros, Environ. Int., 2004, 30, 953–971 CrossRef PubMed.
- S. Bae, S. Kim, S. Lee and W. Choi, Catal. Today, 2014, 224, 21–28 CrossRef CAS.
- H. Zhang, R. Zong, J. Zhao and Y. Zhu, Environ. Sci. Technol., 2008, 42, 3803–3807 CrossRef CAS PubMed.
- A. D. Paola, E. García-López, G. Marcì and L. Palmisano, J. Hazard. Mater., 2012, 211–212, 3–29 CrossRef PubMed.
- L. Song, S. Liu, Q. Lu and G. Zhao, Appl. Surf. Sci., 2012, 258, 3789–3794 CrossRef CAS.
- T. H. Noh, D. W. Kim, S. W. Seo, I. S. Cho, D. H. Kim, H. S. Han and K. S. Hong, Mater. Lett., 2012, 72, 98–100 CrossRef CAS.
- F. Guo, W. Shi, X. Lin, X. Yan, Y. Guo and G. Che, Sep. Purif. Technol., 2015, 141, 246–255 CrossRef CAS.
- X. Lin, D. Xu, J. Zheng, M. Song, G. Che and Y. Wang, J. Alloys Compd., 2016, 688, 891–898 CrossRef CAS.
- J. Shen, X. Li, W. Huang, N. Li and M. Ye, Mater. Res. Bull., 2013, 48, 3112–3116 CrossRef CAS.
- Y. Wang, H. Dai, J. Deng, Y. Liu, Z. Zhao, X. Li and H. Arandiyan, Chem. Eng. J., 2013, 226, 87–94 CrossRef CAS.
- X. Lin, X. Guo, W. Shi, L. Zhao, Y. Yan and Q. Wang, J. Alloys Compd., 2015, 635, 256–264 CrossRef CAS.
- M. Yan, Y. Yan, C. Wang, W. Lu and W. Shi, Mater. Lett., 2014, 121, 215–218 CrossRef CAS.
- K. Vignesh, R. Hariharan, M. Rajarajan and A. Suganthi, Mater. Sci. Semicond. Process., 2013, 16, 1521–1530 CrossRef CAS.
- J. Chaisorn, K. Wetchakun, S. Phanichphant and N. Wetchakun, Mater. Lett., 2015, 160, 75–80 CrossRef CAS.
- J. Shen, H. Yang, Y. Feng, Q. Cai and Q. Shen, Solid State Sci., 2014, 32, 8–12 CrossRef CAS.
- X. Lin, D. Xu, Z. Lin, S. Jiang and L. Chang, RSC Adv., 2015, 5, 84372–84380 RSC.
- X. Lin, X. Guo, W. Shi, F. Guo, G. Che, H. Zhai, Y. Yan and Q. Wang, Catal. Commun., 2015, 71, 21–27 CrossRef CAS.
- J. P. Allen, N. M. Galea, G. W. Watson, R. G. Palgrave, J. M. Kahk, D. J. Payne, M. D. M. Robinson, G. Field, A. Regoutz and R. G. Egdell, J. Phys. Chem. C, 2014, 118, 25330–25339 CAS.
- W.-J. Yin, S.-H. Wei, M. M. Al-Jassim, J. Turner and Y. Yan, Phys. Rev. B: Condens. Matter Mater. Phys., 2011, 83, 155102–155111 CrossRef.
- S. Mahapatra, S. K. Nayak, G. Madras and T. N. G. Row, Ind. Eng. Chem. Res., 2008, 47, 6509–6516 CrossRef CAS.
- A. D. Paola, E. García-López, S. Ikeda, G. Marcì, B. Ohtani and L. Palmisano, Catal. Today, 2002, 75, 87–93 CrossRef.
- B. Hu, F. Cai, T. Chen, M. Fan, C. Song, X. Yan and W. Shi, ACS Appl. Mater. Interfaces, 2015, 7, 18247–18256 CAS.
- Y. Li, M. Cao and L. Feng, Langmuir, 2009, 25, 1705–1712 CrossRef CAS PubMed.
- W. Shi, F. Guo, J. Chen, G. Che and X. Lin, J. Alloys Compd., 2014, 612, 143–148 CrossRef CAS.
- X. Lin, Y. Wang, J. Zheng, C. Liu, Y. Yang and G. Che, Dalton Trans., 2015, 44, 19185–19193 RSC.
- Y. Yan, F. Cai, Y. Song and W. Shi, Chem. Eng. J., 2003, 233, 1–7 CrossRef.
- Z. Ai, L. Zhang and S. Lee, J. Phys. Chem. C, 2010, 114, 18594–18600 CAS.
- J.-M. Yao, C.-K. Lee, S.-J. Yang and C.-S. Hwang, J. Alloys Compd., 2009, 481, 740–745 CrossRef CAS.
- Y. Yan, X. Liu, W. Fan, P. Lv and W. Shi, Chem. Eng. J., 2012, 200–202, 310–316 CrossRef CAS.
- C. S. Enache, D. Lloyd, M. R. Damen and J. Schoonman, J. Phys. Chem. C, 2009, 113, 19351–19360 CAS.
- S. I. Naya, M. Tanaka, K. Kimura and H. Tada, Langmuir, 2011, 27, 10334–10339 CrossRef CAS PubMed.
- M. Khairy and W. Zakaria, Egypt. J. Pet., 2014, 23, 419–426 CrossRef.
- B. Liu, L.-M. Liu, X.-F. Lang, H.-Y. Wang, X. W. Lou and E. S. Aydil, Energy Environ. Sci., 2014, 7, 2592–2597 CAS.
- F. Chen, P. Fang, Z. Liu, Y. Gao, Y. Liu, Y. Dai, H. Luo and J. Feng, J. Mater. Sci., 2013, 48, 5171–5179 CrossRef CAS.
- J. D. Eversole and H. P. Broida, Phys. Rev. B: Solid State, 1977, 15, 1644–1655 CrossRef CAS.
- J. Ye, Z. Zou, M. Oshikiri, A. Matsushita, M. Shimoda, M. Imai and T. Shishido, Chem. Phys. Lett., 2002, 356, 221–226 CrossRef CAS.
- H. Yan, X. Wang, M. Yao and X. Yao, Prog. Nat. Sci., 2013, 23, 402–407 CrossRef.
- G. Yan, H. Shi, H. Tan, W. Zhu, Y. Wang, H. Zang and Y. Li, Dalton Trans., 2016, 45, 13944–13950 RSC.
- N. Cimino, F. Artuso, F. Decker, B. Orel, A. ŠurcaVuk and R. Zanoni, Solid State Ionics, 2003, 165, 89–96 CrossRef CAS.
- A. Abrutis, L. Parafianovic, V. Kazlauskiene, V. Kubilius, G. Sauthier and A. Figueras, Surf. Coat. Technol., 2010, 204, 3864–3870 CrossRef CAS.
- S.-W. Cao, J. Fang, M. M. Shahjamali, F. Y. C. Boey, J. Barber, S. C. J. Loo and C. Xue, RSC Adv., 2012, 2, 5513–5515 RSC.
- G. Xiao, X. Wang, D. Li and X. Fu, J. Photochem. Photobiol., A, 2008, 193, 213–221 CrossRef CAS.
- Y. Wang, H. Dai, J. Deng, Y. Liu, Z. Zhao, X. Li and H. Arandiyan, Chem. Eng. J., 2013, 26, 7–94 Search PubMed.
- Z. Jiang, Y. Liu, T. Jing, B. Huang, X. Zhang, X. Qin, Y. Dai and M.-H. Whangbo, J. Phys. Chem. C, 2016, 120, 2058–2063 CAS.
- K. Song, J. Zhou, J. Bao and Y. Feng, J. Am. Ceram. Soc., 2008, 91, 1369–1371 CrossRef CAS.
- H. W. P. Carvalho, M. V. J. Rocha, P. Hammer and T. C. Ramalho, J. Mater. Sci., 2013, 48, 3904–3912 CrossRef CAS.
- J. Yu, Y. Hai and M. Jaroniec, J. Colloid Interface Sci., 2011, 357, 223–228 CrossRef CAS PubMed.
- Z. Luo and Q. H. Gao, J. Photochem. Photobiol., A, 1992, 96, 367–375 CrossRef.
- A. Murashkina, P. D. Murzin, A. V. Rudakova, V. K. Ryabchuk, A. V. Emeline and D. W. Bahnemann, J. Phys. Chem. C, 2015, 119, 24695–24703 CAS.
- S. M. Gupta and M. Tripathi, Chin. Sci. Bull., 2011, 56(16), 1639–1657 CrossRef CAS.
- O. Ola and M. M. Maroto-Valer, J. Photochem. Photobiol., C, 2015, 24, 16–42 CrossRef CAS.
- C.-R. Lee, H. S. Kim, I.-H. Jang, J.-H. Im and N.-G. Park, ACS Appl. Mater. Interfaces, 2011, 3, 1953–1957 CAS.
- S. Khezrianjoo and H. D. Revanasiddappa, Chem. Sci. J., 2012, CSJ-85, 1–8 Search PubMed.
- H. Q. Jiang, H. Endo, H. Natori, M. Nagai and K. Kobayashi, Mater. Res. Bull., 2009, 44, 700–706 CrossRef CAS.
- F. Guo, W. Shi, X. Lin, X. Yan, Y. Guo and G. Che, Sep. Purif. Technol., 2015, 141, 246–255 CrossRef CAS.
- G. Magesh, B. Viswanathan, R. P. Viswanath and T. K. Varadarajan, Indian J. Chem., Sect. A: Inorg., Bio-inorg., Phys., Theor. Anal. Chem., 2009, 48, 480–488 Search PubMed.
- Y. Nosaka and A. Y. Nosaka, J. Phys. Chem. Lett., 2016, 7, 431–434 CrossRef CAS PubMed.
Footnote |
| † Electronic supplementary information (ESI) available. See DOI: 10.1039/c6ra27138c |
|
| This journal is © The Royal Society of Chemistry 2017 |
Click here to see how this site uses Cookies. View our privacy policy here. 
 Open Access Article
 This Open Access Article is licensed under a Creative Commons Attribution-Non Commercial 3.0 Unported Licence
 *a,
Pimonrat Wanwaena,
Sukon Phanichphantb and
Khatcharin Wetchakunc
*a,
Pimonrat Wanwaena,
Sukon Phanichphantb and
Khatcharin Wetchakunc