 Open Access Article
Electronic properties of TiO2-based materials characterized by high Ti3+ self-doping and low recombination rate of electron–hole pairs†
A. Aronne *af,
M. Fantauzzib,
C. Imparatoa,
D. Atzeib,
L. De Stefanoc,
G. D'Erricod,
F. Sanninoef,
I. Rea
 c,
D. Pirozziaf,
B. Elsenerbg,
P. Pernicea and
A. Rossi
 b
b
aDipartimento di Ingegneria Chimica, dei Materiali e della Produzione Industriale, Università di Napoli Federico II, Piazzale Tecchio, 80, I-80125, Napoli, Italy. E-mail: anaronne@unina.it
bDipartimento di Scienze Chimiche e Geologiche, Università di Cagliari, S.S. 554 Bivio per Sestu, I-09042 Monserrato, Cagliari, Italy
cIstituto per la Microelettronica e Microsistemi, Consiglio Nazionale delle Ricerche, Via P. Castellino 111, I-80131, Napoli, Italy
dDipartimento di Scienze Chimiche, Università di Napoli Federico II, Complesso Universitario M.te S. Angelo, Via Cintia, 4, I-80126, Napoli, Italy
eDipartimento di Agraria, Università di Napoli Federico II, Via Università 100, I-80055, Portici, Italy
fCentro Interdipartimentale di Ricerca sulla Risonanza Magnetica Nucleare per l'Ambiente, l'Agro-Alimentare ed i Nuovi Materiali (CERMANU), Università di Napoli Federico II, Via Università 100, I-80055, Portici, Italy
gETH Zurich, Institute for Building Materials, ETH Hönggerberg, CH-8093 Zurich, Switzerland
First published on 12th January 2017
Abstract
Factors tuning the functional performances of the various TiO2-based materials in the wide range of their possible applications are poorly understood. Here the electronic structure of TiO2-based materials characterized by Ti3+ self-doping, obtained by a sol–gel route wholly performed in air at room temperature, is reported. In the amorphous hybrid TiO2–acetylacetonate (HSGT) material the formation of the Ti(IV)–acac complex makes it photoresponsive to visible light and allows us to obtain by means of a simple annealing in air at 400 °C a very stable black Ti3+ self-doped anatase TiO2 nanomaterial (HSGT-400), characterized by an extraordinary high concentration of Ti atoms with oxidation states lower than IV (about 26%), which absorbs light in the entire visible range. The very high stability of HSGT-400 is mainly related to the process, which does not require the use of harsh conditions nor external reducing agents. The electronic structure of HSGT, owing to the presence of the Ti(IV)–acac complex, allows the stabilization of superoxide anion radicals on its surface for a very long time (months) at room temperature. The extraordinary low recombination rate of electron–hole pairs gives to HSGT unusual catalytic performances at room temperature allowing the complete removal of 2,4-dichlorophenol from water in about one hour without any light irradiation. Our results clearly highlight the connection among the production process of TiO2-based materials, their electronic structure and, finally, their functional behaviour.
Introduction
TiO2 based materials are currently considered as the most promising photocatalysts for various important reactions, such as oxidative degradation of organic pollutants in environmental remediation, solar chemical conversion in processes as water splitting, CO2 reduction and dye sensitized solar cell production, due to their chemical stability, non-toxicity and high reactivity.1–5 However, owing to the wide band-gaps typical of the three common natural TiO2 polymorphs, namely anatase, rutile and brookite (3.0–3.2 eV), the optical absorption of these materials is limited to the ultraviolet region of the solar spectrum, resulting inadequate for solar energy conversion (less than 5%). Moreover, in photo-chemical applications TiO2 based materials are also characterized by a low quantum efficiency as a consequence of the high recombination rate of photo-generated electron–hole pairs. Therefore, overcoming these drawbacks could pave new ways to improve the photocatalytic performances of the material. Different strategies to make visible light-responsive TiO2 based materials were recently proposed in literature.2,4,6–13 All of them are based on the modification of the electronic band structure of TiO2. In particular, doping with metal or non-metal ions, sensitization by organic molecules, the formation of heterojunctions either with other semiconductors with lower band-gap, such as metal oxides and chalcogenides,2,6 or with graphene oxide have been suggested.7 Intermediate energy states between valence (VB) and conducting (CB) band were originated by doping producing a narrowing of the TiO2 band-gap, whereas the surface adsorption of organic molecules can occur in two different sensitization mechanisms.4,8 In the first one, relatively large dye molecules are adsorbed onto an oxide surface and electronic transition between HOMO and LUMO levels of dye molecules occurs by absorbing a visible light photon. Electrons are then injected from the excited dye molecule into the conduction band of the semiconductor. In the second mechanism, relatively small organic molecules adsorbed on the oxide surface form a charge transfer (CT) complex that absorbs in the visible region at energy lower than either the chelating molecules or the oxide particles. In this case, direct injection of an electron from the ground state of the molecule into the CB of the oxide occurs without involvement of any excited molecular state (ligand-to-metal charge transfer, LMCT, process).4,8 An alternative way to modify the electronic structure of TiO2 was recently proposed.9–11 It was based on the self-structural modifications, involving self-doped Ti3+/oxygen vacancy, or incorporation of H-doping, induced by a reduction treatment generally obtained under harsh and costly conditions that require the strict control of the reaction atmosphere. Depending on the reduction degree different TiO2 coloration was obtained e.g. yellow, blue, black. As a large concentration of Ti3+ is required to induce a continuous vacancy band of electronic states just below the CB of TiO2, black titania nanomaterials are generally prepared.9–11 Beyond solid-state reduction-based methods, Ti3+ and oxygen vacancies have been also obtained using solution-based process in which either the starting solution of the titanium precursor (TiH2) was oxidized with H2O2 forming a yellow gel that was subsequently annealed at 630 °C in argon atmosphere to obtain black Ti3+ self-doped titania12 or the starting solution of the titanium precursor (Ti(OC3H7)4) was continuously irradiated with UV light at 254 nm for 8 hours obtaining a yellow TiO2 gel.13 Alternatively, blue Ti3+ self-doped anatase-rutile TiO2 was prepared starting from an acidic solution of TiCl3 and titanium isopropoxide following hydrothermal treatment at 180 °C.14The dopant leaching, the low efficiency from dopant-induced charge recombination and/or traps and the dopant-induced thermal instability constitute the most important inconvenient for the doped TiO2 material. On the other hand the ease of oxidation of Ti3+ ions as well as the thermal instability of the oxygen vacancies are the main drawbacks of the self-doped TiO2 materials.
Recently a hybrid yellow-coloured TiO2–acetylacetonate material (HSGT), was synthesized by a hydrolytic sol–gel route by some of the authors.15 This amorphous material showed a considerable absorption of visible light (2.5 eV) and on its surface the superoxide radical was stably adsorbed at room temperature for very long time (months). These unusual characteristics finally make this material a useful catalyst in the oxidative degradation of phenanthrene resulting in a fast degradation rate in absence of any light irradiation.15 The aim of this work is to investigate the electronic structure of HSGT and its variation following the heat treatment at 400 °C in air (HSGT-400), that produces a black TiO2 nanomaterial characterized by a very high stability. Several complementary spectroscopic techniques, such as X-ray photoelectron (XPS), steady-state photoluminescence (PL), electron paramagnetic resonance (EPR) and ultra-violet and visible light diffuse reflection (UV-Vis-DRS) spectroscopy, were used in order to understand the interfacial charge transfer pathway of carriers (electron/holes pairs) occurring in these materials with the formation of the superoxide anion radical (O2˙−) as well as the specific role of the organic component in determining the formation and the relative stabilization of both Ti3+ and O2˙−. The superoxide anion radical is a reactive oxygen species (ROS) but, in this case, is stably adsorbed on the surface of HSGT. On the other hand, the very slow recombination rate of charge pairs in HGST is the precondition for its enhanced catalytic activity, that in this paper was tested for the oxidative degradation of 2,4-dichlorophenol (2,4-DCP) without any light irradiation. These chlorophenol pollutants represent a significant class of environmental water contaminants, classified as first-degree toxic pollutants by the US Environmental Protection Agency (EPA) and EC Environmental Directive (2455/2001/EC).
Here the hybrid sol–gel TiO2–acetylacetonate material was prepared modifying the sol–gel route previously adopted.15 In this case all stages of the procedure were performed at room temperature, avoiding the heating at 50 °C, in order to make it simpler and eco-friendlier than the previous one.
Results and discussion
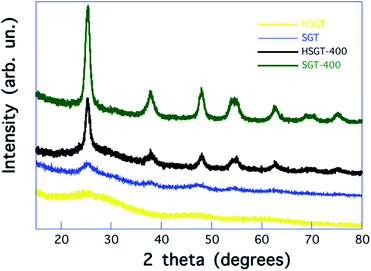
The influence of β-diketones, including Hacac, on the hydrolysis of metallic alkoxides has been widely studied.16–19 According to the Hacac/Ti molar ratio (ρ) values, different heteroleptic alkoxide complexes have been characterized, that can stabilize the sol allowing the formation of chemical homogeneous gels. Two mechanisms have been proposed to explain the sol stabilization. A first mechanism is based on the hypothesis that a kinetic control is exerted by modifying chelating ligand on hydrolysis and polycondensation reactions of metal alkoxide. According to this mechanism, chelating ligands block the Ti4+ coordination sites decreasing the rate of hydrolysis and polycondensation.16–18 A more recent interpretation has been suggested by Kessler et al.19 According to this, chelating ligands increase the rate of hydrolysis and polycondensation giving nanoparticles, formed by oxo-clusters (core) containing acetylacetonate (acac) ligands on the surface (shell), that exhibit a structure typical of micelles. The stabilization of sol is obtained as a consequence of the interfacial activity of these micelles.19 In our experimental procedure, ρ = 0.4 was used, allowing the formation of a homogeneous gel (HSGT) at room temperature quickly, in a few seconds after the addition of the aqueous solution.15 For higher ρ values stable sols were formed, without gelation nor significant precipitation even after several days. On the contrary, when the Hacac was not used, the instantaneous precipitation of a particulate gel (SGT) occurred.The amorphous nature of HSGT was ascertained by the analysis of its powder X-ray diffraction (PXRD) pattern displayed in Fig. 1, where are also reported the PXRD patterns of the other investigated samples. The early crystallization of TiO2 anatase occurs for SGT forming nanocrystals whose mean size is about 3 nm. The heat treatment causes the removal of the acetylacetone as well as the crystallization of TiO2 anatase nanocrystals (about 12 nm) for the HSGT-400, while the growth of TiO2 anatase nanocrystals (about 10 nm) takes place for SGT-400.
The structural characteristics of HSGT obtained by the adopted synthesis procedure, that was fully performed at room temperature, do not differ from the ones of the hybrid material previously synthesized.15 As matter of fact the FTIR spectrum of HSGT (Fig. S1†) displays the characteristic splitting (Δ) between the asymmetric (νasyC![[double bond, length as m-dash]](https://www.rsc.org/images/entities/char_e001.gif) O) and symmetric (νsymC
O) and symmetric (νsymC![[double bond, length as m-dash]](https://www.rsc.org/images/entities/char_e001.gif) O) stretching of C
O) stretching of C![[double bond, length as m-dash]](https://www.rsc.org/images/entities/char_e001.gif) O bonds of the carboxylate groups (Δ = 145 cm−1), attesting the existence of a bidentate interaction between the acac ligand and Ti4+ in the Ti–acac complexes.15
O bonds of the carboxylate groups (Δ = 145 cm−1), attesting the existence of a bidentate interaction between the acac ligand and Ti4+ in the Ti–acac complexes.15
A confirmation of the Ti–acac complex formation is provided by the C1s signal (Fig. 2), resolved in its components using the curve fitting parameters of the C1s signal of titanyl acetylacetonate used as reference compound (Fig. S2 and Table S1†). C1s peak recorded for the HSGT sample showed the presence of sp2, sp3 and C–O components,20 due to the acac ligand, together with some carbon contamination which is usually present when the sample is exposed even for short time to the laboratory atmosphere. Carbon contamination is detected also for samples SGT, SGT-400 and HSGT-400 (Fig. 2).
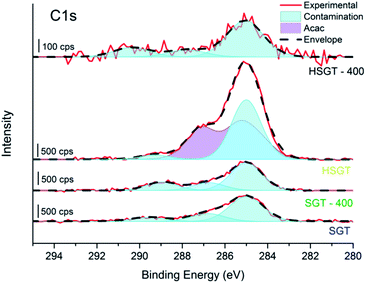 | ||
| Fig. 2 High-resolution C1s spectra of SGT, SGT-400, HSGT and HSGT-400. The components due to the acac ligand are shown in violet while in light blue the contribution of C-contamination is presented. | ||
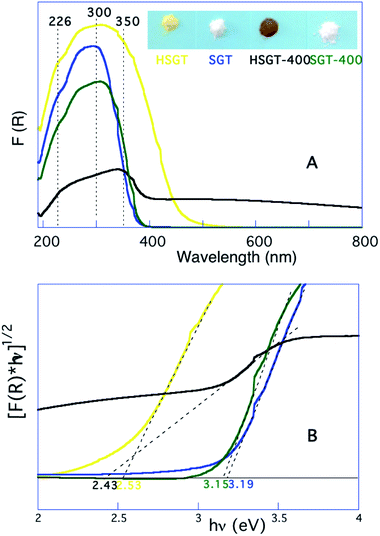
Therefore, HSGT can be described as a polymeric network of titanium oxo-clusters, on the surface of which part of Ti4+ ions are involved in strong complexation with acac ligands. On the other hand both the yellow-brown coloration of the powdered HSGT, clearly seen in the inset of Fig. 3A, and the related absorption in the visible range (Fig. 3A) testify the presence of the above complexation equilibrium. The UV-Vis DRS spectrum of HSGT is characterized by a shoulder-like queue in the visible region up to about 600 nm and the corresponding energy gap value of 2.53 eV (about 500 nm), evaluated by linearization of the plot of (F(R)hν)1/2 against hν (Fig. 3B),21 clearly indicates that the presence of the Ti–acac complex causes a marked lowering of the band-gap value (2.53 eV) with respect to the sample without acac (SGT).22 For this white colored material the evaluated optical band-gap is 3.19 eV (about 385 nm) for the transition from the valence band (VB) to conduction band (CB), i.e. related to the charge transfer transition from O2− to Ti4+. This value is very close to the SGT-400 one (3.15 eV) and both well agree with the band-gap of anatase nanoparticles. The annealing in air at 400 °C for one hour of the hybrid material (HSGT-400), on the contrary, produces a remarkable result: the material absorbs in the entire visible range (Fig. 3A). Consequently its color changes from yellow-brown to black (inset of Fig. 3A). For the first time a stable black TiO2 nanomaterial was obtained by a simple heating in air at 400 °C without using any synthetic approaches reported in literature, such as hydrogen reduction at high pressure or under plasma conditions,23 annealing in inert atmosphere and/or vacuum,24,25 external organic26 or inorganic27 reductants. For this material the evaluated band-gap value, 2.43 eV, suggests the presence of midgap electronic states related to Ti3+,28–30 whose presence was confirmed by XPS analysis (see below).
The surface composition of the SGT and HSGT samples, both dried and heat-treated in air at 400 °C for 1 hour, was determined by XPS analysis. The survey spectra (Fig. S3†) showed that on the surface of the samples only Ti and O were detected together with small amounts of carbon. The quantitative composition, calculated taking into account the Ti2p (with its shake-up satellites) and the O1s signals, is reported in Table 1. All the samples showed a composition close to the stoichiometric one (Ti = 33.3 at%; O = 66.7 at%), and among the samples the composition closest to the expected one is achieved by the SGT-400, while the lowest oxygen content was found for the HSGT-400.
| Sample | Composition [at%] | Ti2p3/2 BE [eV] | Peak area [%] | VB edge [eV] | VB offset [eV] |
|---|---|---|---|---|---|
| SGT-400 | Ti = 32 (1) | Ti(IV): 459.1 (0.1) | 100 | 3.7 | 3.0 |
| O = 68 (1) | |||||
| SGT | Ti = 30.0 (0.7) | Ti(IV): 459.3 (0.1) | 91 (3) | 4.2 | 3.3 |
| O = 70.2 (0.2) | Ti(III): 457.5 (0.1) | 9 (3) | |||
| HSGT | Ti = 30.2 (0.4) | Ti(IV): 459.0 (0.1) | 94 (1) | 3.9 | 3.0 |
| O = 69.8 (0.4) | Ti(III): 457.1 (0.1) | 6 (1) | |||
| HSGT-400 | Ti = 35 (1) | Ti(IV): 459.3 (0.1) | 74 (1) | 4.3 | 3.3 |
| O = 65 (1) | Ti(III): 457.3 (0.1) | 16 (1) | |||
| Ti (?): 455.8 (0.1) | 10 (1) |
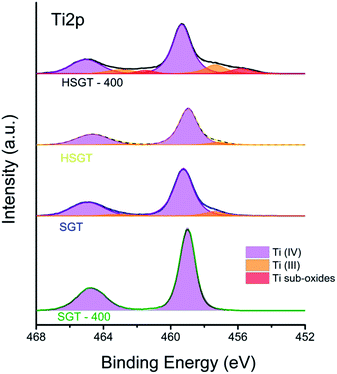
X-ray photoelectron spectroscopy allows also the identification of the oxidation states of the elements. A detailed inspection of the high-resolution Ti2p spectra (Fig. 4) showed that the signals were multi-component except for the SGT-400. The binding energy of the Ti2p3/2 peak was found to be 459.1 eV in this sample and it is assigned to Ti(IV) in TiO2 according to literature.30,31 Together with Ti(IV) also Ti(III), at about 457.3 eV was present at the surface the samples SGT, HSGT and HSGT-400.32 In the last sample also a third component was observed, at lower BE values (455.8 eV). This component might be assigned to Ti oxides with stoichiometry between Ti2O3 and TiO, being the literature BE value for TiO at 455.1 eV.33 Although both dried gels contain a comparable amount of Ti3+ their electronic spectra and the related coloration are different confirming that the responsive-light visible behaviour of HSGT is mainly due to the presence of Ti–acac complex. On the other hand the acetylacetone plays a key role also in the stabilization of O2˙− on the surface of HSGT later on discussed as well as in the formation of Ti lower oxidation states. As a matter of fact the annealing in air at 400 °C for one hour gives two opposite results for SGT and HSGT. For the former the complete oxidation of Ti3+ to Ti4+ occurs giving the SGT-400 sample (see Table 1) that keeps the white colour. On the contrary for the hybrid gel the removal of the acetylacetone supplies reducing organic molecules that induces a strong reduction of Ti to lower oxidation states giving the HSGT-400 black sample in which the atomic ratio O2−/Ti(IV) reaches the 1.5 value with respect to 2, the stoichiometric one (see Table 1). Turning to both dried gels the presence in solution of a large amount of 1-propanol makes reducing the reaction environment giving the formation of oxidation products (aldehydes) allowing reduction in some extent of Ti(IV) to Ti(III).
Since XPS valence band provides information on the total density of states of the samples, the shift in the valence band edge well agrees with the evaluation of the band gap values by UV-Vis DRS spectra. As a consequence of the heat treatment the energy level of the VB was shifted towards a higher value going from 3.9 eV (HSGT) to 4.3 eV (HSGT-400) for the hybrid sample giving a lowering of the band-gap; on the contrary the annealing at 400 °C in air for one hour produces a decrease of the VB energy level going from 4.2 eV (SGT) to 3.7 eV (SGT-400) for the sample without acetylacetone resulting in an increase of the band-gap.
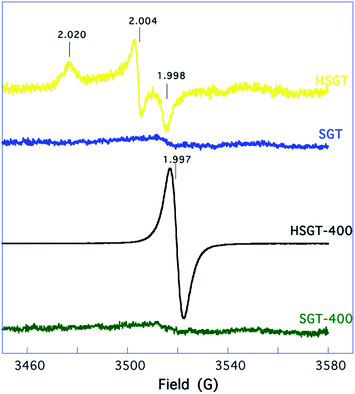
The HSGT EPR spectrum, reported in Fig. 5, shows the orthorhombic signal already observed by us and ascribed to O2˙− superoxide anion radicals adsorbed on the surface of the hybrid gel-derived TiO2 material.15 The g-tensor of this spectrum is gxx = 1.998, gyy = 2.004, gzz = 2.020, whereas the signal intensity corresponds to a concentration of paramagnetic centers of ∼2 × 10¹⁵ spin per g. O2˙− is a very reactive and short-lived species whose EPR signal has been observed for solid or amorphous materials subjected to drastic treatments.34 To our knowledge, HSGT is the only material for which the formation and the stable adsorption of O2˙− radicals for simple exposure to air in the dark at room temperature has been reported in the literature. The SGT sample is almost EPR-silent, see Fig. 5. Thus, our results show that acac ligands play a fundamental role not only in generating, but also in stabilizing O2˙− species on the HSGT surface. Similar conclusions were drawn, by combining experimental results and first-principles calculations, for the related hybrid zirconia–acetylacetone gel-derived material (HSGZ).35
Specifically, we demonstrated that the adsorbed oxygen species retain half of their original magnetic moment, thus proving the formation of superoxide radical ion O2˙−. We recorded EPR spectra also on HSGT-400 and SGT-400 samples, see Fig. 5. The latter is EPR-silent while the former shows only an intense single peak at g = 1.997. Quantitatively, the concentration of paramagnetic centers increases to ∼2 × 10¹⁷ spin per g. In a recent work, a similar EPR signal was observed at room temperature for titanium-defected anatase, and tentatively ascribed to metal vacancies.36 Alternatively, the same signal, obtained for blue reduced anatase-rutile TiO2 (ref. 14) or anatase microspheres37 or for black brookite single-crystalline nanosheets,38 was interpreted as due to the presence of Ti3+ in the sample. This interpretation is supported by detailed EPR studies conducted on TiO2 polymorphs, showing signals with g components ranging between 1.94 and 1.99.39,40 In our case, analogously to the above mentioned cases,14,37,38 the presence of a single broad signal, lacking g anisotropy, could be related to the nanoscopic structure of the sample, and ascribed to Ti3+.
This interpretation is supported by the XPS data, showing a higher Ti3+ content in HSGT-400. Anyhow, no evidence of O2˙− formation is observed, thus showing beyond any doubt that acac ligands are necessary to form and stabilize the superoxide anion radicals on the material surface and, at the same time, showing the very high stability, from the surface to the inner side of the sample, of the black Ti3+ self-doped anatase TiO2 (HSGT-400). It is interesting to observe that no Ti3+ signal is observed in the SGT-400 and HSGT spectra. For these materials XPS analysis has shown incontrovertibly the presence of Ti3+. This apparent incongruence could be related to the fact that XPS probes the material surface, while EPR monitors the entire material bulk. Thus our data point to HSGT-400 as the only considered material presenting Ti3+ throughout the bulk.
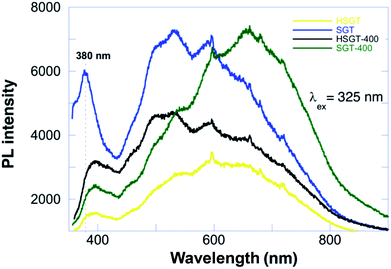
Photoluminescence (PL) can deeply characterize the structure and surface features of metal oxides, due to high sensitivity and non-invasiveness. Furthermore, the PL emission is strongly related to charge carriers trapping and transfer, since after electron–hole pair recombination photons are emitted, thus giving insight of the fate of electron–hole pairs and also of the electronic structure, optical and photochemical properties, included surface oxygen vacancies and defects. PL spectra of anatase TiO2 materials are usually attributed to three kinds of physical origins: self-trapped excitons, oxygen vacancies and surface states (defects).41 Steady-state PL spectra of investigated samples with excitation wavelength at 325 nm are reported in Fig. 6. SGT showed a PL peak at about 380 nm, which originates from the recombination of photoexcited electron–hole pairs, corresponding to energy of 3.26 eV that well matched the band-gap energy of anatase.
The broad emission peak in visible range had a violet-blue component, ascribed to indirect band edge, allowed transitions and self-trapped excitons localized in TiO6 octahedra. The self-trapped exciton is caused by the interaction of conduction band electrons localized on Ti3d orbital with holes in the O2p orbital of TiO2. Violet-blue bands are currently assigned to shallow trap state near absorption band edge emission, corresponding to the presence of oxygen vacancies. Oxygen vacancy is an intrinsic defect in oxides lattice, in the present case associated with Ti3+ in anatase TiO2,42 which can easily trap the electrons/holes and create the intermediate energy states in the forbidden gap.
These states act as active centres in luminescence generation. The green emission corresponds to the deep-trap states far below the band edge emissions and are defined as surface state emissions. These charge carriers are generally trapped by oxygen vacancies and surface hydroxyl groups, which contribute to visible luminescence.43 PL spectrum of HSGT sample was characterized by a band-gap peak shifted towards greater wavelengths, namely from 380 nm to 395 nm (3.14 eV), with respect to SGT, that is due to a structural change in the material. The weaker emission was due to the introduction of new defect energy levels inhibiting possible charges recombination. HSGT-400 partially recovered the intensity of PL emitted from SGT; temperature treatment probably removed surface adsorbed species and chemicals (acetylacetonate) included in the TiO2 matrix with a partial loss of defect energy levels.
The lowest recombination rate showed by the HSGT sample with both the unusual stabilization (months) of the superoxide radical ion on its surface in air at room temperature and its ability to absorb visible light make this material an ideal candidate to act as catalyst in the advanced oxidative degradation process of pollutants.15 Particularly, the intrinsic presence of O2˙− allowed us to perform the removal of the pollutant without light irradiation at room temperature. Consequently, we investigated the kinetics of the 2,4-DCP removal from aqueous solution in the dark, with two main objectives: firstly, to demonstrate the catalytic efficiency of HSGT, secondly, because kinetic tests may give insight about the relative importance of surface properties and volume properties of the material. The removal kinetics of 2,4-DCP was accomplished adopting an initial concentration (C0) of 0.3 mmol dm−3 and HSGT to obtain a solid/liquid ratio (R) of 10 (Fig. 7). Two samples of solid catalyst particles were used with different granulometric distributions, namely: a sample with uncontrolled granulometry (fraction A) and another with particle diameter less than 90 μm (fraction B). In both cases the concentration–time profiles obtained tend asymptotically to zero, demonstrating that the overall catalytic process irreversibly tends towards a complete removal of the 2,4-DCP, that is accomplished (in the case of fraction B) in about 1 hour. A complete removal of 2,4-DCP in the presence of titania has been observed in previous studies44–46 though all these studies are concerned at photocatalysis. It is worth noting that the removal kinetics is strongly affected by the surface/volume ratio of HSGT particles. The 2,4-DCP concentration decay was significantly faster when using smaller particles (fraction B). A first possible explanation for this result is that, being the 2,4-DCP degradation a multi-step process, the kinetics of at least one stage is limited by mass-transfer resistances. Yet, this hypothesis was contradicted by the evaluation of Thiele modulus (=1.2 × 10⁻⁴), that showed intraparticle diffusion effect on the overall kinetics not to be significant (see ESI† for the evaluation of the Thiele modulus). A more convincing explanation of the influence of the surface/volume ratio is that the catalytic properties of HSGT are not uniformly distributed within the particles. In other words, the sequence of transformations leading to the formation of O2˙− is partially hindered in the internal core of particles, and consequently the catalytically active sites are prevalently formed on the external surface of the material.
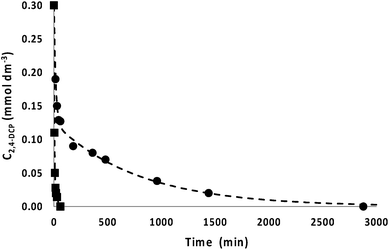 | ||
| Fig. 7 Kinetics of 2,4-DCP removal at room temperature, in the presence of HSGT matrix. C0 = 0.3 mmol dm−3, R = 10, uncontrolled granulometry (●), controlled granulometry, diameter less than 90 μm (■). The interpolation curves have been obtained using a mathematical model described in the ESI.† The estimated parameters are reported in Table S2.† | ||
Conclusions
An amorphous hybrid TiO2–acetylacetonate material was prepared by a sol–gel procedure fully performed at room temperature. The electronic structure of this material is characterized by the presence of both Ti(IV)–acac complex and a small amount (about 6%) of Ti3+. The organic component plays a key role both to obtain a black Ti3+ self-doped anatase TiO2 nanomaterial (HSGT-400) characterized by a very high stability in air and to stabilize reactive oxygen species in air at room temperature for a long time. Actually, the HSGT-400 black sample was obtained for the first time without the use of harsh conditions but by a simple annealing in air at 400 °C as the removal of the acetylacetone supplies reducing organic molecules that induce the formation of a high concentration (about 26%) of Ti atoms with an oxidation state lower than IV. On the other hand HSGT is a visible light-responsive material characterized by a recombination rate of the electron–hole pair so low that the superoxide radical ion O2˙− is stably adsorbed on its surface. Consequently, HSGT exhibits unusual performances in the removal of 2,4-dichlorophenol from water in the dark.Experimental section
Sol–gel synthesis
Titanium(IV) n-butoxide (97+%), acetylacetone (Hacac) (99+%), 1-propanol (99.80+%) and hydrochloric acid (37 wt%), provided by Sigma-Aldrich, were used as precursors. All reagents were used without further purification. A solution containing 10 cm3 of titanium(IV) n-butoxide (29.1 mmol), 1.20 cm3 of acetylacetone (11.6 mmol) and 3.87 cm3 of 1-propanol (51.8 mmol) was prepared, stirred for a few minutes and then mixed with a second solution formed by 5.27 cm3 of aqueous solution HCl 0.10 M and 7.0 cm3 of 1-propanol (93.6 mmol). The resulting molar ratio Ti![[thin space (1/6-em)]](https://www.rsc.org/images/entities/char_2009.gif) :
:![[thin space (1/6-em)]](https://www.rsc.org/images/entities/char_2009.gif) Hacac
Hacac![[thin space (1/6-em)]](https://www.rsc.org/images/entities/char_2009.gif) :
:![[thin space (1/6-em)]](https://www.rsc.org/images/entities/char_2009.gif) propanol
propanol![[thin space (1/6-em)]](https://www.rsc.org/images/entities/char_2009.gif) :
:![[thin space (1/6-em)]](https://www.rsc.org/images/entities/char_2009.gif) water was 1
water was 1![[thin space (1/6-em)]](https://www.rsc.org/images/entities/char_2009.gif) :
:![[thin space (1/6-em)]](https://www.rsc.org/images/entities/char_2009.gif) 0.4
0.4![[thin space (1/6-em)]](https://www.rsc.org/images/entities/char_2009.gif) :
:![[thin space (1/6-em)]](https://www.rsc.org/images/entities/char_2009.gif) 5
5![[thin space (1/6-em)]](https://www.rsc.org/images/entities/char_2009.gif) :
:![[thin space (1/6-em)]](https://www.rsc.org/images/entities/char_2009.gif) 10. The solution obtained was vigorously stirred until the gelation occurred. A homogeneous hardened yellow-orange colored gel was obtained. The gel was left at room temperature for 24 hours and then dried under airflow at 30 °C until constant weight, obtaining a porous amorphous material (HSGT). The xerogel glass-like grains were ground prior to characterization.
10. The solution obtained was vigorously stirred until the gelation occurred. A homogeneous hardened yellow-orange colored gel was obtained. The gel was left at room temperature for 24 hours and then dried under airflow at 30 °C until constant weight, obtaining a porous amorphous material (HSGT). The xerogel glass-like grains were ground prior to characterization.
A reference TiO2 material was also prepared in similar conditions without using acetylacetone in the solution of the Ti precursor. Consequently, when the hydro-alcoholic solution was added to the precursor solution, the instantaneous formation of a particulate gel took place (SGT).
Structural characterization
Both HSGT and SGT dried gels were annealed for 1 hour at 400 °C in air and they are noted as the acronym HSGT-400 and SGT-400. The heat-treatment was adopted to remove the acetylacetonate ligand from the hybrid HSGT gel and to enhance the crystallization in the SGT gel.15The amorphous nature of the dried gels as well as the nature of the crystallizing phases was investigated by X-ray diffraction with a Philips X'PERT-PRO diffractometer by using monochromatized CuKα radiation (40 mA, 40 kV) with a step width of 0.013° 2θ. The mean size of TiO2 anatase nanocrystals was evaluated by the Scherrer equation using the full width at half-maximum (fwhm) of (101) line.
X-ray photoelectron spectroscopy (XPS) is a technique that not only allows the identification of the elements present on the surface of the material under investigation but it also provides the speciation of C, O and Ti present in the samples and their quantitative analysis.
The measurements were performed on powdered samples using a PHI QuanteraSXM (ULVAC-PHI, Chanhassen, MN, U.S.A.) spectrometer equipped with a focused and scanned monochromatic Al Kα X-ray source with beam diameter of 100 μm at 25 watt. The emitted electrons were collected and retarded with a gauze lens system at an emission angle, θ, of 45°. The system is also equipped with a high-performance, floating-column ion gun and an electron neutralizer for charge compensation.
The XPS spectra were acquired in fixed analyzer transmission (FAT) mode, the pass energy being set to 69 eV and the step size to 0.125 eV. The fwhm of the Ag3d5/2 peak is 0.72 eV. Survey spectra were acquired using a pass-energy of 280 eV and a step size of 1 eV. The residual pressure in the analysis chamber was always below 7 × 10⁻⁸ Pa. The calibration was performed using sputter-cleaned gold, silver, and copper as reference materials according to ISO15472: 2014. The accuracy was found to be ±0.1 eV.
High-resolution spectra were processed using CasaXPS software (v2.3.15 dev52, Casa Software Ltd., Wilmslow, Cheshire, U.K.). The background subtraction was performed using the Shirley–Sherwood iterative method. The product of Gaussian and Lorentzian functions was used for curve fitting. The electron neutralizer was used during the analysis, in order to compensate for sample charging, and the spectra were further corrected with reference to adventitious aliphatic carbon taken at 285.0 eV. The quantitative evaluation of XPS data was performed using the first-principles method valid for homogeneous samples.31
Electron Paramagnetic Resonance (EPR) spectra were performed on the powdered samples using an X-band (9 GHz) Bruker Elexys E-500 spectrometer (Bruker, Rheinstetten, Germany). The capillary containing the sample was placed in a standard 4 mm quartz sample tube. The temperature of the sample was regulated at 25 °C and maintained constant during the measurement by blowing thermostated nitrogen gas through a quartz dewar. The instrumental settings were as follows: sweep width, 140 G; resolution, 1024 points; modulation frequency, 100 kHz; modulation amplitude, 1.0 G; time constant, 20.5 ms. EPR spectra were measured with attenuation of 10 dB to avoid microwave saturation of resonance absorption curve. Several scans, typically 32, were accumulated to improve the signal-to-noise ratio. The g values and the spin density of the samples were evaluated by means of an internal standard, Mn2+-doped MgO, prepared by modifying a synthesis protocol reported in literature.47
Ultra-violet and visible light diffuse reflection (UV-Vis-DRS) spectra were recorded in the range of 190–800 nm using a double beam Jasco spectrophotometer. Barium sulfate was exploited as reflectance standard. The measured intensity was expressed as the value of the Kubelka–Munk function F(R).
Steady-state photoluminescence (PL) spectra were excited by a continuous light emission He–Cd laser at 325 nm (KIMMON Laser System). PL was collected at normal incidence respect to the surface of samples through an optical fiber, dispersed in a spectrometer (Princeton Instruments, SpectraPro 300i), and detected using a Peltier cooled charge coupled device (CCD) camera (PIXIS 100F). A long pass filter with a nominal cut-on wavelength of 350 nm was used to remove the laser line at monochromator inlet.
Analytical determination of 2,4-DCP
2,4-Dichlorophenol (2,4-DCP) was analyzed with an Agilent 1200 Series HPLC apparatus (Wilmington U.S.), equipped with a DAD and a ChemStation Agilent Software. A Macherey-Nagel Nucleosil 100-5 C18 column (stainless steel 250 × 4 mm) was utilized. The mobile phase, a binary system of 65![[thin space (1/6-em)]](https://www.rsc.org/images/entities/char_2009.gif) :
:![[thin space (1/6-em)]](https://www.rsc.org/images/entities/char_2009.gif) 35 acetonitrile
35 acetonitrile![[thin space (1/6-em)]](https://www.rsc.org/images/entities/char_2009.gif) :
:![[thin space (1/6-em)]](https://www.rsc.org/images/entities/char_2009.gif) water (1% acetic acid), was pumped at 1 cm3 min−1 flow in isocratic mode. The detector was set at 280 nm and the injection volume was 20 μL. The quantitative determination of 2,4-DCP was performed using a calibration curve between 0.02 and 6.13 mmol dm−3.
water (1% acetic acid), was pumped at 1 cm3 min−1 flow in isocratic mode. The detector was set at 280 nm and the injection volume was 20 μL. The quantitative determination of 2,4-DCP was performed using a calibration curve between 0.02 and 6.13 mmol dm−3.
Removal kinetics of 2,4-DCP by HSGT matrix
A stock solution of pollutant was prepared by dissolving in 500 cm3 of Milli-Q ultrapure water 24.45 mg of 2,4-dichlorophenol (2,4-DCP) (final concentration 0.3 mmol dm−3). The solution was subsequently kept refrigerated.All the experiments were carried out in batch conditions in the dark, in a rotary shaker at room temperature. Blanks of 2,4-DCP in aqueous solution were analyzed in order to check the pesticide stability and the possible sorption to vials. After incubation, the samples were centrifuged at 7000 rpm for 20 minutes and the supernatants were analyzed as above reported.
Kinetic experiments were performed incubating 20 mg of HSGT matrix with 2 cm3 of 2,4-DCP (solid/liquid ratio R = 10) at 0.3 mmol dm−3 concentration for different incubation times, 15, 30, 45, 60, 180, 360, 480, 960, 1440 and 2880 minutes at room temperature.
The removal kinetics of the pollutant in the presence of HSGT was elaborated considering three different kinetic models. The results are reported in the ESI.†
Data processing
All the experiments were carried out in triplicate and the relative standard deviation was lower than 4%.Acknowledgements
The authors wish to express their deep gratitude to Prof. N. D. Spencer (Laboratory for Surface Science and Technology. ETH Zürich, Switzerland) for the access to the XPS facilities. Mr Cossu is acknowledged for the technical assistance.References
- J. Schneider, M. Matsuoka, M. Takeuchi, J. Zhang, Y. Horiuchi, M. Anpo and D. W. Bahnemann, Chem. Rev., 2014, 114, 9919–9986 CrossRef CAS PubMed.
- M. Nolan, A. Iwaszuk, A. K. Lucid, J. J. Carey and M. Fronzi, Adv. Mater., 2016, 28, 5425–5446 CrossRef CAS PubMed.
- S. Lacombe and T. Pigot, Catal. Sci. Technol., 2016, 6, 1571–1592 CAS.
- H. Park, H. Kim, G. Moon and W. Choi, Energy Environ. Sci., 2016, 9, 411–433 CAS.
- J. L. White, M. F. Baruch, J. E. Pander III, Y. Hu, I. C. Fortmeyer, J. E. Park, T. Zhang, K. Liao, J. Gu, Y. Yan, T. W. Shaw, E. Abelev and A. B. Bocarsly, Chem. Rev., 2015, 115, 12888–12935 CrossRef CAS PubMed.
- S. G. Kumar and L. G. Devi, J. Phys. Chem. A, 2011, 115, 13211–13241 CrossRef CAS PubMed.
- L. Li, L. Yu, Z. Lin and G. Yang, ACS Appl. Mater. Interfaces, 2016, 8, 8536–8545 CAS.
- W. Macyk, K. Szaciłowski, G. Stochel, M. Buchalska, J. Kuncewicz and P. Łabuz, Coord. Chem. Rev., 2010, 254, 2687–2701 CrossRef CAS.
- X. Chen, L. Liu, P. Y. Yu and S. S. Mao, Science, 2011, 331, 746–750 CrossRef CAS PubMed.
- X. Chen, L. Liu and F. Huang, Chem. Soc. Rev., 2015, 44, 1861–1885 RSC.
- X. Liu, G. Zhu, X. Wang, X. Yuan, T. Lin and F. Huang, Adv. Energy Mater., 2016, 6, 1600452 CrossRef.
- L. R. Grabstanowicz, S. Gao, T. Li, R. M. Rickard, T. Rajh, D. Liu and T. Xu, Inorg. Chem., 2013, 52, 3884–3890 CrossRef CAS PubMed.
- Q. Wu, F. Huang, M. Zhao, J. Xu, J. Zhou and Y. Wang, Nano Energy, 2016, 24, 63–71 CrossRef CAS.
- Y. Zhou, C. Chen, N. Wang, Y. Li and H. Ding, J. Phys. Chem. C, 2016, 120, 6116–6124 CAS.
- F. Sannino, P. Pernice, C. Imparato, A. Aronne, G. D'Errico, L. Minieri, M. Perfetti and D. Pirozzi, RSC Adv., 2015, 5, 93831–93839 RSC.
- U. Schubert, Acc. Chem. Res., 2007, 40, 730–737 CrossRef CAS PubMed.
- A. Leaustic, F. Babonneau and J. Livage, Chem. Mater., 1989, 1, 240–247 CrossRef CAS.
- A. Leaustic, F. Babonneau and J. Livage, Chem. Mater., 1989, 1, 248–252 CrossRef CAS.
- V. G. Kessler, G. I. Spijksma, G. A. Seisenbaeva, S. Håkansson, D. H. A. Blank and H. J. M. Bouwmeester, J. Sol-Gel Sci. Technol., 2006, 40, 163–179 CrossRef CAS.
- D. Atzei, M. Fantauzzi, A. Rossi, P. Fermo, A. Piazzalunga, G. Valli and R. Vecchi, Appl. Surf. Sci., 2014, 307, 120–128 CrossRef CAS.
- J. Tauc, R. Grigorovici and A. Vancu, Phys. Status Solidi, 1966, 15, 627–637 CrossRef CAS.
- S. Varaganti and G. Ramakrishna, J. Phys. Chem. C, 2010, 114, 13917–13925 CAS.
- Z. Wang, C. Yang, T. Lin, H. Yin, P. Chen, D. Wan, F. Xu, F. Huang, J. Lin, X. Xie and M. Jiang, Adv. Funct. Mater., 2013, 23, 5444–5450 CrossRef CAS.
- Y. Zhou, Y. Liu, P. Liu, W. Zhang, M. Xing and J. Zhang, Appl. Catal., B, 2015, 170–171, 66–73 CrossRef CAS.
- B. Qiu, Y. Zhou, Y. Ma, X. Yang, W. Sheng, M. Xing and J. Zhang, Sci. Rep., 2015, 5, 8591 CrossRef CAS PubMed.
- X. Zou, J. Liu, J. Su, F. Zuo, J. Chen and P. Feng, Chem.–Eur. J., 2013, 19, 2866–2873 CrossRef CAS PubMed.
- W. Fang, M. Xing and J. Zhang, Appl. Catal., B, 2014, 160–161, 240–246 CrossRef CAS.
- N. Serpone, J. Phys. Chem. B, 2006, 110, 24287–24293 CrossRef CAS PubMed.
- H. H. Mohamed and D. W. Bahnemann, Appl. Catal., B, 2012, 128, 91–104 CrossRef CAS.
- M. Berrettoni, M. Ciabocco, M. Fantauzzi, M. Giorgetti, A. Rossi and E. Caponetti, RSC Adv., 2015, 5, 35435–35447 RSC.
- M. Carrus, M. Fantauzzi, F. Riboni, M. Makosch, A. Rossi, E. Selli and J. van Bokhoven, Appl. Catal., A, 2016, 519, 130–138 CrossRef CAS.
- W. Hoffmann, T. Bormann, A. Rossi, B. Müller, R. Schumacher, I. Martin, M. de Wild and D. Wendt, J. Tissue Eng., 2014, 5, 1–14 CAS.
- G. Lu, S. L. Bernasek and J. Schwartz, Surf. Sci., 2000, 458, 80–90 CrossRef CAS.
- E. Carter, A. Carley and D. Murphy, J. Phys. Chem. C, 2007, 111, 10630–10638 CAS.
- A. B. Muñoz-García, F. Sannino, G. Vitiello, D. Pirozzi, L. Minieri, A. Aronne, P. Pernice, M. Pavone and G. D'Errico, ACS Appl. Mater. Interfaces, 2015, 7, 21662–21667 Search PubMed.
- S. Wang, L. Pan, J. J. Song, W. Mi, J. J. Zou, L. Wang and X. Zhang, J. Am. Chem. Soc., 2015, 137, 2975–2983 CrossRef CAS PubMed.
- J. Lee and X. Cui, Mater. Lett., 2016, 175, 114–117 CrossRef CAS.
- X. Xin, T. Xu, L. Wang and C. Wang, Sci. Rep., 2016 DOI:10.1038/srep23684.
- S. Livraghi, M. Chiesa, M. C. Paganini and E. Giamello, J. Phys. Chem. C, 2011, 115, 25413–25421 CAS.
- S. Livraghi, M. Rolando, S. Maurelli, M. Chiesa, M. C. Paganini and E. Giamello, J. Phys. Chem. C, 2014, 118, 22141–22148 CAS.
- M. S. Ghamsari, M. R. Gaeeni, W. Han and H.-H. Park, J. Lumin., 2016, 178, 89–93 CrossRef CAS.
- S. Mathew, A. K. Prasad, T. Benoy, P. P. Rakesh, M. Hari, T. M. Libish, P. Radhakrishnan, V. P. N. Nampoori and C. P. G. Vallabhan, J. Fluoresc., 2012, 22, 1563–1569 CrossRef CAS PubMed.
- E. Grabowska, M. Marchelek, T. Klimczuk, G. Trykowski and A. Zaleska-Medynska, J. Mol. Catal. A: Chem., 2016, 423, 191–206 CrossRef CAS.
- M. Mohammadi and S. Sabbaghi, Environmental Nanotechnology, Monitoring & Management, 2014, 1–2, 24–29 Search PubMed.
- Z. Yan, W. Gong, Y. Chen, D. Duan, J. Li, W. Wang and J. Wang, Int. J. Photoenergy, 2014 DOI:10.1155/2014/968298.
- X. Man, R. Wu, X. Jiang, S. Xu and W. Wang, Cellulose, 2015, 22, 3189–3198 CrossRef CAS.
- N. D. Yordanov, V. Gancheva and V. A. Pelova, J. Radioanal. Nucl. Chem., 1999, 240, 619–622 CrossRef CAS.
Footnote |
| † Electronic supplementary information (ESI) available: FTIR spectrum of HSGT, XPS (C1s and O1s) characterization of titanyl acetylacetonate samples and XPS survey of the investigated samples, modelling of removal kinetics of 2,4-dichlorophenol and evaluation of Thiele modulus. See DOI: 10.1039/c6ra27111a |
| This journal is © The Royal Society of Chemistry 2017 |

