
 Open Access Article
 This Open Access Article is licensed under a Creative Commons Attribution-Non Commercial 3.0 Unported Licence
A highly selective “ON–OFF” probe for colorimetric and fluorometric sensing of Cu2+ in water†
Barnali
Naskar
a,
Ritwik
Modak
a,
Dilip K.
Maiti
a,
Antonio
Bauzá
b,
Antonio
Frontera
 b,
Pulak Kumar
Maiti
c,
Sukhendu
Mandal
c and
Sanchita
Goswami
*a
b,
Pulak Kumar
Maiti
c,
Sukhendu
Mandal
c and
Sanchita
Goswami
*a
aDepartment of Chemistry, University of Calcutta, 92, A.P.C. Road, Kolkata-700 009, India. E-mail: sgchem@caluniv.ac.in; goswami.sanchita@gmail.com
bDepartament de Química, Universitat de les IllesBalears, Crta. deValldemossa km 7.5, 07122 Palma de Mallorca, Baleares, Spain
cDepartment of Microbiology, University of Calcutta, 35, Ballygunge Circular Road, Kolkata, India
First published on 13th February 2017
Abstract
We present herein a diformyl phenol based probe, 3-({3-[2,3-dihydroxy-propylimino-methyl]-2-hydroxy-5-methyl-benzylidene}-amino)-propane-1,2-diol (H5dpm), as a colorimetric and fluorometric chemosensor for selective detection of Cu2+ in aqueous solution under physiological conditions. This simple system produces a colorimetric change enabling naked eye detection as well as on–off fluorescence response towards Cu2+ in an aqueous medium with a detection limit of 11.2 nM. To further demonstrate the utility of H5dpm, we next explored the application of H5dpm for imaging Cu2+ in Vero cells. The attractive imaging properties of the H5dpm probe will open up avenues for molecular imaging and biomedical applications.
1. Introduction
Cu2+ is recognized as the third most abundant metal ion after Fe3+ and Zn2+ and it plays a vital role in several biological processes such as hemoglobin biosynthesis, bone development and nerve function regulation.1–15 However, inadequate as well as excessive uptake of Cu2+ in biological systems can cause disorders associated with neurodegenerative diseases, such as Alzheimer's disease, Menke's disease and Wilson's disease.16–41 Moreover, in a natural environment, copper is also considered as a significant pollutant due to its high toxicity.42–45Among the powerful tools available for Cu2+ detection are atomic absorption spectrometry, quantum dot based assays, inductively coupled mass spectrometry (ICPMS), inductively coupled plasma-atomic emission spectrometry (ICP-AES) and electrochemical techniques.46–48 However, these methods have limitations that require sophisticated instrumentation, large sample amounts and time consuming techniques. On the contrary, optical sensors, which involve naked-eye detection and/or fluorescence intensity change, have attracted great research interest as these provide quick, non-destructive and selective results.
Owing to the significant physiological relevance and associated biomedical implications, development of selective and sensitive colorimetric and/or fluorogenic chemosensors for Cu2+ in biological and environmental samples has captured the attention of many research groups. However, the challenge lies in the development of sensors which are biocompatible and functional in the physiological environment. The versatility of a chemosensor depends upon its working ability in an aqueous environment and at physiological pH, which enables its utilization in in vivo applications. A considerable number of fluorescence based chemosensors have been reported for Cu2+ in the past few years.49–55 However, a couple of them possess disadvantages such as complicated synthetic procedures, unimpressive detection limit, use of organic solvents and interference from other associated metal ions.46,54,56–58 Most of the techniques for accurate and selective detection of Cu2+ are based on chemosensors that undergo a fluorescence intensity quenching (turn-OFF) in presence of analyte.55,59–62
As part of our interest in designing fluorescence sensors for cations,63 we have decided to target the construction of keto–enol tautomerism based chemosensors because tautomerism facilitates electron transfer processes responsible for sensing and their ability to bind the analyte through a specific tautomer makes them an interesting class of probes. Diformyl phenol derivatives have been widely used as fluorescence chemosensors on account of their excellent luminescence properties.64–68 To the best of our knowledge, limited work has been carried out in the development of diformyl phenol based probes for selective colorimetric sensing of Cu2+ and only two examples are there that represent quenching based detection of Cu2+ (ESI Chart 1†).58,69 Furthermore, involvement of tautomeric equilibrium has not been explored till date.
Bearing these in mind, we have decided to evaluate a new diformyl phenol based sensing system, H5dpm, generated by condensation of 2,6-diformyl-4-methylphenol and 3-amino-1,2-propanediol. It can be successfully used for nanomolar sensing of Cu2+ in aqueous solution (Tris buffer, pH = 7.4) via a turn-off fluorescence response. Furthermore, fluorescence imaging experiments of Cu2+ in living Vero cells demonstrated its value of practical application in biological systems.
2. Experimental section
2.1. Materials and physical methods
3-Amino-1,2-propanediol, Zn(OAc)2·2H2O, Cu(NO3)2·3H2O and high-purity Tris-buffer were purchased from Sigma-Aldrich. Buffer was prepared using triple distilled water. Solvents used for spectroscopic studies and for the syntheses were purchased from commercial sources and used as received. Elemental analyses for C, H and N were performed on a Perkin-Elmer 2400 II analyzer. The FT-IR spectra were recorded from KBr pellets in the range of 400–4000 cm−1 on a Perkin-Elmer Spectrum 100 spectrometer. 1H and 13C-NMR spectra were recorded with TMS as internal standard on a Bruker, AV 300 Supercon Digital NMR system. The ESI-MS were recorded on Qtof Micro YA263 mass spectrometer. A Systronics digital pH meter (model 335) was used to measure the pH of the solution, and the adjustment of pH was done using either 50 mM HCl or NaOH solution. The absorption and emission spectra were recorded on a Hitachi UV-vis U-3501 spectrophotometer and Perkin-Elmer LS55 fluorimeter, respectively.3. Syntheses and characterisation
3.1. Synthesis of probe 3-({3-[2,3-dihydroxy-propylimino)-methyl]-2-hydroxy-5-methyl-benzylidene}-amino)-propane-1,2-diol (H5dpm)
The synthesis of 4-methyl-2,6-diformylphenol(2-hydroxy-5-methyl-benzene-1,3-dicarbaldehyde) was accomplished by a method adapted from literature procedure.70 A methanol (15 mL) solution of 4-methyl-2,6-diformylphenol (0.328 g, 2 mmol) was taken and 3-amino-1,2-propanediol (0.375 g, 4 mmol) in 15 mL methanol solution was added to it dropwise with continuous stirring at room temperature. Then the resulting reaction mixture was refluxed for 6.0 h. The solution was filtered, concentrated on a rota-evaporator to get (92%) an oily orange liquid compound which was recrystallised from methanol for purification and was used throughout the experiment and characterisation. Anal. calcd for C15H22N2O5: C, 58.05; H, 7.15; N, 9.03; found: C, 58.03; H, 7.16; N, 9.02; 1H-NMR (300 MHz, DMSO-d6) δH: 14.3 (1H), 8.59 (s, 2H), 7.56 (s, 2H), 4.83 (d, J = 5.2 Hz, 4H), 3.82 (m, 4H), 3.54 (m, 6H), 3.31 (3H); 13C-NMR (300 MHz, DMSO-d6) δC: 161.19, 160.0, 131.76, 125.34, 120.56, 70.54, 63.40, 62.08, 48.12, 39.84, 19.41 (ESI Fig. S1†); selected FT-IR data (KBr, cm−1) ν(OH) = 3413 cm−1, ν(C![[double bond, length as m-dash]](https://www.rsc.org/images/entities/char_e001.gif) N) = 1646 cm−1 (ESI Fig. S3†). ESI-MS m/z, ion: 311.1676, [H5dpm + H]+, C15H23N2O5 (ESI Fig. S4†).
N) = 1646 cm−1 (ESI Fig. S3†). ESI-MS m/z, ion: 311.1676, [H5dpm + H]+, C15H23N2O5 (ESI Fig. S4†).
3.2. Synthesis of complex [Zn–H5dpm] (1)
A methanolic solution (10 mL) of Zn(OAc)2·2H2O (0.439 g, 2 mmol) was added drop wise to a methanolic solution (10 mL) of H5dpm (0.310 g, 1 mmol) with constant stirring and continued for further 2 h. Then, a methanolic solution (5 mL) of NH4SCN (0.076 g, 1 mmol) was added, and the resulting solution was stirred for 4 h. The greenish yellow solution was filtered and kept for slow evaporation. Crystals of complex 1, suitable for X-ray structure, were obtained at ambient temperature within 3 days. Yield: 81%. Anal. calcd for C20H27N3O9SZn2: C, 38.98; H, 4.42; N, 6.82. Found: C, 38.97; H, 4.41; N, 6.80. Selected FT-IR data (KBr, cm−1), (ESI Fig. S3†) ν(OH) = 3367.84 cm−1, ν(CN) = 1638.44 cm−1, ν(SCN) = 2078.62 cm−1, ESI-MS m/z, ion: 557.0260, [H4dpm + Zn2(OAC)2]+, C19H27N2O9Zn2 (ESI Fig. S4†).
3.3. Synthesis of complex [Cu–H5dpm] (2)
To a solution of Cu(NO3)2·3H2O (0.483 g, 2 mmol) in methanol (10 mL) was added drop wise a methanol solution of H5dpm (0.310 g, 1 mmol) with constant stirring for further 1 h. The mixture was refluxed for 2 h. The green solution was filtered and kept for slow evaporation. After a few days, green crystalline compound were obtained. Yield: 78%. Anal. calcd for C15H19N2O5Cu2: C, 41.47; H, 4.41; N, 6.45; found: C, 41.45; H, 4.39; N, 6.43. 1H-NMR (300 MHz, DMSO-d6) δH: 15.25 (1H, CH3–OH), 11.89 (2H), 7.94 (2H), 5.60 (4H), 3.34 (4H), 3.20 (6H), 3.31 (3H) (ESI Fig. S2†); selected FT-IR data (KBr, cm−1), ν(OH) = 3367.19 cm−1, ν(CN) = 1634.26 cm−1, ν(NO3) = 1462 cm−1 (ESI Fig. S3†); ESI-MS m/z, ion: 435.19, {[H5dpm − 3H] + 2Cu2+}+, C15H19N2O5Cu2 (ESI Fig. S4†).
3.4. Cell culture
Vero cell (Vero 76, ATCC no. CRL-1587) lines were prepared from continuous culture in Dulbecco's modified Eagle's medium (DMEM, Sigma Chemical Co., St. Louis, MO) supplemented with 10% fetal bovine serum (Invitrogen), penicillin (100 µg mL−1), and streptomycin (100 µg mL−1). The Vero 76 were obtained from the American Type Culture Collection (Rockville, MD) and maintained in DMEM containing 10% (v/v) fetal bovine serum and antibiotics in a CO2 incubator. Cells were initially propagated in 75 cm2 polystyrene, filter-capped tissue culture flask in an atmosphere of 5% CO2 and 95% air at 37 °C in CO2 incubator. When the cells reached the logarithmic phase, the cell density was adjusted to 1.0 × 10⁵ per well in culture media. The cells were then used to inoculate in a glass bottom dish, with 1.0 mL (1.0 × 10⁴ cells) of cell suspension in each dish. After cell adhesion, culture medium was removed. The cell layer was rinsed twice with phosphate buffered saline (PBS), and then treated according to the experimental need.3.5. Cell imaging study
For fluorescence imaging studies Vero cells, 1 × 10⁴ cells in 1000 µL of medium, were seeded on sterile 35 mm dish, glass bottom culture dish (ibidi GmbH, Germany), and incubated at 37 °C in a CO2 incubator for 10 hours. Then cells were washed with 500 µL PBS followed by incubation with final concentration of 0.4 mM H5dpm dissolved in 1000 µL DMEM at 37 °C for 30 min in a CO2 incubator and washed with 500 µL phosphate buffered saline PBS (pH 7.4) to remove any free H5dpm. Again 1000 µL PBS was added and observed under an Olympus IX71 microscope. Images were analyzed by Image-pro plus (version 6.3) with excitation at nearby 433 nm Enhanced Cyan FP (ECFP)-specific filter, and emit at nearby 510 nm. The cells were incubated in PBS with metal solution [Cu(NO3)2·3H2O] to a final concentrations of 4 mM, incubated for 30 min and images were captured.3.6. Theoretical methods
The geometrical structures in their singlet ground state (S0) and excited state (S1) were optimized by DFT and time-dependent DFT (TDDFT)71–73 methods with the BP86 functional74 approach associated with the conductor-like polarizable continuum model (CPCM).75–77 The geometries of the complex in their ground S0 were optimized in solution phase. For the complex and ligand keto and enol forms) we calculated 60 singlet–singlet transition using their ground S0 state geometries and using the conductor-like polarizable continuum model. For all atoms we have used 6-311+G* as the basis set. The calculated electronic density plots for the frontier molecular orbitals were prepared by using the GaussView 5.0 software. All the calculations were performed with the Gaussian 09 software package.783.7. Sample preparation for UV-vis and fluorescence spectral studies
Stock solutions of various metal ions were prepared in deionized water and a stock solution of H5dpm was prepared in Tris-buffer solution (25 mM, pH = 7.4) with deionized water. In UV-visible titration experiment, aqueous solution of H5dpm 10−3 (M) was filled in a quartz optical cell of 1.0 cm optical path length to achieve a final concentration of solution of H5dpm 5 × 10⁻⁶ (M) in 2000 µL and metal ions were added using a micropipette to a solution of H5dpm. For emission titration experiment, 10−3 (M) solution of H5dpm 10 µL was taken in a quartz optical cell of 1.0 cm optical path length in 2000 µL and then stock solutions of metal ions were added gradually to it by using micropipette. Spectral data were recorded at 1 min after the addition of the metal ions for both titration. For fluorescence measurements, excitation was provided at 434 nm in Tris-buffer solution (25 mM, pH = 7.4), and a strong emission peak was observed at 510 nm.3.8. Evaluation of fluorescence quantum yield in aqueous Tris-buffer solution
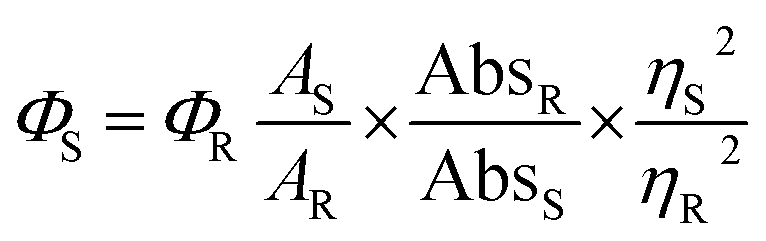
Fluorescence quantum yield was determined using quinine sulphate (ΦR = 0.546 in 0.1 M H2SO4) as standard at an excitation wavelength of 434 nm. The quantum yield is calculated using the following equation.where A terms denote the integrated area under the fluorescence curve, Abs denotes absorbance, η is the refractive index of the medium and Φ is the fluorescence quantum yield. Subscripts S and R denote the respective parameters for the studied sample and reference, respectively.
3.9. Determination of Cu2+ in aqueous Tris-buffer solution
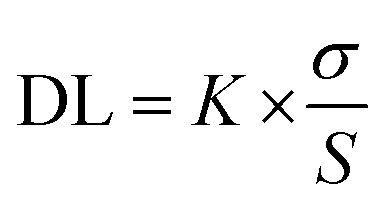
The limit of detection (LOD) was calculated from the fluorescence titration data based on a reported and broadly used method.79–81 In ESI Fig. S11† reveals a good linear correlation between the value of relative fluorescence (ΔF = F0 − F) and the concentration of Cu2+ ions with a correlation coefficient (R2) of 0.9986. A linear regression curve was then fitted to these normalized ratio data, and the point at which this line crossed the ordinate axis was considered as the detection limit. The detection limit was calculated using the following equation.where K = 2 or 3 (we take 3 in this case), σ is the standard deviation of the blank solution and S is the slope of the calibration curve.
4. Results and discussion
4.1. Syntheses and general characterization
A new water soluble sensor H5dpm was designed and synthesized through one step condensation of 4-methyl-2,6-diformylphenol and 3-amino-1,2-propanediol in a 1![[thin space (1/6-em)]](https://www.rsc.org/images/entities/char_2009.gif) :2 molar ratio in methanol medium and isolated as a yellow oily compound as shown in Scheme 1 and characterized by FT-IR, 1H-NMR, 13C-NMR and ESI-MS method. ESI-MS study of H5dpm in methanol solution exhibits an intense peak at m/z = 311.16, which can be assigned to [H5dpm + H]+, C15H23N2O5 (ESI Fig. S4†). The FT-IR spectra clearly indicate the CN and O–H stretching band of the chemosensor H5dpm appears at 1646 cm−1 and 3413 cm−1 (ESI Fig. S3†). To explore the coordinating behavior of H5dpm toward 3d metal ions, H5dpm was allowed to react with zinc metal ions using Zn(OAc)2·2H2O and NH4SCN, in 1:2:1 molar ratio, in methanol solution. The reaction mixture was kept for slow evaporation method and yellow colored single crystals of complex 1 was separated out and the structure was authenticated using single crystal X-ray diffraction analyses. H5dpm was further made to react with Cu(NO3)2·3H2O in methanol solution, to afford deep green crystalline complex 2 in reasonably good yield but single crystals suitable for X-ray diffraction were not obtained even after several attempts. Besides elemental analysis, all the complexes were initially characterized by FT-IR spectra. A strong and sharp band due to the azomethine ν(CN) group appears at 1638.44 and 1634.26 cm−1 for complexes 1 and 2, respectively. The sharp peak at 2078.62 cm−1 for complex 1 is due to the presence of thiocyanate ion. In order to establish the identity of the species present in solution, the electrospray ionization mass spectra (ESI-MS positive) of complexes 1 and 2 were recorded in methanol solution. The complex 1 exhibited the base peak at m/z = 557.02, which can be assigned to the cationic species [H4dpm + Zn2(OAC)2]+, C19H27N2O9Zn2. The appearance of peak at m/z = 435.19, may be attributed to the presence of {[H5dpm − 3H] + 2Cu2+}+, C15H19N2O5Cu2.
:2 molar ratio in methanol medium and isolated as a yellow oily compound as shown in Scheme 1 and characterized by FT-IR, 1H-NMR, 13C-NMR and ESI-MS method. ESI-MS study of H5dpm in methanol solution exhibits an intense peak at m/z = 311.16, which can be assigned to [H5dpm + H]+, C15H23N2O5 (ESI Fig. S4†). The FT-IR spectra clearly indicate the CN and O–H stretching band of the chemosensor H5dpm appears at 1646 cm−1 and 3413 cm−1 (ESI Fig. S3†). To explore the coordinating behavior of H5dpm toward 3d metal ions, H5dpm was allowed to react with zinc metal ions using Zn(OAc)2·2H2O and NH4SCN, in 1:2:1 molar ratio, in methanol solution. The reaction mixture was kept for slow evaporation method and yellow colored single crystals of complex 1 was separated out and the structure was authenticated using single crystal X-ray diffraction analyses. H5dpm was further made to react with Cu(NO3)2·3H2O in methanol solution, to afford deep green crystalline complex 2 in reasonably good yield but single crystals suitable for X-ray diffraction were not obtained even after several attempts. Besides elemental analysis, all the complexes were initially characterized by FT-IR spectra. A strong and sharp band due to the azomethine ν(CN) group appears at 1638.44 and 1634.26 cm−1 for complexes 1 and 2, respectively. The sharp peak at 2078.62 cm−1 for complex 1 is due to the presence of thiocyanate ion. In order to establish the identity of the species present in solution, the electrospray ionization mass spectra (ESI-MS positive) of complexes 1 and 2 were recorded in methanol solution. The complex 1 exhibited the base peak at m/z = 557.02, which can be assigned to the cationic species [H4dpm + Zn2(OAC)2]+, C19H27N2O9Zn2. The appearance of peak at m/z = 435.19, may be attributed to the presence of {[H5dpm − 3H] + 2Cu2+}+, C15H19N2O5Cu2.
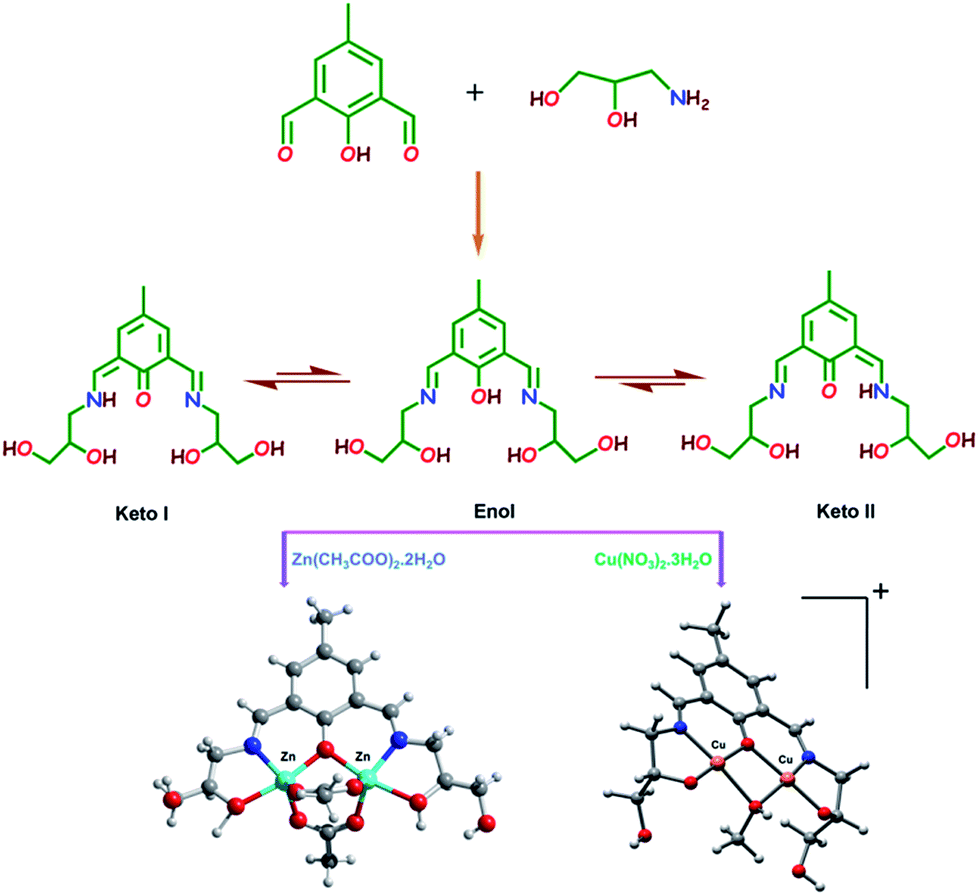 | ||
| Scheme 1 Synthetic scheme for the synthesis of chemosensor (H5dpm), zinc complex 1 and copper complex 2. | ||
4.2. UV-vis spectroscopic features of H5dpm
The UV-vis absorption spectrum of H5dpm was investigated in aqueous solution of 25 mM Tris-buffer at pH 7.4 which revealed a strong band with a maximum absorbance peak at 434 nm. To pinpoint the selectivity of H5dpm, chloride salts of (20 equiv.) Na+, K+, Ca2+, Mg2+, Mn2+, Ba2+, Fe2+, Fe3+, Zn2+, Cd2+, Hg2+, Ni2+, Sr2+, Cu2+, Co2+ and Al3+ in Tris-buffer solution (25 mM, pH = 7.4) were selected (ESI Fig. S6†). As evident from Fig. 1, a conspicuous change in UV-vis spectral pattern was manifested only in presence of Cu2+ in the absorption spectra of H5dpm. In order to gain a quantitative insight regarding the specific interaction of Cu2+ and H5dpm, a sequential titration of H5dpm with increasing Cu2+ (0–10 equiv. of Cu2+) was pursued. As can be seen from Fig. 1, the maximum absorption intensity at 434 nm gradually decreased and another new absorption band at 375 nm is gradually generated with solution color turning from yellowish to sky blue after addition of 10 equiv. of Cu2+ (Fig. 2). The binding stoichiometry between H5dpm and Cu2+ has been investigated using the Job's method by varying concentrations of H5dpm and Cu2+ and monitoring the change in absorption at 375 nm. The experimental results are fitted considering 2:1 complex formation between Cu2+ and H5dpm (ESI Fig. S10†). The goodness of the linear fit of the Benesi–Hildebrand (B–H) plot83 (R2 = 0.998) of 1/(A0 − A) vs. 1/[Cu2+]2 for 2:1 complex formation (ESI Fig. S8†) confirms the binding stoichiometry between Cu2+ and H5dpm with binding constant value 5.90 × 10¹¹ M−2. To characterize the H5dpm–Cu2+ complex more intensely, ESI-MS experiment was performed which is in line with the existence 2:1 complexes H5dpm–Cu2+. In ESI-MS spectra the base line peak is for the {[H5dpm − 3H] + 2Cu2+}+. Although X-ray quality single crystals of the H5dpm–Cu2+ complex were not obtained, we were able to obtain crystals of a dimeric Zn2+ complex [H4dpm + Zn2(OAc)2]+, (C19H27N2O9Zn2) (ESI Fig. S5, Tables S1 and S2†) which reinforces the binding modes of H5dpm.
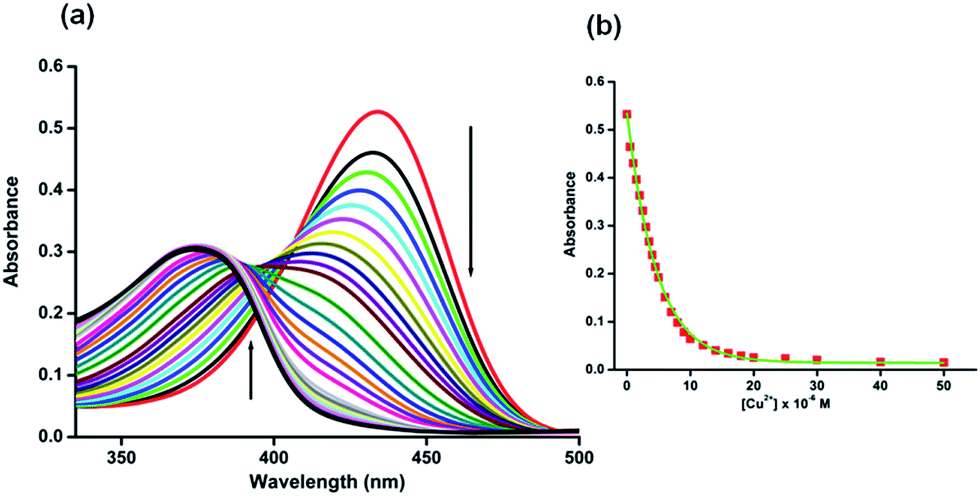 | ||
| Fig. 1 Left: UV-vis spectra of H5dpm (5 × 10⁻⁶ M) in Tris-buffer solution (25 mM, pH = 7.4) in the presence of various concentration of Cu2+ (0, 0.5, 1, 1.5, 2, 2.5, 3, 3.5, 4, 4.5, 5, 6, 7, 8, 9, 10, 12, 14, 16, 18, 20, 25, 30, 40 and 50 (×10−6) M. Upward arrow indicates gradual increase of absorption at 375 nm wavelength while downward arrow indicates gradual decrease in absorption at 434 nm wavelength with increasing concentration of Cu2+. Right: The absorption of H5dpm at 434 nm as a function of [Cu2+] in Tris buffer solution (25 mM, pH = 7.4). | ||
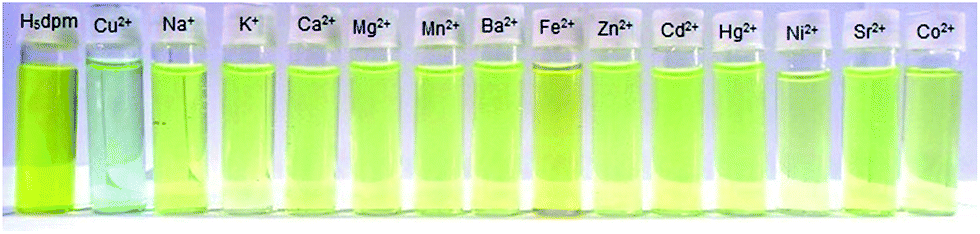 | ||
| Fig. 2 Visual color change from yellow to sky blue on addition of Cu2+ ion in the aqueous solution of H5dpm among different cations. | ||
Thus, application of the probe H5dpm renders naked eye detection of Cu2+ in aqueous solution (Tris-buffer, pH 7.4) (Fig. 2).
4.3. Fluorescence spectroscopic response of H5dpm
The fluorescence spectrum of H5dpm shows a strong emission band at 510 nm (λex = 434 nm) with a high quantum yield (Φ = 0.248). To explore the utility of H5dpm as a simple sensing system for metal ions in aqueous solution (25 mM Tris-buffer at pH 7.4), nitrate/chloride salts of various cations (20 equiv.) were used and fluorescence spectra were recorded. No change in emission is observed for Na+, K+, Ca2+, Mg2+, Mn2+, Ba2+, Fe2+, Fe3+, Zn2+, Cd2+, Hg2+, Ni2+, Sr2+, Cu2+, Co2+ and Al3+ (ESI Fig. S14†). However, a significant quenching (Φ = 0.035) is evident for Cu2+ with an insignificant interference from Co2+. To get further insight into the sensing characteristics of H5dpm toward Cu2+, the fluorescence titration experiments were performed by incremental addition of Cu2+ (0–50 µM) to H5dpm (5 µM) (Fig. 3). The fluorescence intensity decreased gradually with the addition of increasing amount of Cu2+.82 Competitive studies were also carried out for mixtures of Cu2+ and 20 equiv. of other metal ions, and the predominating quenching response was again seen only for Cu2+ (Fig. 4). The fluorescence responses of H5dpm toward Cu2+ were pH-dependent, and the maximal signal was observed in the pH range of 5–11 (ESI Fig. S16†). This indicated that H5dpm could be employed to detect Cu2+ in quite a wide pH range.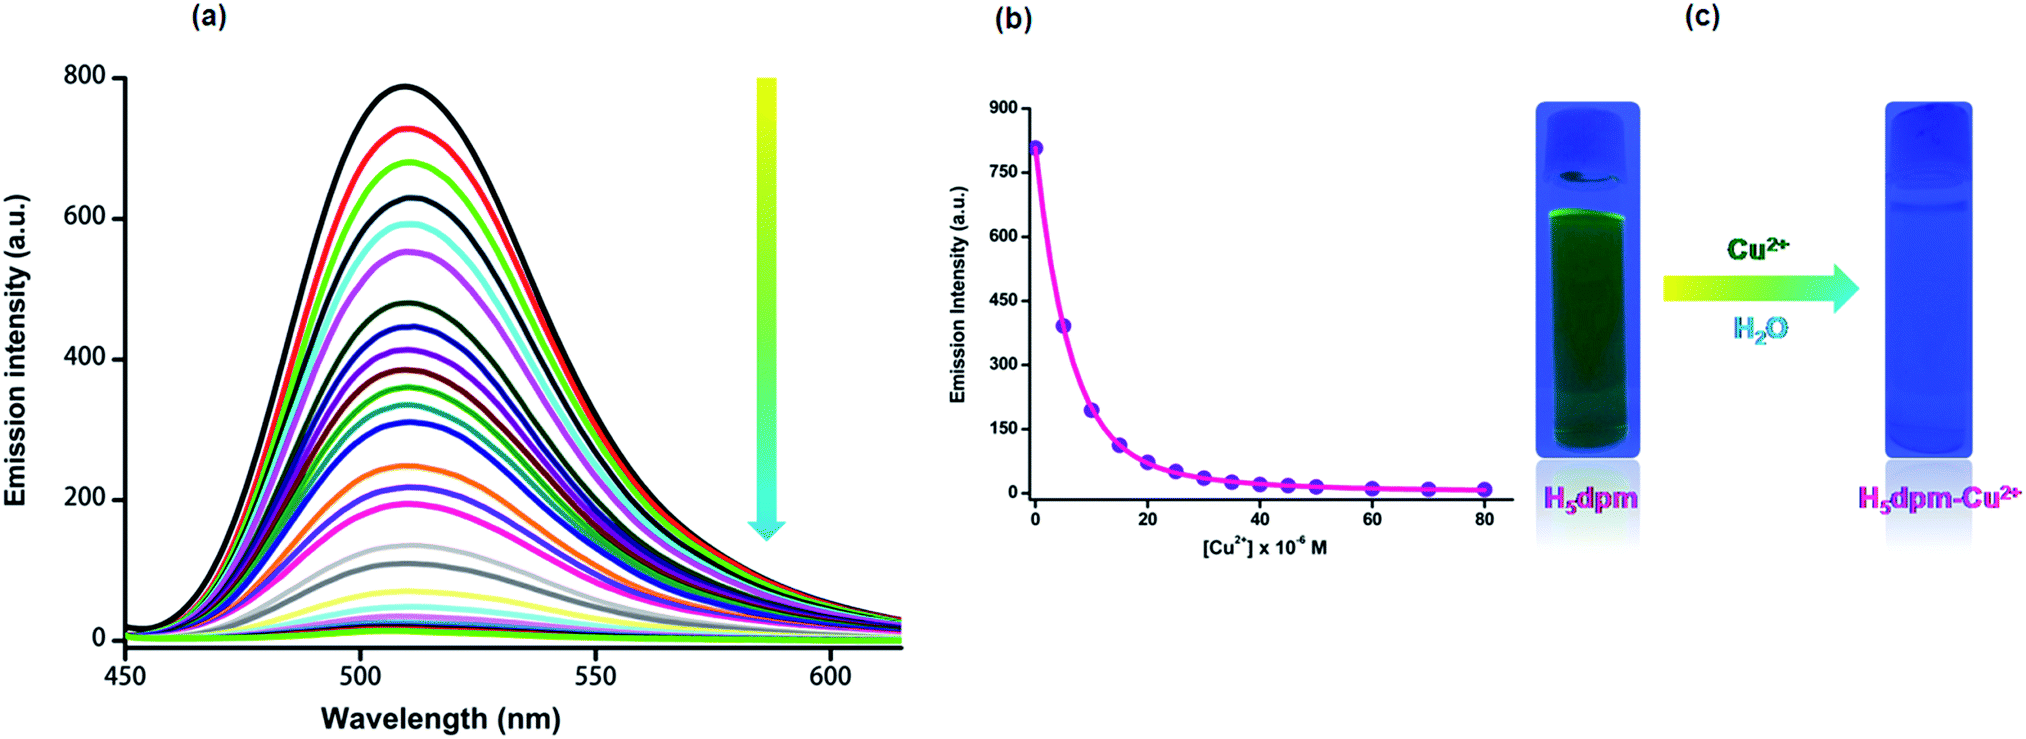 | ||
| Fig. 3 (a) Fluorescence spectra of H5dpm (5 × 10⁻⁶ M) with addition of increasing amount of Cu2+ (0, 0.5, 1, 1.5, 2, 2.5, 3, 3.5, 4, 4.5, 5, 5.5, 6, 6.5, 7, 8, 9, 10, 11, 13, 15, 20, 25, 30, 35, 40, 45 and 50 µM) in Tris-buffer (25 mM, pH = 7.4) solution. (b) Fluorescence emission intensity of H5dpm as a function of [Cu2+] at 510 nm (λex = 434 nm, λem = 510 nm, slit: 5 nm/5 nm). (c) Colour change in the emission intensity addition of Cu2+ ion in the H5dpm solution under a UV lamp (366 nm). | ||
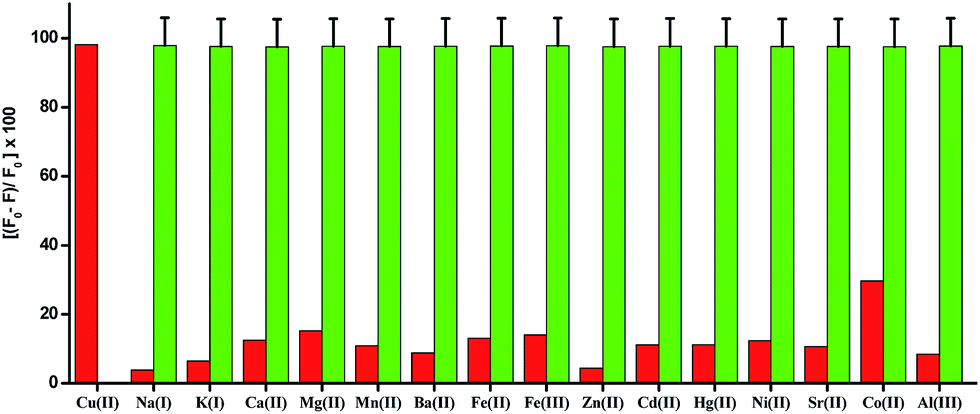 | ||
| Fig. 4 Fluorescence Quenching Efficiency (FQE) of H5dpm (5 × 10⁻⁶ M) in Tris buffer solution (25 mM, pH = 7.4) in the presence of 100 µM of different types of metal ions except Cu2+ (50 µM) as a bar graph [the red bar portion]. Fluorescence Quenching Efficiency (FQE) of a mixture of H5dpm (5 × 10⁻⁶ M) solution with other metal ions (100 µM) followed by addition of 50 µM Cu2+ to the solution [the green bar portion] (λex = 434 nm, λem = 510 nm, slit: 5 nm/5 nm). | ||
The binding constant between H5dpm and Cu2+ derived from the fluorescence titration data using B–H equation83 (R2 = 0.997) was found to be 4.99 × 10¹¹ M−2 (ESI Fig. S9†) and the limit of detection (LOD) was estimated to be 11.2 nM for Cu2+ ion in solution (ESI Fig. S11†). Noticeably, we also observed anion independency of selective Cu2+ detection by experimenting with Cu(NO3)2, CuCl2, Cu(CH3COO)2, Cu(SO4)2 and Cu(ClO4)2 (ESI Fig. S7 and S15†). Both the absorption (434 and 375 nm) and emission (510 nm) intensities of H5dpm can be reversibly switched by alternating addition of Cu2+/Na2H2EDTA, enabling H5dpm a reversible Cu2+ sensor (ESI Fig. S12 and S13†).
The fluorescence quenching phenomenon may be attributed to the reverse photo-induced electron transfer (reverse PET) from 4-methylphenyl moiety to the phenolic–OH and imine nitrogen because of the decrease in electron density upon complexation with Cu2+ (Scheme 2).58,69,84
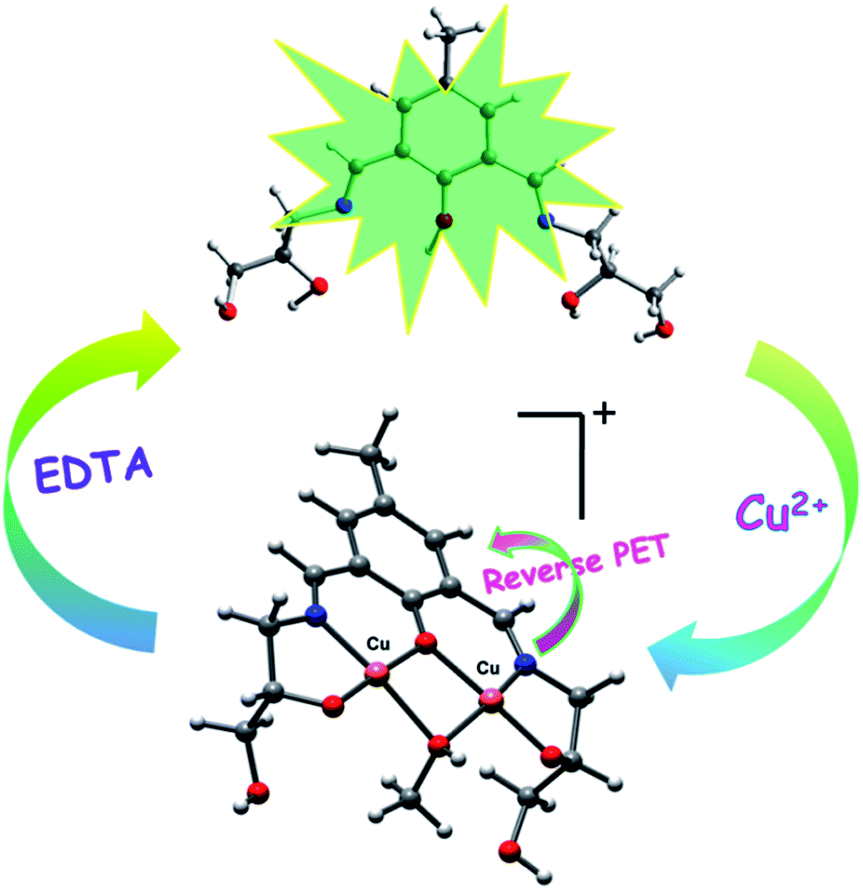 | ||
| Scheme 2 Schematic illustration of proposed mechanism for the fluorescence changes of chemosensor (H5dpm) upon addition of Cu2+. | ||
As evident from Schemes 1 and 2, the probe H5dpm contains abundant hydroxyl and imino groups making the probe susceptible to hydrogen bonding interactions. Therefore, we can presume that the spectral signature would be significantly affected by solvent polarity. Thus, we have studied the whole phenomenon in different media by varying the polarity of the solvent used (DMSO, DMF, acetonitrile, THF, ethanol, methanol and H2O) to rationalize the solvent–solute interactions. Linear Solvation Energy Relationships (LSERs) are used in order to quantify the importance of specific and non-specific interactions85,86 (ESI Fig. S17, S18 and S19†). From ESI Fig. S17,† it is clear that blue shift occurs with increasing solvent polarity. We have further employed Kamlet–Taft–Abboud86 equation and calculated the relative contributions of each of the parameters (ESI Fig. S18 and S19†) which indicates significant hydrogen bonding interactions with hydrogen bond donor (HBD) and hydrogen bond acceptor (HBA) solvents as expected from the structure of the probe. ESI Fig. S19† corresponds to blue shift with increasing HBA basicity of solvents. This means that the energy difference between the ground and excited state of the H5dpm increases when the HBA strength of the solvents increases.
4.4. Computational studies of chemosensor (H5dpm) and H5dpm–Cu2+ complex
To understand the keto–enol switching mechanism prevalent in H5dpm, we have theoretically investigated the phenomenon using density functional theory (DFT) method and time-dependent DFT (TDDFT) methods with the BP86 functional approach associated with the conductor-like polarizable continuum model (CPCM).N bond that does not participates in the intramolecular H-bond. The LUMO is basically composed by the phenolic aromatic moiety and the conjugated CN bond that participates in the intramolecular H-bond (Fig. 5). The energy difference between the HOMO and LUMO is 2.658 eV. The theoretical absorption band (TD-DFT calculations) is located at 387 nm (f = 0.1114) that is assigned to the S0 → S1 transition. This band does not agree well with the experimental one (λexp = 430 nm), which likely suggests that the enol form is not dominant in solution.
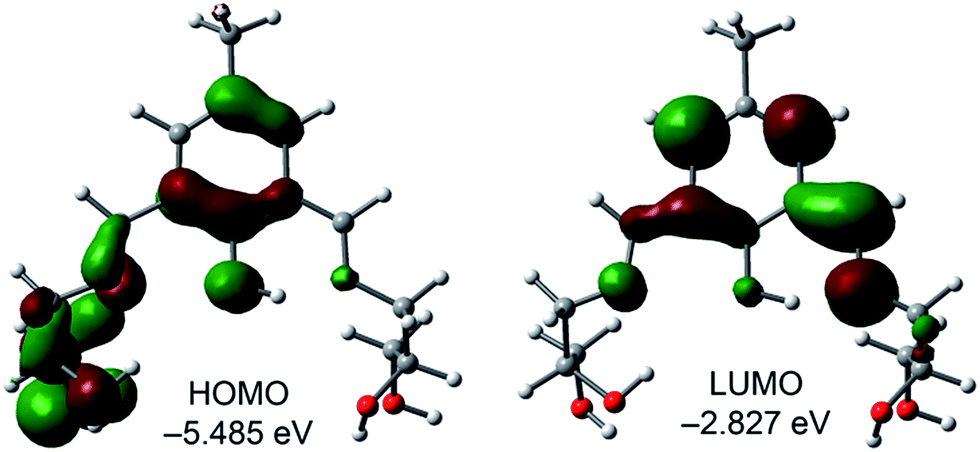 | ||
| Fig. 5 Frontier orbitals of the enol form of H5dpm. | ||
C bond, the lone pair of the sp3-nitrogen atom and the oxygen atom of the keto group. The HOMO−1 and HOMO−2, are stabilized by 0.175 and 0.365 eV compared to the HOMO, respectively. Similarly the LUMO is basically composed by the six-membered keto ring, the exocyclic CC bond, the lone pair of the sp3-nitrogen atom and the oxygen atom of the keto group. The energy difference between the HOMO and LUMO is 2.106 eV. The first calculated absorption band (S0 → S1) is located at 489 nm for the keto form of H5dpm (Fig. 6 and ESI Table S3†) and is composed by HOMO → LUMO and HOMO−1 → LUMO transitions. However this absorption band has a negligible oscillator strength (f = 0.0028) in agreement with the experimental UV spectrum. A strong absorption band (S0 → S2) is found in the theoretical spectrum at 443 nm, which is in reasonable agreement with the experimental absorption value (430 nm). Therefore, the keto form is likely dominant in solution, in agreement with the keto–enol energetic difference (vide supra). This absorption band (S0 → S2 transition) is the result of three excitations (HOMO → LUMO, HOMO−1 → LUMO, and HOMO−2 → LUMO, see ESI Table S3† and Fig. 6).
 | ||
| Fig. 6 Frontier molecular orbitals involved in the UV-vis absorption of the keto form of H5dpm in two representative electronic transitions. | ||
:L = 2:1 stoichiometry, since it has been evidenced experimentally by the ESI-MS experiment. A coordinated MeOH molecule (bridging ligand) has been also included in the calculation to fulfill the coordination sphere of both copper centers as indicated by the 1H-NMR output (ESI Fig. S2†). The minimum energy structure along with some geometric features is shown in Fig. 7. The O–Cu distances involving the MeOH are longer than those involving the alkoxido and phenoxido groups. Since the UV-vis absorption experiments have been performed in water, we have also considered the possibility of having a water molecule instead of a MeOH as a bridging ligand. Both the geometry of the complex and orbital/spin density plots are almost identical, thus supporting the theoretical discussion (ESI Fig. S20 and S21†).
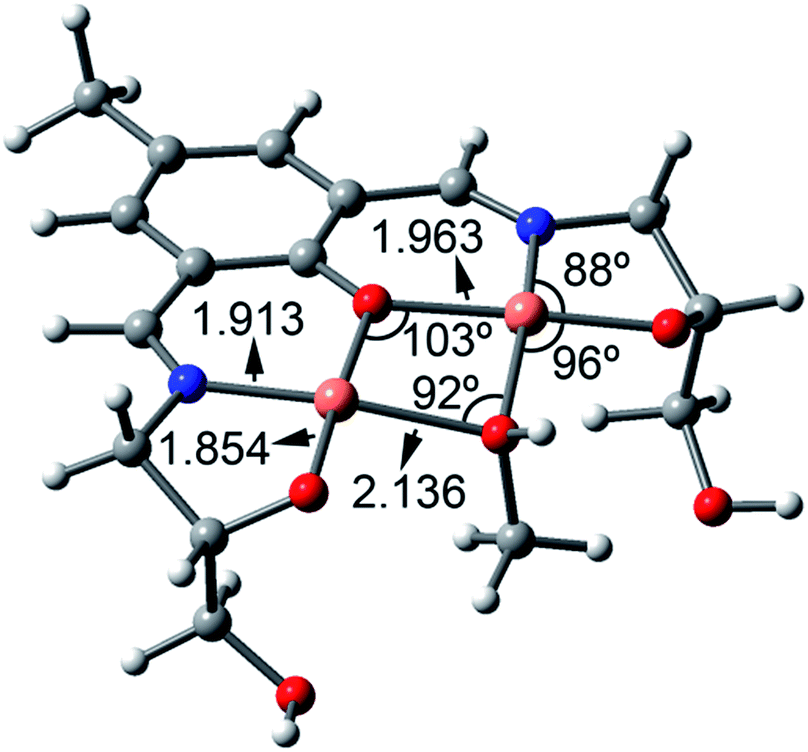 | ||
| Fig. 7 BP86-D3/def2-TZVP optimized structure of [Cu2(H2dpm)MeOH]+ complex. Distances are in Å. | ||
In the ground state (S0) of the complex the HOMO and HOMO−1 are mainly composed by the Cu2+ magnetic orbitals (dx2–y2) and some contribution of the atoms of the ligand that are directly bonded to the metal centers (Fig. 8). In fact the spin density plot for the high spin configuration (ferromagnetic coupling) clearly indicates that the spin is located in the Cu metal centers and the atoms directly bonded to them (Fig. 8C).
 | ||
| Fig. 8 Molecular orbital and spin density plots obtained for complex 2. | ||
The α-LUMO (Fig. 9) is basically composed by the phenolic aromatic moiety and both conjugated CN exocyclic bonds. The energy difference between the α-HOMO and α-LUMO is 1.820 eV. To get better insight into the experimental UV-absorption value TDDFT calculations were done for the complex on the basis of the optimized geometry. The calculated absorption energy associated with its oscillator strength, the main configurations and their assignments of the complex are given in ESI Table S4.† Only one distinguishable singlet → singlet absorption band is found at 387 nm (3.1992 eV and f = 0.0576), which can be mainly attributed (only those contributions higher than 10% are listed in ESI Table S4†) to a combination of the HOMO−4 → LUMO (alpha) and HOMO−13 → LUMO (beta) and HOMO−2 → LUMO+2 (beta) transitions. The HOMO−4 → LUMO (alpha) and HOMO−2 → LUMO+2 (beta) transition are formally equivalent (since the high spin configuration for the Cu(II) complex is used) and can be assigned to π(L) → π*(L) transitions with ILCT character, (Fig. 9). The experimental value is in reasonable agreement with the theoretical one (overestimated in 12 nm), giving reliability to the proposed structure of the complex with the bridging MeOH molecule. For completeness, we have also performed the calculations of the absorption bands using water as solvent. The results are given in ESI Table S4† and they are very similar to those given for the MeOH complex.
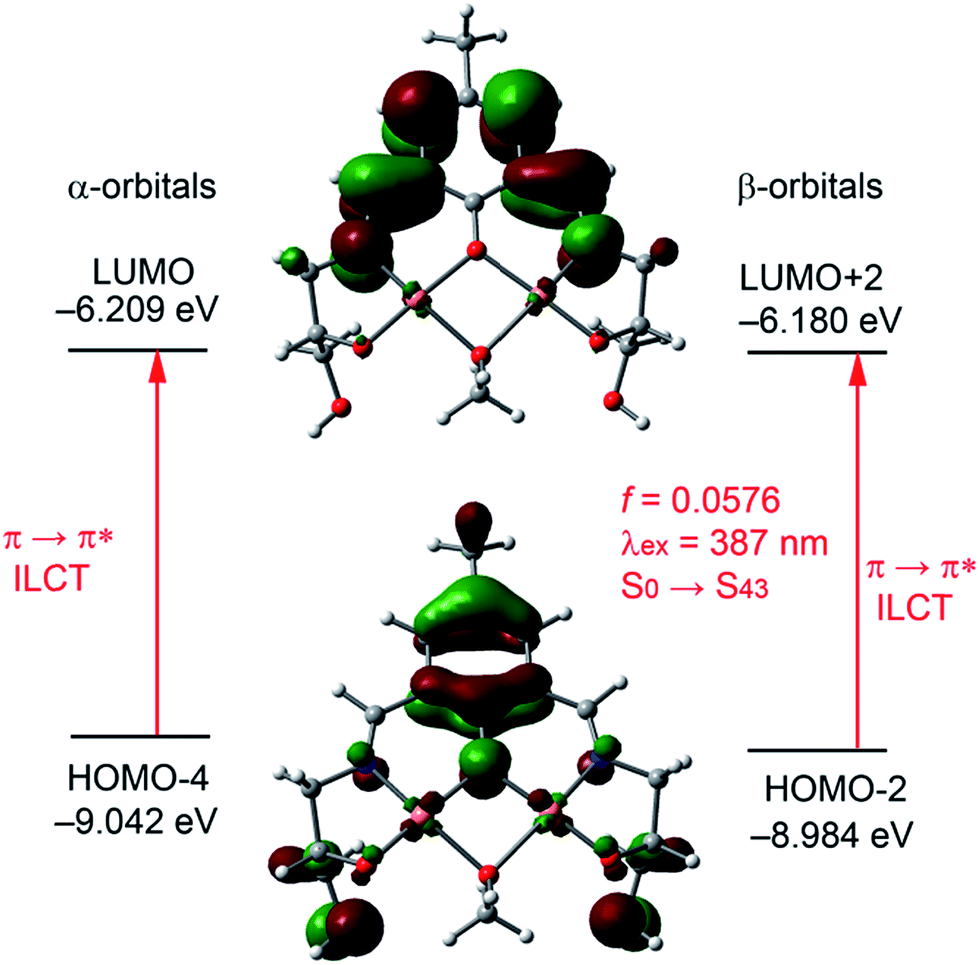 | ||
| Fig. 9 Molecular orbitals involved in the lowest lying observable UV-vis absorption of the complex 2. | ||
4.5. Application of H5dpm for Cu2+ detection in Vero cells
In vitro fluorescence imaging of biological systems is at the forefront of research on optical imaging techniques for biomedical applications. As H5dpm interacts with Cu2+, and the resulting stable complex shows switch-off fluorescence in visible region, it became crucial to assess the effectiveness of H5dpm as a probe for intracellular presence of Cu2+ by fluorescence microscopy. Fluorescence microscopic studies revealed fluorescence for Vero cells when treated with H5dpm (Fig. 10). Upon incubation with H5dpm followed by Cu2+ solution, a switch-off fluorescence was observed inside Vero cells. The fluorescence microscopic analysis strongly suggested that both H5dpm and Cu2+ could readily cross the membrane barrier of the Vero cells. It is significant to mention here that bright field images of treated cells did not reveal any gross morphological changes, which suggested that Vero cells were viable. These findings open up a new avenue for future in vitro biomedical applications of H5dpm.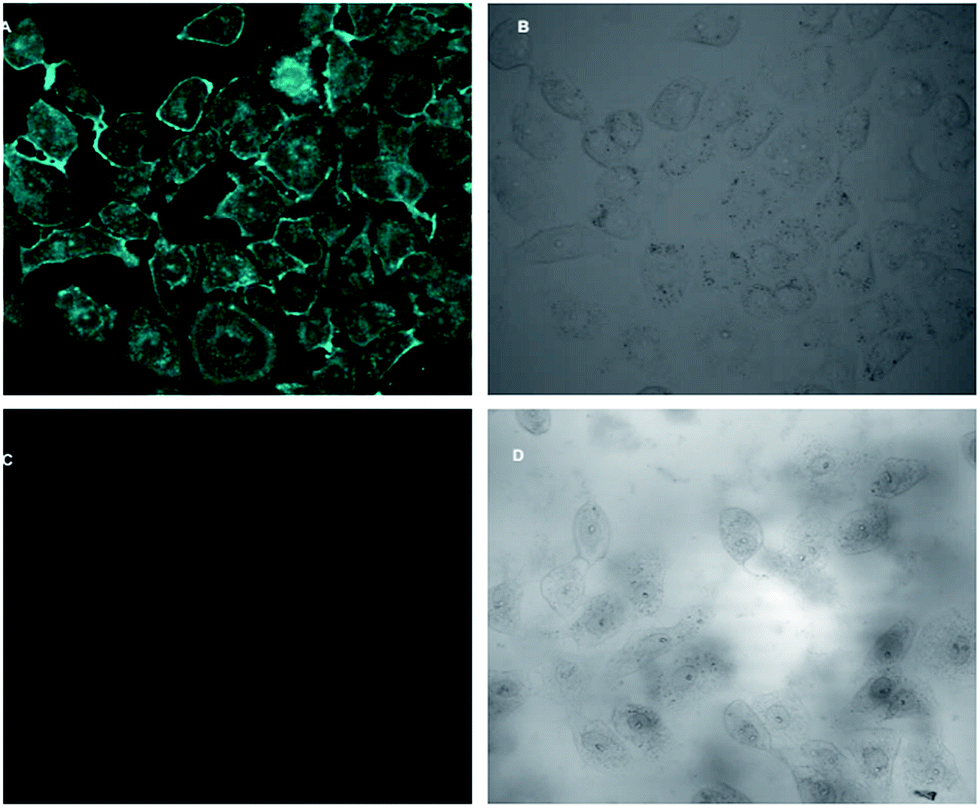 | ||
| Fig. 10 Fluorescence microscopic images in Vero 76 cells: (A) image of the cells, pretreated with H5dpm at 0.4 mM concentration, (B) bright field with H5dpm at 0.4 mM concentration, (C) image of the cells treated with H5dpm followed by metal [Cu(NO3)2·3H2O] at concentration 4 mM, (D) bright field image of the cells treated with H5dpm followed by metal [Cu(NO3)2·3H2O] at concentration 4 mM, and switch-off fluorescence signal is observed. All images were acquired with a 40× objective lens. | ||
5. Conclusion
In conclusion, we have developed a new chemosensor, H5dpm, based on simple condensation of 4-methyl-2,6-diformylphenol and 3-amino-1,2-propanediol which enables selective colorimetric naked eye detection of Cu2+ in aqueous solution. In the absence of Cu2+, H5dpm displays fluorescence emission at 510 nm, and on addition of Cu2+, H5dpm shows significant fluorescence quenching as a result of reverse PET effect. H5dpm demonstrated remarkable selectivity and specificity towards Cu2+ in aqueous solution under physiological conditions with detection limit of 11.2 nM. The reported probe is only the third diformyl phenol based system in literature that exhibits selective colorimetric and fluorometric detection of Cu2+. Theoretical studies were performed to establish the underlying keto–enol tautomerism. H5dpm also allowed for in vitro imaging of Cu2+ in Vero cells. Hence, H5dpm represents a highly promising and biomedically applicable probe for colorimetric, fluorometric and rapid detection of Cu2+ in aqueous solution and its monitoring in vitro.Acknowledgements
B. Naskar acknowledge UGC, India for fellowship (sanction no. RGNF-2013-14-SC-WES-38844). RFSMS fellowship (Sanction No. UGC/740/RFSMS) to R. Modak and is gratefully acknowledge. DST-FIST is acknowledged for providing Single crystal XRD at department of Chemistry, University of Calcutta. A. B. and A. F. thank DGICYT of Spain (projects CTQ2014-57393-C2-1-P and CONSOLIDER INGENIO CSD2010-00065, FEDER funds) for funding. We thank the CTI (UIB) for free allocation of computer time. We sincerely thank Soumen Ghosh and Aniruddha Ganguly of University of Calcutta, Kolkata, for their helpful suggestions.Notes and references
- S. J. Lippard and J. M. Berg, Principles of Bioinorganic Chemistry, University ScienceBooks, Mill Valley, CA, 1994 Search PubMed.
- M. L. Turski and D. J. Thiele, J. Biol. Chem., 2009, 284, 717–721 CrossRef CAS PubMed.
- L. Banci, I. Bertini, S. Ciofi-Baffoni, T. Kozyreva, K. Zovo and P. Paulmaa, Nature, 2010, 465, 645–648 CrossRef CAS PubMed.
- E. L. Que, D. W. Domaille and C. J. Chang, Chem. Rev., 2008, 108, 1517–1549 CrossRef CAS PubMed.
- H. Kozlowski, A. J. Klos, J. Brasun, E. Gaggelli, D. Valensin and G. Valensin, Coord. Chem. Rev., 2009, 253, 2665–2685 CrossRef CAS.
- E. Gaggelli, H. Kozlowski, D. Valensin and G. Valensin, Chem. Rev., 2006, 106, 1995–2044 CrossRef CAS PubMed.
- T. V. O. Halloran and V. C. Culotta, J. Biol. Chem., 2000, 275, 25057–25060 CrossRef PubMed.
- A. C. Rosenzweig and T. V. O. Halloran, Curr. Opin. Chem. Biol., 2000, 4, 140–147 CrossRef CAS PubMed.
- A. Singh, Q. Yao, L. Tong, W. C. Still and D. Sames, Tetrahedron Lett., 2000, 41, 9601–9605 CrossRef CAS.
- S. Puig and D. J. Thiele, Curr. Opin. Chem. Biol., 2002, 6, 171–180 CrossRef CAS PubMed.
- F. Arnesano, L. Banci, I. Bertini and S. C. Baffoni, Eur. J. Inorg. Chem., 2004, 1583–1593 CrossRef CAS.
- D. Y. Sasaki, D. R. Shnek, D. W. Pack and F. H. Arnold, Angew. Chem., Int. Ed., 1995, 34, 905–907 CrossRef CAS.
- R. Kramer, Angew. Chem., Int. Ed., 1998, 37, 772–773 CrossRef CAS.
- A. Torrado, G. K. Walkup and B. Imperiali, J. Am. Chem. Soc., 1998, 120, 609–610 CrossRef CAS.
- P. Grandini, F. Mancin, P. Tecilla, P. Scrimin and U. Tonellato, Angew. Chem., Int. Ed., 1999, 38, 3061–3064 CrossRef CAS PubMed.
- R. Uauy, A. Maass and M. Araya, Am. J. Clin. Nutr., 2008, 88, 867S–871S CAS.
- Z. C. Xu, Y. Xiao, X. H. Qian, J. N. Cui and D. W. Cui, Org. Lett., 2005, 7, 889 CrossRef CAS PubMed.
- R. Seth, S. Yang, S. Choi, M. Sabean and E. A. Roberts, Toxicol. in Vitro, 2004, 18, 501 CrossRef CAS PubMed.
- D. J. Waggoner, T. B. Bartnikas and J. D. Gitlin, Neurobiol. Dis., 1999, 6, 221 CrossRef CAS PubMed.
- J. F. B. Mercer, Trends Mol. Med., 2001, 7, 64 CrossRef CAS PubMed.
- D. R. Brown and H. Kozlowski, Dalton Trans., 2004, 13, 1907–1917 RSC.
- D. Huster and S. Lutsenko, Mol. BioSyst., 2007, 3, 816 RSC.
- D. Strausak, J. F. B. Mercer, H. H. Dieter, W. Stremmel and G. Multhaup, Brain Res. Bull., 2001, 55, 175–185 CrossRef CAS PubMed.
- J. Valentine and P. J. Hart, Proc. Natl. Acad. Sci. U. S. A., 2003, 100, 3617–3622 CrossRef CAS PubMed.
- G. L. Millhauser, Acc. Chem. Res., 2004, 37, 79–85 CrossRef CAS PubMed.
- D. R. Brown and H. Kozlowski, Dalton Trans., 2004, 1907–1917 RSC.
- H. Küpper and P. M. H. Kroneck, Heavy Metal Uptake by Plants and Cyanobacteria, 2005, vol. 44, pp. 97–144 Search PubMed.
- E. Gaggelli, H. Kozlowski, D. Valensin and G. Valensin, Chem. Rev., 2006, 106, 1995–2044 CrossRef CAS PubMed.
- S. Krupanidhi, A. Sreekumar and C. B. Sanjeevi, Indian J. Med. Res., 2008, 128, 448–461 CAS.
- S. V. Wegner, H. Arslan, M. Sunbul, J. Yin and C. He, J. Am. Chem. Soc., 2010, 132, 2567–2569 CrossRef CAS PubMed.
- C. Vulpe, B. Levinson, S. Whitney, S. Packman and J. Gitschier, Nat. Genet., 1993, 3, 7–13 CrossRef CAS PubMed.
- D. J. Waggoner, T. B. Bartnikas and J. D. Gitlin, Neurobiol. Dis., 1999, 6, 221–230 CrossRef CAS PubMed.
- J. S. Valentine and P. J. Hart, Proc. Natl. Acad. Sci. U. S. A., 2003, 100, 3617–3622 CrossRef CAS PubMed.
- D. R. Brown and H. Kozlowski, Dalton Trans., 2004, 1907–1917 RSC.
- K. J. Barnham, C. L. Masters and A. I. Bush, Nat. Rev. Drug Discovery, 2004, 3, 205–214 CrossRef CAS PubMed.
- B. E. Kim, T. Nevitt and D. J. Thiele, Nat. Chem. Biol., 2008, 4, 176–185 CrossRef CAS PubMed.
- G. J. Brewer, Curr. Opin. Chem. Biol., 2003, 7, 207–212 CrossRef CAS PubMed.
- S. P. Leach, M. D. Salman and D. Hamar, Anim. Health Res. Rev., 2006, 7, 97–105 CrossRef PubMed.
- K. J. Barnham and A. I. Bush, Curr. Opin. Chem. Biol., 2008, 12, 222–228 CrossRef CAS PubMed.
- R. R. Crichton, D. T. Dexter and R. J. Ward, Coord. Chem. Rev., 2008, 252, 1189–1199 CrossRef CAS.
- M. C. Linder and M. H. Azam, Am. J. Clin. Nutr., 1996, 63, 797S–811S CAS.
- U. Forstnerand and G. T. Wittmann, Metal Pollution in the Aquatic Environment, Springer, Berlin, Heidelberg, New York, 1981, p. 8 Search PubMed.
- E. Merian, Analysis and Biological Relevance, VCH, Weinheim, 1991, p. 893 Search PubMed.
- E. Merian, Metals and Their Compounds in the Environment, VCH, Weinheim, Germany, 1991 Search PubMed.
- D. W. Domaille, E. L. Que and C. J. Chang, Nat. Chem. Biol., 2008, 4, 168 CrossRef CAS PubMed.
- Y. Liu, P. Liang and L. Guo, Talanta, 2005, 68, 25–30 CrossRef CAS PubMed.
- A. A. Ensafi, T. Khayamian and A. Benvidi, Anal. Chim. Acta, 2006, 561, 225–232 CrossRef CAS.
- A. P. S. Gonzales, M. A. Firmino, C. S. Nomura, F. R. P. Rocha, P. V. Oliveira and I. Gaubeur, Anal. Chim. Acta, 2009, 636, 198–204 CrossRef CAS PubMed.
- S.-P. Wu, T.-H. Wang and S.-R. Liu, Tetrahedron, 2010, 66, 9655–9658 CrossRef CAS.
- D. Maity and T. Govindaraju, Chem.–Eur. J., 2011, 17, 1410–1414 CrossRef CAS PubMed.
- T. Li, Z. Yang, Y. Li, Z. Liu, G. Qi and B. Wang, Dyes Pigm., 2011, 88, 103–108 CrossRef CAS.
- P. Kaur, D. Sareen and K. Singh, Talanta, 2011, 83, 1695–1700 CrossRef CAS PubMed.
- Y. Xiang, A. Tong, P. Jin and Y. Ju, Org. Lett., 2006, 8, 2863–2866 CrossRef CAS PubMed.
- H. S. Jung, P. S. Kwon, J. W. Lee, J. Kim, C. S. Hong, J. W. Kim, S. Yan, J. Y. Lee, J. H. Lee, T. Joo and J. S. Kim, J. Am. Chem. Soc., 2009, 131, 2008–2012 CrossRef CAS PubMed.
- R. Sheng, P. Wang, Y. Gao, Y. Wu, W. Liu, J. Ma, H. Li and S. Wu, Org. Lett., 2008, 10, 5015–5018 CrossRef CAS PubMed.
- L. Yuan, W. Lin, B. Chen and Y. Xie, Org. Lett., 2012, 14, 432–435 CrossRef CAS PubMed.
- A. Kumar, V. Kumar, U. Diwan and K. K. Upadhyay, Sens. Actuators, B, 2013, 176, 420–427 CrossRef CAS.
- V. Chandrasekhar, S. Das, R. Yadav, S. Hossain, R. Parihar, G. Subramanium and P. Sen, Inorg. Chem., 2012, 51, 8664–8666 CrossRef CAS PubMed.
- R. Bergonzi, L. Fabbrizzi, M. Licchelli and C. Mangano, Coord. Chem. Rev., 1998, 170, 31–46 CrossRef CAS.
- Z. C. Liu, Z. Y. Yang, T. R. Li, B. D. Wang, Y. Li, D. D. Qin, M. F. Wang and M. H. Yan, Dalton Trans., 2011, 40, 9370–9373 RSC.
- S. H. Kim, J. S. Kim, S. M. Park and S. K. Chang, Org. Lett., 2006, 8, 371–374 CrossRef CAS PubMed.
- S. Khatua, S. H. Choi, J. Lee, J. O. Huh, Y. Do and D. G. Churchill, Inorg. Chem., 2009, 48, 1799–1801 CrossRef CAS PubMed.
- (a) B. Naskar, R. Modak, Y. Sikdar, D. K. Maiti, A. Banik, T. K. Dangar, S. Mukhopadhyay, D. Mandal and S. Goswami, J. Photochem. Photobiol., A, 2016, 321, 99–109 CrossRef CAS; (b) B. Naskar, R. Modak, Y. Sikdar, D. K. Maiti, A. Bauzá, A. Frontera, A. Katarkar, K. Chaudhuri and S. Goswami, Sens. Actuators, B, 2017, 239, 1194–1204 CrossRef CAS; (c) S. Mandal, Y. Sikdar, D. K. Maiti, G. P. Maiti, S. K. Mandal, J. K. Biswas and S. Goswami, RSC Adv., 2015, 5, 72659–72669 RSC.
- S. Lohar, S. Pal, B. Sen, M. Mukherjee, S. Banerjee and P. Chattopadhyay, Anal. Chem., 2014, 86, 11357–11361 CrossRef CAS PubMed.
- A. Gogoi, S. Mukherjee, A. Ramesh and G. Das, Anal. Chem., 2015, 87, 6974–6979 CrossRef CAS PubMed.
- S. Anbu, S. Kamalraj, C. Jayabaskaran and P. S. Mukherjee, Inorg. Chem., 2013, 52, 8294–8296 CrossRef CAS PubMed.
- U. C. Saha, B. Chattopadhyay, K. Dhara, S. K. Mandal, S. Sarkar, A. R. K. Bukhsh, M. Mukherjee, M. Helliwell and P. Chattopadhyay, Inorg. Chem., 2011, 50, 1213–1219 CrossRef CAS PubMed.
- P. Roy, K. Dhara, M. Manassero, J. Ratha and P. Banerjee, Inorg. Chem., 2007, 46, 6405–6412 CrossRef CAS PubMed.
- S. Anbu, R. Ravishankaran, M. F. C. G. d. Silva, A. A. Karande and A. J. L. Pombeiro, Inorg. Chem., 2014, 53, 6655–6664 CrossRef CAS PubMed.
- R. R. Gagne, C. L. Spiro, T. J. Smith, C. A. Hamann, W. R. Thies and A. K. Shiemke, J. Am. Chem. Soc., 1981, 103, 4073 CrossRef CAS.
- M. E. Casida, C. Jamoroski, K. C. Casida and D. R. Salahub, J. Chem. Phys., 1998, 108, 4439–4449 CrossRef CAS.
- R. E. Stratmann, G. E. Scuseria and M. J. Frisch, J. Chem. Phys., 1998, 109, 8218–8224 CrossRef CAS.
- R. Bauernschmitt and R. Ahlrichs, Chem. Phys. Lett., 1996, 256, 454–464 CrossRef CAS.
- J. P. Perdew, Phys. Rev. B: Condens. Matter Mater. Phys., 1986, 33, 8822–8824 CrossRef.
- M. Cossi, N. Rega, G. Scalmani and V. Barone, J. Comput. Chem., 2003, 24, 669–681 CrossRef CAS PubMed.
- M. Cossi and V. Barone, J. Chem. Phys., 2001, 115, 4708–4717 CrossRef CAS.
- V. Barone and M. Cossi, J. Phys. Chem. A, 1998, 102, 1995–2001 CrossRef CAS.
- M. J. Frisch, G. W. Trucks, H. B. Schlegel, G. E. Scuseria, M. A. Robb, J. R. Cheeseman, G. Scalmani, V. Barone, B. Mennucci, G. A. Petersson, H. Nakatsuji, M. Caricato, X. Li, H. P. Hratchian, A. F. Izmaylov, J. Bloino, G. Zheng, J. L. Sonnenberg, M. Hada, M. Ehara, K. Toyota, R. Fukuda, J. Hasegawa, M. Ishida, T. Nakajima, Y. Honda, O. Kitao, H. Nakai, T. Vreven, J. A. Montgomery Jr, J. E. Peralta, F. Ogliaro, M. Bearpark, J. J. Heyd, E. Brothers, K. N. Kudin, V. N. Staroverov, R. Kobayashi, J. Normand, K. Raghavachari, A. Rendell, J. C. Burant, S. S. Iyengar, J. Tomasi, M. Cossi, N. Rega, J. M. Millam, M. Klene, J. E. Knox, J. B. Cross, V. Bakken, C. Adamo, J. Jaramillo, R. Gomperts, R. E. Stratmann, O. Yazyev, A. J. Austin, R. Cammi, C. Pomelli, J. W. Ochterski, R. L. Martin, K. Morokuma, V. G. Zakrzewski, G. A. Voth, P. Salvador, J. J. Dannenberg, S. Dapprich, A. D. Daniels, Ö. Farkas, J. B. Foresman, J. V. Ortiz, J. Cioslowski and D. J. Fox, Gaussian 09, Revision B.01, Gaussian, Inc., Wallingford, CT, 2009 Search PubMed.
- M. Shortreed, R. Kopelman, M. Kuhn and B. Hoyland, Anal. Chem., 1996, 68, 1414 CrossRef CAS PubMed.
- A. Caballero, R. Martínez, V. Lloveras, I. Ratera, J. Vidal-Gancedo, K. Wurst, A. Tárraga, P. Molina and J. Veciana, J. Am. Chem. Soc., 2005, 127, 15666 CrossRef CAS PubMed.
- (a) W. Y. Lin, L. Yuan, Z. M. Cao, Y. M. Feng and L. L. Long, Chem.–Eur. J., 2009, 15, 5096 CrossRef CAS PubMed; (b) L. Rosa-Romo, M. T. Oropeza-Guzman, A. Olivas-Sarabia and G. Pina-Luis, Sens. Actuators, B, 2016, 233, 459–468 CrossRef; (c) Q. Wu and E. V. Anslyn, J. Am. Chem. Soc., 2004, 126, 14682–14683 CrossRef CAS PubMed; (d) T. Gunnlaugsson, J. P. Leonard and N. S. Murray, Org. Lett., 2004, 6, 1557–1560 CrossRef CAS PubMed; (e) H. Qin, J. Ren, J. Wang and E. Wang, Chem. Commun., 2010, 46, 7385–7387 RSC.
- M. H. Lim, B. A. Wong, W. H. Pitcock Jr, D. Mokshagundam, M. H. Baik and S. J. Lippard, J. Am. Chem. Soc., 2006, 128, 14364 CrossRef CAS PubMed.
- H. Lineweaver and D. Burk, J. Am. Chem. Soc., 1934, 56, 658 CrossRef CAS.
- M. Kumar, R. Kumar, V. Bhalla, P. R. Sharma, T. Kaurb and Y. Qurish, Dalton Trans., 2012, 41, 408 RSC.
- (a) R. W. Taft, J. L. M. Abboud, M. I. Kamlet and M. H. Abraham, J. Solution Chem., 1985, 14, 153–156 CrossRef CAS; (b) M. D. Trone and M. G. Khaledi, J. Chromatogr. A, 2000, 886, 245–257 CrossRef CAS PubMed; (c) M. J. Kamlet, J. L. M. Abboud and R. W. Taft, Prog. Phys. Org. Chem., 1981, 13, 485–630 CrossRef CAS; (d) A. L. Revelli, F. Mutelet and J. N. Jaubert, Ind. Eng. Chem. Res., 2010, 49, 3883–3892 CrossRef CAS.
- (a) R. Papadakis, I. Deligkiozi and A. Tsolomitis, Anal. Bioanal. Chem., 2010, 397, 2253–2259 CrossRef CAS PubMed; (b) T. M. Krygowski and W. R. Fawcett, J. Am. Chem. Soc., 1975, 97, 2143–2148 CrossRef CAS.
Footnote |
| † Electronic supplementary information (ESI) available: FT-IR, ESI-MS, 1H and 13C of H5dpm, photophysical characterization of H5dpm and Cu(II), theoretical data. CCDC 1529126. For ESI and crystallographic data in CIF or other electronic format see DOI: 10.1039/c6ra27017d |
| This journal is © The Royal Society of Chemistry 2017 |